Monday, September 30, 2013

Government Shutdown – So What?

GOVERNMENT SHUTDOWN? So What?
Question: How has the market reacted during previous Government Shutdowns? 
Answer: Not much.
Chart from ZeroHedge at...
http://www.zerohedge.com/news/2013-09-29/how-market-reacted-prior-government-shut-downs

DEBT LIMIT? So what?
Regarding the debt limit, on average: the S&P 500 was down 1%, 5-days before the debt limit was raised and up 0.3%, 5-days after it was raised.  The debt limit has always been raised.  If the debt limit isn’t raised, we could expect a lot more downside.  Chart at…
http://www.zerohedge.com/news/2013-09-29/how-market-reacted-prior-government-shut-downs
MARKET REPORT
Monday, the S&P finished down 0.6% to 1,682 (rounded) at the close.
VIX was up 7% to 16.60.

MARKET INTERNALS (NYSE DATA)
The 10-day moving average of stocks advancing on the NYSE fell to 51% Friday from 53% at the close Friday.  (A number above 50% for the 10-day average is generally good news for the market, but this number has been falling consistently for the last 8-sessions and that's not good. 

New-highs outpaced new-lows Monday, leaving the spread (new-hi minus new-low) at +30 (it was +45 Friday).  The 10-day moving average of change in the spread is minus 15. That just means that over the last 10-days, the spread has been getting worse.

Market Internals are Negative on the market for this short term indicator.

NTSM
Monday, the overall long-term NTSM analysis remains HOLD at the close, but the numbers are so close to a Sell that I could easily just call it a sell – no surprise there given the recent market action.

The 5-day, percent-bulls (bulls/(bulls+bears) in the Guggenheim/Rydex funds I track remains 67%-bulls as of Friday’s close. That is an extreme bullish value that is usually a negative for the markets. 

VIX is now rising at an alarming rate suggesting the Options crowd is finally getting worried about the market.

Still, with QE full on, if I see any signs of a turn-around, I’ll be a buyer of stocks to bring my invested percent up to 50%.  So far, there is little to suggest that this is anything other than a normal correction, regardless of the cause.

MY INVESTED POSITION
I remain about 20% invested in stocks as of 5 March (S&P 500 -1540).  The NTSM system sold at 1575 on 16 April.  (This is just another reminder that I should follow the NTSM analysis and not act emotionally – I am under-performing my own system by about 2%!)  I have no problems leaving 20% or 30% invested.  If the market is cut in half (worst case) I’d only lose 10%-15% of my investments.  It also hedges the bet if I am wrong since I will have some invested if the market goes up.  No system is perfect.

Friday, September 27, 2013

Consumer Confidence Down Slightly…Consumer Spending Up

MICHIGAN CONSUMER SENTIMENT FALLS (Business Week)
Confidence among consumers declined to a five-month low in September as Americans’ views on the economy dimmed…The Thomson Reuters/University of Michigan final index of sentiment decreased to 77.5 this month from 82.1 in August…“Most surveys show that consumer confidence has softened in recent months,” Ryan Wang, a New York-based economist at HSBC Securities USA Inc., said before the report. “The reading is still higher than a few years ago, and that’s mostly due to higher home prices and gradual improvement in the labor market."  Story at... 
http://www.businessweek.com/news/2013-09-27/consumer-sentiment-in-u-dot-s-dot-falls-to-lowest-level-since-april

I reported on this issue earlier, but here’s another note of concern regarding junk-bond/S&P 500 spread.

JUNK BONDS ARE SENDING A CONCERNING MESSAGE FOR STOCKS (Kimble Charting Solutions posted at Advisor Perspectives)
"If history is a good guide, the relative weakness of junk bonds compared to the S&P 500 is sending a concerning message about stock prices in the future."  Charts at dShort.com at…
http://advisorperspectives.com/dshort/guest/Chris-Kimble-130927-Joe-Friday.php

US CONSUMER SPENDING RISES AS WAGES BOOST FAMILY INCOME (Reuters)
“U.S. household spending rose in August as incomes were buoyed by solid wage gains, signs that momentum could be growing in the U.S. economy despite months of harsh government austerity.  American families spent 0.3 percent more last month than the month before…Commerce Department data showed on Friday…"The pick-up in income growth in August suggests that consumption growth may even accelerate in the fourth quarter," said Paul Ashworth, an economist at Capital Economics in Toronto.” Story at…
http://www.reuters.com/article/2013/09/27/us-usa-economy-idUSBRE98M0KO20130927?feedType=RSS&feedName=businessNews

MARKET REPORT
Friday, the S&P finished down 0.41% to 1,692 (rounded) at the close.
VIX was up 10% to 15.46.

MARKET INTERNALS (NYSE DATA)
The 10-day moving average of stocks advancing on the NYSE fell to 53% Friday from 56% at the close Thursday.  (A number above 50% for the 10-day average is generally good news for the market.) 

New-highs outpaced new-lows Friday, leaving the spread (new-hi minus new-low) at +45 (it was +92 Thursday).  The 10-day moving average of change in the spread is plus 1. That just means that over the last 10-days, the spread has improved, but not much.

Market Internals are Positive on the market for this short term indicator.

NTSM
Friday, the overall long-term NTSM analysis remains HOLD at the close.

The 5-day, percent-bulls (bulls/(bulls+bears) in the Guggenheim/Rydex funds I track is 67%-bulls as of Thursday’s close. (Friday’s values won’t be available until late tonight.)  That is an extreme bullish value that is usually a negative for the markets.

Most of the CNBC crowd are bullish on the markets and suggest buying the dip.  I’ll try to keep an eye out for clues that might show the market has made a meaningful bottom.  The S&P 500 is less than 1% above its 50-dMA and that has been a location when buyers have stepped in previously.  The index is 6% above its 200-dMA and, barring panic, is another area when buyers may step in. 
 
Perhaps the S&P 500 will finally see a correction, but not many believe that this is it. 

MY INVESTED POSITION
I remain about 20% invested in stocks as of 5 March (S&P 500 -1540).  The NTSM system sold at 1575 on 16 April.  (This is just another reminder that I should follow the NTSM analysis and not act emotionally – I am under-performing my own system by about 2%!)  I have no problems leaving 20% or 30% invested.  If the market is cut in half (worst case) I’d only lose 10%-15% of my investments.  It also hedges the bet if I am wrong since I will have some invested if the market goes up.  No system is perfect.

Thursday, September 26, 2013

Financial Stocks suggest Stock Market Correction…GDP…Unemployment Claims

CHART TALK - FINANCIALS
The financial sector (measured by the XLF exchange traded fund) has been leading or tracking even with the market over the past 3-months – now it is lagging.  Since the FED QE process buys Bonds from the banks, QE is a gift to the banks.  If the banks can’t perform well in this environment, the overall market may be in for trouble.  

Chart from Yahoo Finance at…
http://finance.yahoo.com/q/bc?s=XLF+Basic+Chart
Annotated by NTSM

The below chart shows that there are other concerns in the Financial Sector XLF ETF.  A triple-top and a developing head-and-shoulders pattern are enough to worry even the most ardent bulls.  If the head-and-shoulders pattern plays out (the XLF will need to fall below the neckline of about 19.4), things may get dicey in a hurry.  That is likely to carry over into the S&P 500 index.  I’ll say it again: if the banks can’t do well in this environment, the overall market may in for trouble.
Chart from Yahoo Finance at…
Annotated by NTSM
 
GDP GROWING AT 2.5% (Bloomberg)
"Gross domestic product rose at a 2.5 percent annualized rate, unrevised from the previous estimate, after expanding 1.1 percent in the first quarter, Commerce Department figures showed today in Washington. The median forecast of economists surveyed by Bloomberg was a 2.6 percent pace….'It’s slow and steady improvement in the economy,' said Gennadiy Goldberg, a strategist at TD Securities USA LLC in New York. 'We haven’t seen enough acceleration in momentum. The Fed wants to see more vigorous growth.'” Story from  Bloomberg at…
 
UNEMPLOYMENT CLAIMS (Briefing.com)
“The initial claims level fell to 305,000 for the week ending September 21 from an upwardly revised 310,000 (from 309,000) for the week ending September 14. 
…The continuing claims level increased to 2.823 mln for the week ending September 14 from an upwardly revised 2.788 mln…
…The computer glitches, which caused biases over the previous two weeks, have been corrected. That means there was real improvement in labor conditions in September.”  Story at…
 
MARKET REPORT
Thursday, the S&P finished up 0.35% to 1699 (rounded) at the close.
VIX was up 0.29% to 14.05 as options players showed some concern about the market.
There was some late day buying today and the broke a 7-day string of late day selling, but overall volume was low.
 
MARKET INTERNALS (NYSE DATA)
Volume was low today.  In the last 2-months there have been only about 4-days that had lower volume on the NYSE, so while today was up, there wasn’t a lot of enthusiasm.
The 10-day moving average of stocks advancing on the NYSE climbed to 56% Thursday from 53% at the close Wednesday.  (A number above 50% for the 10-day average is generally good news for the market.) 
New-highs outpaced new-lows today, Thursday, leaving the spread (new-hi minus new-low) at +92 (it was +83 Wednesday).  The 10-day moving average of change in the spread is barely positive at plus 2. That just means that over the last 10-days, the spread has improved, but just barely.
 
Market Internals are Positive on the market for this short term indicator.
 
NTSM
Thursday, the overall long-term NTSM analysis remains HOLD at the close.
 
MY INVESTED POSITION
I remain about 20% invested in stocks as of 5 March (S&P 500 -1540).  The NTSM system sold at 1575 on 16 April.  (This is just another reminder that I should follow the NTSM analysis and not act emotionally – I am under-performing my own system by about 2%!)  I have no problems leaving 20% or 30% invested.  If the market is cut in half (worst case) I’d only lose 10%-15% of my investments.  It also hedges the bet if I am wrong since I will have some invested if the market goes up.  No system is perfect.

Wednesday, September 25, 2013

Threat of U.S. Default? Forgetaboudit Taper? Forgetaboudit

Analysis: Washington to Wall Street - Threat of default is real (Reuters) 
“Money lenders trust America so implicitly that they generally dismiss the risk it won't pay its debts. But in the U.S. capital, fears are growing that political dysfunction might trigger the unthinkable.”  Story at…
http://www.reuters.com/article/2013/09/24/us-usa-fiscal-debt-analysis-idUSBRE98N17S20130924?feedType=RSS&feedName=businessNews

This just looks like fear-mongering to me.  If our bond payments are a little late…forgetaboudit…the check’s in the mail. 

FED TAPER MORE DISTANT (CNBC)
“Edward Dempsey, chief investment officer of Pension Partners, said despite intense speculation over when the tapering will happen, in his view it could get pushed out for some time. ‘There's a school of thought that thinks maybe never,’ said Dempsey, referring to the potential onset of tapering.  ‘The Fed stared into the deflationary abyss and backed away. They are lowering their growth forecasts, they are telling us that economic growth going forward is weaker than they previously thought,’ he added.”  Story at…
http://www.cnbc.com/id/101060437

I saw several similar stories with logic as follows:  The Fed won’t taper in October because the data won’t be materially different than September. Bernanke doesn’t want to Taper and tie the next FED chair’s hand so forget December. They won’t taper in the first meeting after Yellen (the presumptive choice for the new Fed chair)  takes over either.  Yellen is a QE supporter. So, Taper is way off. 

BANK OF AMERICA LEHMAN WARNS S&P VULNERABLE TO DEEPER CORRECTION (ON A CLOSE BELOW 1700) (Zero Hedge)
“…a close below 1700 (on the S&P 500) would confirm a near-term top and a correction to 1653…  Story from Zero Hedge at…
http://www.zerohedge.com/news/2013-09-24/bofaml-warns-sp-500-vulnerable-deeper-correction-close-below-1700

CHART TALK
I am not really much of a chart guy, but there are times when some basic chart analysis is worthwhile.

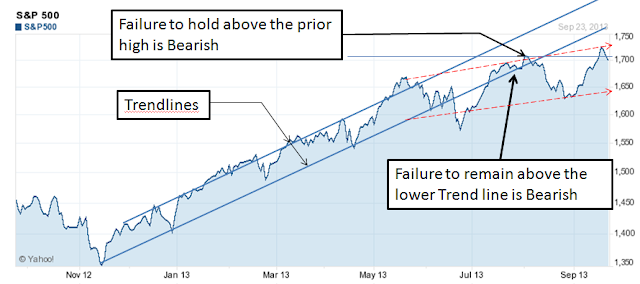
The Index is now trading below its long-term lower trend line and that is bearish, especially after breaking back above the trend line in August.  The shorter term trend line is shown with red dashed-lines and it is much flatter than the previous trend so the upward movement has slowed appreciably.

The index has also breached the 1700 level and per the Bank of America article above, that is bearish too.

Chart from Yahoo Finance at…
http://finance.yahoo.com/q/bc?s=%5EGSPC+Basic+Chart
Annotated by NTSM

MARKET REPORT
Wednesday, the S&P finished down 0.27% to 1693 (rounded) at the close.
VIX fell 0.5% to 14.01.

MARKET INTERNALS (NYSE DATA)
The 10-day moving average of stocks advancing on the NYSE dropped from 54% to 53% at the close.  (A number above 50% for the 10-day average is generally good news for the market.) 

New-highs outpaced new-lows today, Wednesday, leaving the spread (new-hi minus new-low) at +83 (it was +112 Tuesday), but the 10-day moving average of change in the spread is still negative at minus 3. 

Similar to yesterday, I expect tomorrow to be an up-day.  51% of stocks advanced Wednesday at the close today and new-hi/new-low data was also positive on the day even though the index was down.  This is the 2nd day for this unusual occurrence.  The internals may carryover till tomorrow and push the S&P 500 up for the day.

Market Internals are positive on the market for this short term indicator.

LAST HOUR OF TRADING
The last hour of trading is when the Pros play and, in theory, that’s the smart money. In the last 10-days the S&P 500 index is up 0.23%.  Over the last 10-days the index has fallen 1.1% in the last hour of trading.  That divergence between the market and the pro’s opinion of the market may be a negative, but I still haven’t figured out if this is a valid indicator.

NTSM
Wednesday, the overall long-term NTSM analysis remains HOLD at the close.

My sentiment indicator (5-dMA of %-bulls in selected Guggenheim/Rydex funds) hit 67% Wednesday at the close.  That’s a very high number and usually indicates trouble for the market.  With the FED still conducting full-on QE, it is hard to know if the indicator means anything.

MY INVESTED POSITION
I remain about 20% invested in stocks as of 5 March (S&P 500 -1540).  The NTSM system sold at 1575 on 16 April.  (This is just another reminder that I should follow the NTSM analysis and not act emotionally – I am under-performing my own system by about 2%!)  I have no problems leaving 20% or 30% invested.  If the market is cut in half (worst case) I’d only lose 10%-15% of my investments.  It also hedges the bet if I am wrong since I will have some invested if the market goes up.  No system is perfect.
Tuesday, September 24, 2013

Consumer Confidence

CONSUMER CONFIDENCE (dShort.com)
“The Latest Conference Board Consumer Confidence Index was released this morning [Tuesday]…The 79.7 reading is slightly below the 79.9 forecast by Investing.com.  The index is now 2.5 points off its five-and-a-half year interim high set in June. Or, to put it another way, the index is 10.9 points below the December 2007 pre-recession level.”   Good discussion and analysis from Advisor Perspectives at…
http://advisorperspectives.com/dshort/updates/Conference-Board-Consumer-Confidence-Index.php

STOCKS ABOUT TO PLUNGE – WELLS FARGO SRATEGIST (MSN Money, Friday 20 Sep 2013)
“…on Thursday's "Futures Now," Adams reiterated her call that the index [S&P 500] would close out the year at 1,440.  "Our target is based on fundamentals, "Adams insisted. "We're basing our target on typical valuation measures, given the level of interest rates and also on earnings forecasts. And that's why our target is relatively low."
… "simply the fact that we moved from 1.6 [percent] on the 10-year Treasury rate to now the 2.7 [percent] range is a potential tremendous shock over the next six months," Adams contended…Couple the rise in rates with slow earnings growth, and Adams believes the market is in for a very tricky fall. "We're going to have to face the music come October," she said.”  Story at…
http://money.msn.com/top-stocks/post--stocks-about-to-plunge-wells-fargo-strategist-warns

US STOCKS AT RISK - GOVERNMENT SHUTDOWN LOOMING (Bloomberg)
“Hardening positions on the federal budget and borrowing limit, and recent political setbacks suffered by both PresidentBarack Obama and Republican congressional leaders as they go into the fight, are raising the odds of a government shutdown, debt default or near-miss that could roil equities markets.  ‘We are in for another ugly confrontation,’ said Howard Ward, the chief investment officer for growth equity at Rye, New York-based Gamco Investors Inc., which oversees about $40 billion. ‘Even though everyone knows the impasse will be short-lived, it is a sad reminder of how dysfunctional Washington has become. It will be a catalyst for taking profits after the recent run-up.’”  Story from Bloomberg at…
http://www.bloomberg.com/news/2013-09-23/stocks-at-risk-with-government-shutdown-looming-before-a-default.html

Having gone through this negotiation not long ago, I don’t see the markets getting too concerned over the Political maneuvering although the jaw-boning will be tiresome.

MARKET REPORT
Tuesday, the S&P finished down 0.26% to 1697 (rounded) at the close.
VIX fell 1.6% to 14.08.

Bank of America had a report out that if the S&P 500 closed below 1700, expect more trouble.  I’ll post it tomorrow if possible.

MARKET INTERNALS (NYSE DATA)
The 10-day moving average of stocks advancing on the NYSE remained 54% at the close.  (A number above 50% for the 10-day average is generally good news for the market.) 

New-highs outpaced new-lows today, Tuesday, leaving the spread (new-hi minus new-low) at +112 (it was +44 Monday), but the 10-day moving average of change in the spread is still negative at minus 6. 

I expect tomorrow to be an up-day.  55% of stocks advanced Tuesday at the close and new-hi/new-low data was also positive on the day even though the index was down.  The internals may carryover till tomorrow and push the S&P 500 up for the day.

10-day averages aren’t as clear cut for the Market Internals, so the Internals are neutral on the market overall for this short term indicator.

NTSM
Tuesday, the overall long-term NTSM analysis remains HOLD at the close.

MY INVESTED POSITION
I remain about 20% invested in stocks as of 5 March (S&P 500 -1540).  The NTSM system sold at 1575 on 16 April.  (This is just another reminder that I should follow the NTSM analysis and not act emotionally – I am under-performing my own system by about 2%!)  I have no problems leaving 20% or 30% invested.  If the market is cut in half (worst case) I’d only lose 10%-15% of my investments.  It also hedges the bet if I am wrong since I will have some invested if the market goes up.  No system is perfect.

Monday, September 23, 2013

Corporate Profits Suggest Problems for the Stock Market

We have seen from a number of analysts that US profits are at all-time highs (Hussman, et al.).  

EXPECT CORPORATE PROFITS TO FALL 5-15% ANNUALLY (Hussman Funds)
“From the standpoint of long term stock market returns, the most important feature of valuations to note at present is the extreme level of profit margins, which are more than 70% higher than historical norms. This is well-explained by the fact that the deficits of one sector must, in equilibrium, emerge as the surplus of another sector…Though the actual course of corporate profits will be affected by numerous factors, including the extent to which extraordinary fiscal deficits normalize, we would expect corporate profits over the coming 3-4 year period to contract at a rate of somewhere between 5-15% annually.” – John Hussman, PhD, Weekly market Comment for 23 September 2013. Commentary at…
http://www.hussmanfunds.com/

We also have more companies suggesting that forward profits are expected to fall.  (See latest FACTSET Earnings Insight, excerpted below.).

FACTSET EARNINGS INSIGHT, September 20, 2013 (Factset)
“At this point in time, 107 companies in the index have issued EPS guidance for the third quarter. Of these 107 companies, 88 have issued negative EPS guidance and 19 have issued positive EPS guidance. As a result, 82% (88 out of 107) of the companies that have issued EPS guidance for the third quarter have issued negative EPS guidance. This percentage is consistent with the percentage recorded in the previous quarter at this time (81%), but well above the 5-year average of 62%.”  Excerpted from the FACSET Earnings Insight report for 20 Sep 2013. 

Now the market is considering whether the FED continuation of QE is good news or Bad news

FED’S MESSAGE A BAD SIGNAL FOR U.S. PROFIT GROWTH (Reuters)
“The euphoria with which investors in the U.S. stock market greeted the Federal Reserve's decision to stick with its easy-money policy has begun to evaporate, as the message the Fed was sending about a less-than-stellar economy sinks in.  An economy still in need of a safety net may be too weak to produce robust earnings growth, meaning that the Standard & Poor's 500 valuation, now at its most expensive on a price-to-earnings basis since 2010, becomes harder to justify.”  Story at…
http://www.reuters.com/article/2013/09/23/us-usa-earnings-fed-analysis-idUSBRE98M04S20130923

My guess is that smart-money agrees with the above Reuters piece: it is bad-news, for the short term anyway.  That guess is based on two issues: (1) late-day-selling that has been down over the last 5,10, and 40-day periods; (2) the high volume on the down Friday.  The market didn’t change all that much for the huge amount of shares traded.  Friday looked like the smart-money sold the “bag” and now the new buyers are left holding it.  I still think the market needs to re-test 1573 or may trade down to the 200-day moving average, now at 1584. The wild card is the FED. Can the FED keep the markets propped up if earnings do deteriorate as predicted?  I doubt it.

I remain in the minority with that opinion.

Here’s the opposing comment from a trader board: “Since nothing has changed QE wise, I'm thinking the same pattern of buy the dip is in full effect.  Those dips have not been allowed to happen more than 3 to 5 day in a row…”  Apparently that opinion is wide spread; my sentiment indicator was 65% bulls at Friday’s close based on dollars bet long or short in selected Guggenheim/Rydex funds.

MARKET REPORT
Monday, the S&P finished down 0.47% to 1702 (rounded) at the close.
VIX rose 9% to 14.31 so the options boys woke up.

MARKET INTERNALS (NYSE DATA)
The 10-day moving average of stocks advancing on the NYSE fell from 58% to 54% at the close.  (A number above 50% for the 10-day average is generally good news for the market.) 

New-highs outpaced new-lows today, Monday, leaving the spread (new-hi minus new-low) at +44 (it was +129 Friday), but the 10-day moving average of change in the spread is now minus 85. 

The Internals are neutral to negative on the market in the short term.

NTSM
Monday, the overall long-term NTSM analysis remains HOLD at the close.

MY INVESTED POSITION
I remain about 20% invested in stocks as of 5 March (S&P 500 -1540).  The NTSM system sold at 1575 on 16 April.  (This is just another reminder that I should follow the NTSM analysis and not act emotionally – I am under-performing my own system by about 2%!)  I have no problems leaving 20% or 30% invested.  If the market is cut in half (worst case) I’d only lose 10%-15% of my investments.  It also hedges the bet if I am wrong since I will have some invested if the market goes up.  No system is perfect.

Friday, September 20, 2013

Taper at October FED Meeting (Trick-or-Treat?)

It used to be that all Fed governors spoke with one voice using official talking points.  Leading up to the latest meeting, the Fed Governors gave speeches that sent mixed messages.  The Bernanke claim that signals were “misread” by the market seems disingenuous.  Well here we go again. Below, we have Bullard’s comments that suggest taper in October. 

BULLARD SAYS TAPER POSSIBLE [IN OCTOBER] AFTER CLOSE QE CALL (Bloomberg)
“Federal Reserve Bank of St. Louis President James Bullard, a voter on policy this year who has backed record stimulus, said a small tapering of bond buying is possible next month after the Fed made a close call this week in deciding not to slow purchases.  “That was a borderline decision” after “weaker data came in,” Bullard said today on Bloomberg Television’s “Bloomberg Surveillance” with Tom Keene and Sara Eisen. “The committee came down on the side of, ‘Let’s wait.’”  Story at…
http://www.bloomberg.com/news/2013-09-20/bullard-says-weaker-data-prompted-borderline-fomc-taper-delay.html

Here’s another example from another FED voice.

THE LONE FED DISSENTER BLASTS FED DECISION (Business Insider)
“Kansas City Federal Reserve President Esther George was the only FOMC member against the central bank's Wednesday decision to not taper its asset purchase program known as quantitative easing.  In a speech this afternoon, George blasted the decision, saying it "created confusion, created a disconnect," according to Bloomberg...George said that reducing QE would have allowed markets to adjust gradually….But by hinting at a taper and then walking it back unexpectedly, the Fed's credibility is at risk, according to George.”
http://www.businessinsider.com/fed-president-george-blasts-no-taper-2013-9

A “Put” option limits downside risk, so that’s what Steen Jakobsen is referring to in the “Morning After” piece below that was posted (originally) the day after the FED non-taper.

THE MORNING AFTER [THE NON-TAPER] (Global Economic Advisors)
“…we now effectively have not only a put on the stock market, but also a put on the bond market. The whole financial market is now “government controlled…I have no doubt inflation, or lack of, played bigger role than anything else in taking decision to not taper… Fed also de facto yesterday stated: the unemployment rate is invalid to use as gauge for future monetary policy but also as statistical indicator.” - Steen Jakobsen, Chief economist at Saxo Bank in Denmark
…Some people prefer short-term stability even when the outcome is long-term disaster.  – Mish Shedlock
Mish’s full blog on the FED, Inflation, market manipulation and more is located at…

http://globaleconomicanalysis.blogspot.com/

FED ECONOMIC PROJECTIONS (Advisor Perspectives)
“Each quarter the Fed releases their assessment of the economy along with their forward looking projections for three years into the futureThe problem has, and continues to be, that their track record for forecasting has been left wanting….
The FOMC lives in a fantasy world. The economy is not improving materially and deflationary pressures are rising as the bulk of the globe is in recession or worse. The problem is that the current proposed policy is an exercise in wishful thinking. While the Fed blames fiscal policy out of Washington; the reality is that monetary policy does not work in reducing real unemployment or interest rates. However, what monetary policy does do is promote asset bubbles that are dangerous; particularly when they are concentrated in riskiest of assets from stocks to junk bonds”. - Lance Roberts of Streettalk Live, September 19, 2013. Posted at dShort.com at…
http://advisorperspectives.com/dshort/guest/Lance-Roberts-130919-Fed-Projections.php

It is hard to know if Lance is right when he says, “the economy is not improving,” because it seems like the economy has been improving.  Unfortunately, it has improved so slowly that any turn down may hardly be visible.  One area that is visible is corporate profits and forward-guidance from compainies in the S&P 500 is not good (see FACTSET piece, below.) By that measure, Lance IS right.   

EXCERPT FROM “FACTSET EARNINGS INSIGHT” (Factset – 13 Sep 2013)
“At this point in time, 106 companies in the [S&P 500] index have issued EPS guidance for the third quarter. Of these 106 companies, 88 have issued negative EPS guidance and 18 have issued positive EPS guidance.  As a result, 83% (88 out of 106) of the companies that have issued EPS guidance for the third quarter have issued negative EPS guidance. This percentage is consistent with the percentage recorded in the previous quarter at this time (80%), but well above the 5-year average of 62%.”
http://www.factset.com/websitefiles/PDFs/earningsinsight/earningsinsight_9.13.13

In the end – the stock market is all about earnings.

MARKET REPORT
Friday, the S&P finished down 0.7% to 1710 (rounded) at the close.
VIX rose 1% to 13.32.

MARKET INTERNALS (NYSE DATA)
Volume on the NYSE was over twice normal with “normal” defined as the monthly average.  I don’t think panic is the right word, but clearly a lot of investors wanted out today.  It’s been about 3-months since the volume on the NYSE was that high.

The 10-day moving average of stocks advancing on the NYSE was 58% at the close.  (A number above 50% for the 10-day average is generally good news for the market.) 

New-highs outpaced new-lows today, Friday, leaving the spread (new-hi minus new-low) at +129 (it was +313 Thursday), with the 10-day moving average of change in spread still barely positive. 

The Internals are positive on the market in the short term, but may be rolling over.

NTSM
Friday, the overall long-term NTSM analysis remains HOLD at the close.
All indicators are now neutral.

MY INVESTED POSITION
I remain about 20% invested in stocks as of 5 March (S&P 500 -1540).  The NTSM system sold at 1575 on 16 April.  (This is just another reminder that I should follow the NTSM analysis and not act emotionally – I am under-performing my own system by about 2%!)  I have no problems leaving 20% or 30% invested.  If the market is cut in half (worst case) I’d only lose 10%-15% of my investments.  It also hedges the bet if I am wrong since I will have some invested if the market goes up.  No system is perfect.

Thursday, September 19, 2013

Junk Bonds Suggesting a Major Top…Jobless Claims

JUNK BONDS SUGGESTING A MAJOR TOP IN 2013 OR Q1-2014 (NTSM)
Chart from Yahoo Finance at
 http://finance.yahoo.com/q/bct=my&s=PRHYX&l=on&z=l&q=l&c=null&ql=1&c=%5EGSPC

High Yield Bonds tend to act like stocks since they are sensitive to economic conditions.  Junk bonds fall as the default risk of issuers increases.  While they are not immune to interest rate hikes (that lower bond prices), they are considerably less sensitive to interest rate fluctuations than most bonds.

So if junk bonds act like stocks, what can we glean from the above chart that shows the performance of the TR Price High Yield Fund (in blue) vs. the S&P 500 (in green)?  First, in 2007 the stock market peaked when the S&P 500 outperformed junk-bonds by about 55%.  We find similar results looking at charts from the dot-com crash.  At the top in September of 2000, the S&P 500 outperformed junk bonds by about 75% before the S&P 500 collapsed. 

Currently, the S&P 500 is outperforming junk-bonds by about 70%. 

A second point has to do with duration of recovery and we only need to look at the plot of the S&P 500.  The time from the low after the dot-com bust (September 2002) to the high before the financial crisis was 5-years.  Projecting forward from the last major low in March 2009 would put the next top in March 2014. (Historically, the duration of bull-rallies in secular bear markets has only been 26-months on average from 1907 to 2007, but they didn’t have an activist FED in the “old” days.  For Market History see the NTSM blog at...

Junk bonds and stock market history are suggesting a major top…possibly within the next several months.  What is currently missing is a catalyst for the downturn.

JOBLESS CLAIMS UP LESS THAN FORECAST (Bloomberg)
“Applications for unemployment benefits climbed by 15,000 to 309,000 in the week ended Sept. 14 from a revised 294,000 in the prior period, a Labor Department report showed today in Washington. The median forecast of 53 economists surveyed by Bloomberg called for an increase to 330,000…“The labor market is genuinely improving,” said Brian Jones, senior U.S. economist at Societe Generale in New York. “Even if they’re working through the backlog, these numbers seem to have a little bit more behind them than just processing problems.’”  Full story at…
http://www.bloomberg.com/news/2013-09-19/jobless-claims-in-u-s-increased-less-than-forecast-last-week.html

There were issues again with the reporting of the claims data so the numbers are somewhat suspect.
 
NO FED TAPER MEANS SIX MORE WEEKS OF SUMMER (Business Week)
“The Federal Open Market Committee defied widespread forecasts that it would announce the beginning of a cutback in its $85 billion-a-month purchases of Treasury and mortgage bonds. The reasons: The economy is still too weak, and inflation remains below the Fed’s target….The only dissent came from Esther George, president of the Federal Reserve Bank of Kansas City, who “was concerned that the continued high level of monetary accommodation increased the risks of future economic and financial imbalances and, over time, could cause an increase in long-term inflation expectations”…The next chance the FOMC will have to cut back bond-buying comes on Oct. 29, the start of its next two-day meeting.” Story at…
http://www.businessweek.com/articles/2013-09-18/no-fed-taper-means-six-more-weeks-of-summer

MARKET REPORT
Thursday, the S&P finished down 0.2% to 1722 (rounded) at the close.
VIX fell 3% to 13.16.

MARKET INTERNALS (NYSE DATA)
The 10-day moving average of stocks advancing on the NYSE was 61% at the close.  (A number above 50% for the 10-day average is generally good news for the market.)  

New-highs outpaced new-lows today, Thursday, leaving the spread (new-hi minus new-low) at +313 (it was +288 Wednesday), with the 10-day moving average of change in spread positive. 

The Internals are positive on the market in the short term.

NTSM
Thursday, the overall long-term NTSM analysis remains HOLD at the close, but indicators improved and may actually turn positive on the market.  The last BUY in my NTSM system was on 1 Feb 2013. (That has to be a record for the longest period without a BUY signal.)

Volume is positive on the market while other indicators are neutral.

MY INVESTED POSITION
I remain about 20% invested in stocks as of 5 March (S&P 500 -1540).  The NTSM system sold at 1575 on 16 April.  (This is just another reminder that I should follow the NTSM analysis and not act emotionally – I am under-performing my own system by about 2%!)  I have no problems leaving 20% or 30% invested.  If the market is cut in half (worst case) I’d only lose 10%-15% of my investments.  It also hedges the bet if I am wrong since I will have some invested if the market goes up.  No system is perfect.

Wednesday, September 18, 2013

NO TAPER! FED Continues QE at 85-billion per month

No taper? Shock and awe…Bob Pisani of CNBC was nearly speechless. “I’m completely flabbergasted,” he said.

US STOCKS RISE AS FED REFRAINS FROM REDUCING STIMULUS(Bloomberg)
“The Standard & Poor’s 500 Index climbed to a record high after the Federal Reserve unexpectedly refrained from reducing the $85 billion pace of monthly bond buying, saying it needs to see more evidence of improvement in the economy…The Committee decided to await more evidence that progress will be sustained before adjusting the pace of its purchases,” the Federal Open Market Committee said today at the conclusion of a two-day meeting in Washington. While “downside risks” to the outlook have diminished, “the tightening of financial conditions observed in recent months, if sustained, could slow the pace of improvement.” Story at…
http://www.bloomberg.com/news/2013-09-18/u-s-stock-index-futures-are-little-changed-before-fed.html

FOMC SHOCKER: NO TAPER (ZeroHedge)
“FED refrains from QE taper, keeps monthly buying at $85-billion
FED: Rise in mortgage rates, fiscal policy restrain growth
FED: Tightening of financial conditions could slow growth
Most FED officials see first interest rate rise in 2015.”
Story at…
http://www.zerohedge.com/news/2013-09-18/fomc-shocker-no-taper

FED REFRAINS FROM QE TAPER (Bloomberg)
“It looks like the Fed has done a major reset in terms of expectations on what they need to see before they start to taper,” said Chris Rupkey, the chief financial economist for Bank of Tokyo-Mitsubishi UFJ Ltd. in New York…Fed officials today reduced their forecasts for economic growth this year and next. They forecast U.S. gross domestic product to increase 2 percent to 2.3 percent this year, down from a June projection of 2.3 percent to 2.6 percent growth.”  Story at…
http://www.bloomberg.com/news/2013-09-18/fed-refrains-from-qe-taper-keeps-bond-buying-at-85-bln.html

US CEOs LESS OPTIMISTIC ABOUT ECONOMY (Reuters)
“U.S. chief executives were less optimistic about the economy in the third quarter, with fewer expecting to increase sales or boost capital spending than in the preceding three months, a survey by the Business Roundtable showed…"While U.S. business performance remains strong, as evidenced by robust recovery in the automotive sector, business leaders still see headwinds preventing a more sustained, robust recovery," said Jim McNerney, chairman of Business Roundtable and chairman and CEO of Boeing Co (BA.N).  CEO expectations for 2013 gross domestic product growth was 2.2 percent, unchanged from the last quarter.”  Story at…
http://www.reuters.com/article/2013/09/18/us-usa-economy-roundtable-idUSBRE98H0IZ20130918

MARKET REPORT
Wednesday, the S&P finished up 1.2% to 1726 (rounded) at the close.
VIX fell 6% to 13.59.

The S&P 500 is now 9% above its 200-dMA.  Even after the taper news today the market may not have too much more upside left.  10% above the 200-dMA has been the trouble zone for the S&P 500, but it may manage to get a couple of percent higher now that QE will continue to solve all problems.

MARKET INTERNALS (NYSE DATA)
The 10-day moving average of stocks advancing on the NYSE was 62% at the close.  (A number above 50% for the 10-day average is generally good news for the market.) 

New-highs outpaced new-lows today, Wednesday, leaving the spread (new-hi minus new-low) at +288 (it was +123 Tuesday), with the 10-day moving average of change in spread strongly positive. 

The Internals are positive on the market in the short term.

NTSM
Wednesday, the overall long-term NTSM analysis remains HOLD at the close. 

With no taper, everyone seems convinced the markets are headed up.  As I noted a few days ago; when everyone thinks the market is going to go one way, it will go the other.  The pros seem conflicted since the last hour of trading has been down over the last 5, 10 and 40-day periods.  The Index was down today in the last hour too.

The market has been up 9 out of the last 10-days so it is overdue for some down time.  Today was a statistically significant up-day based on price and volume.  Statistically significant up-days are usually followed by a down day or several for that matter.  So it looks like the market has some issues and will likely trend down in the short term, but it may need to get a couple percent higher before there is a better chance for a meaningful correction.

MY INVESTED POSITION
I remain about 20% invested in stocks as of 5 March (S&P 500 -1540).  The NTSM system sold at 1575 on 16 April.  (This is just another reminder that I should follow the NTSM analysis and not act emotionally – I am under-performing my own system by about 2%!)  I have no problems leaving 20% or 30% invested.  If the market is cut in half (worst case) I’d only lose 10%-15% of my investments.  It also hedges the bet if I am wrong since I will have some invested if the market goes up.  No system is perfect.