NAVIGATE THE STOCK MARKET FOCUSES ON:
(1) Daily momentum analysis of the DOW 30 stocks and 15 ETFs across various market sectors.
(2) Stock Market commentary and analysis.
(3) Buy/Sell signals for major market turns.
(((The blog is for information only. You assume all risk of its use; we don’t warrant the accuracy of our content. You must do your own due diligence.)))
Pages
▼
Tuesday, November 29, 2022
Consumer Confidence ... Stock Market Analysis ... Best DOW Stocks ... Best ETFs …
“Trade what you see; not what you think.” – The Old Fool,
Richard McCranie, trader extraordinaire. Keep skunks, bankers, and politicians at a distance. –
Hillbilly Wisdom.
Political commentary at... https://michaelpramirez.com/index.html CONSUMER CONFIDENCE (Conference Board) “Consumer confidence declined again in November, most
likely prompted by the recent rise in gas prices,” said Lynn Franco, Senior Director of Economic
Indicators at The Conference Board. “The Present Situation
Index moderated further and continues to suggest the economy has lost momentum
as the year winds down. Consumers’ expectations regarding the short-term
outlook remained gloomy. Indeed, the Expectations Index is below a reading of
80, which suggests the likelihood of a recession remains elevated.” Press
release at... https://www.conference-board.org/topics/consumer-confidence MARKET REPORT / ANALYSIS -Tuesday the S&P 500 slipped about 0.2% to 3958. -VIX dipped about 1% to 20. 50. -The yield on the 10-year Treasury dipped to 3.734%. PULLBACK DATA: -Drop from Top: 17.5% as of today. 25.4% max (on a
closing basis). -Trading Days since Top: 228-days. The S&P 500 is 2.3% Below its 200-dMA & 4.3% above
its 50-dMA. (The last rally failed at the 200-dMA so I am watching this now.) *I won’t call the correction over until the S&P 500
makes a new-high; however, evidence suggests the bottom was in the 3600 area
and I am fully invested with a higher percentage of stocks than normal. MY TRADING POSITIONS: XLI – Industrial ETF (XLI still looks good to me. Nearly
10% of XLI is in Boeing and Caterpillar and they are both strong performers in
the DOW momentum analysis.) QLD – 2x Nas 100 DDM – 2x Dow 30. I may sell DDM and replace it with SSO
(2x S&P 500), but for now, the DOW 30 is still doing better than the
S&P 500. XLK – Technology ETF CVX – (I may hold this as a long-term position. I already
owned a small position in CVX.) TODAY’S COMMENT: It is not surprising to see some profit taking. I’d still
like to see the Nasdaq perform better so we could feel more confident that the
lows are definitely behind us.While I
doubt that a return to the October lows will happen this year, there is always
the concern that we could see selling pick up next year, especially if there
are recession signs. When one considers the economy, it seems to be humming
along pretty well, in spite of headwinds from inflation and the Fed. In fact,
here’s the present GDP estimate from the Atlanta Fed: “The GDPNow model
estimate for real GDP growth (seasonally adjusted annual rate) in the fourth
quarter of 2022 is 4.3
percent on November 23, up from 4.2 percent on November
17.” No sign of recession there! The issue remains: “Will the Fed put the
economy in recession in its inflation fight?” We’ll have to wait and see. I didn’t hear Fed Chairman Powell’s Speech today, but
markets didn’t seem to be upset by it since they recovered in the afternoon. Today, the daily sum of 20 Indicators remained +9 (a
positive number is bullish; negatives are bearish); the 10-day smoothed sum
that smooths the daily fluctuations declined from +148 to +143. (The trend
direction is more important than the actual number for the 10-day value.) These
numbers sometimes change after I post the blog based on data that comes in
late. Most of these 20 indicators are short-term so they tend to bounce around
a lot. LONG-TERM INDICATOR: The Long
Term NTSM indicator remained BUY: VOLUME and SENTIMENT are neutral; VIX, &
PRICE are bullish.(The important Buy
signal from this indicator ensemble was 21 October (7 days after the low); my
first buy indication was on 21 September (2% above the low) based on analysis
of retests of the June low.) Bottom line: I remain a Bull. I think the bottom was 3577
on 12 October. There is always the possibility that the markets could retest
those lows, but it seems less likely that a retest will occur in 2022. I’m now invested with about 75% of the portfolio invested
in stocks. (As a retiree, 50% invested in stocks is my “normal” portfolio.) 75%
stocks is uber-bullish and that’s as far as I’ll go. BEST ETFs - MOMENTUM ANALYSIS: TODAY’S RANKING OF 15 ETFs
(Ranked Daily) ETF ranking follows: The top ranked ETF receives
100%. The rest are then ranked based on their momentum relative to the leading
ETF.
*For additional background on
the ETF ranking system see NTSM Page at… http://navigatethestockmarket.blogspot.com/p/exchange-traded-funds-etf-ranking.html XLE has taken the top position in the ETF momentum index.
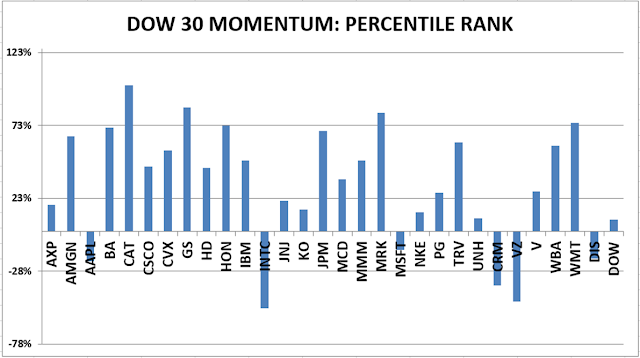
I own CVX so I already have good exposure to energy. BEST DOW STOCKS - TODAY’S MOMENTUM
RANKING OF THE DOW 30 STOCKS (Ranked Daily) DOW 30 momentum ranking
follows: The top ranked Stock receives
100%. The rest are then ranked based on their momentum relative to the leading Stock.
My basket of Market Internals remained HOLD. (Market Internals are a decent trend-following
analysis of current market action, but should not be used alone for short term
trading. They are most useful when they diverge from the Index.)
...My current invested
position is about 75% stocks, including stock mutual funds and ETFs. I’m
usually about 50% invested in stocks. I’ll cut back on stocks if we see serious
bear signs. I trade about 15-20% of the
total portfolio using the momentum-based analysis I provide here. If I can see
a definitive bottom, I’ll add a lot more stocks to the portfolio using an
S&P 500 ETF.