NAVIGATE THE STOCK MARKET FOCUSES ON:
(1) Daily momentum analysis of the DOW 30 stocks and 15 ETFs across various market sectors.
(2) Stock Market commentary and analysis.
(3) Buy/Sell signals for major market turns.
(((The blog is for information only. You assume all risk of its use; we don’t warrant the accuracy of our content. You must do your own due diligence.)))
I was traveling Monday so the post is late. I hope you
got to see the Northern lights over the weekend. Amazing! “Trade what you see; not what you think.” – The Old Fool,
Richard McCranie, trader extraordinaire. “Far
more money has been lost by investors in preparing for corrections, or
anticipating corrections, than has been lost in the corrections themselves.” -
Peter Lynch, former manager of Fidelity’s Magellan® fund.
MARKET REPORT / ANALYSIS -Monday the S&P 500 was little changed at 5221. -VIX rose about 8% to 13.60. -The yield on the 10-year Treasury declined to 4.490%. MY TRADING POSITIONS: UWM – Added 5/2/2024 QLD – Added 4/29/2024 SSO – Added 4/29/2024. XLE – Added 4/24/2024 XLK – Technology ETF (holding since the October 2022
lows). I don’t want to pay taxes on this gain, so I am holding this position. CRM – Added 1/22/2024. DWCPF - Dow Jones U.S. Completion Total Stock Market
Index. – Added 12/7/2023 when I sold the S&P 500. “The Dow Jones U.S. Completion Total Stock Market Index,
also known as the DWCPF, is a widely used financial index that provides a
comprehensive measure of the US equity market. The DWCPF includes all US stocks
that are not included in the Dow Jones US Total Stock Market Index, which
comprises large-cap and mid-cap companies. As a result, the DWCPF provides a
complete picture of the US stock market, including small-cap and micro-cap
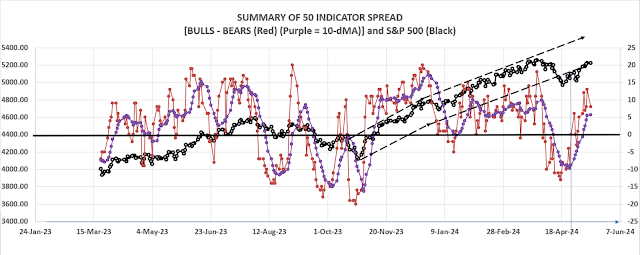
companies, which are often overlooked by other indexes.” From... https://fi.money/blog/posts/what-is-dow-jones-u-s-completion-total-stock-market-index-dwcpf CURRENT SUMMARY OF APPROXIMATELY 50 INDICATORS: The Bull/Bear Spread (Bull Indicators minus Bear
Indicators) remained bullish at 7 Bear-signs and 15-Bull. (The rest are
neutral. It is normal to have a lot of neutral indicators since many of those
are top or bottom indicators that will signal only at extremes.) The 10-dMA of
spread (purple line in the chart below) continues to improve, a bullish sign.
TODAY’S COMMENT: Not much new. Markets started well, but faded to negative
for the day before finishing around unchanged. A so-so day. Internals were bullish,
but not overly so. PPI is due Tuesday at 08:30 and that may have troubled
markets Monday. Just a reminder: I keep hearing the pundits talk about
how fast and far the rally has gone. The markets are due for trouble they say.As of Friday, the S&P 500 was only up
8.8% since January of 2022, more than 2 years ago - Doesn’t look too fast or
far to me. LONG-TERM INDICATOR: The Long Term NTSM indicator
declined to HOLD: PRICE is bullish; VIX, VOLUME & SENTIMENT are neutral. (The Long-Term Indicator is not a good top-indicator. It
can signal BUY at a top.) (The important major BUY in this indicator was on 21
October 2022, 7-days after the bear-market bottom. For my NTSM overall signal,
I suggested that a short-term buying opportunity occurred on 27 September
(based on improved market internals on the retest), although without market
follow-thru, I was unwilling to call a buy; however, I did close shorts and
increased stock holdings. I issued a Buy-Signal on 4 October, 6-days before the
final bottom, based on stronger market action that confirmed the market internals
signal. The NTSM sell-signal was issued 21 December, 9 sessions before the high
of this recent bear market, based on the bearish “Friday Rundown” of
indicators.) BOTTOM LINE I am bullish. The S&P 500 is headed back to all-time,
new highs. ETF - MOMENTUM ANALYSIS: TODAY’S RANKING OF 15 ETFs (Ranked Daily) ETF ranking
follows:
The top ranked ETF receives
100%. The rest are then ranked based on their momentum relative to the leading
ETF. *For additional background on
the ETF ranking system see NTSM Page at… http://navigatethestockmarket.blogspot.com/p/exchange-traded-funds-etf-ranking.html DOW STOCKS - TODAY’S MOMENTUM RANKING
OF THE DOW 30 STOCKS (Ranked Daily) I forgot to update this chart
yesterday, but below is Friday’s chart. DOW 30 momentum ranking follows:
My basket of Market Internals remained BUY. (My basket of Market
Internals is a decent trend-following analysis of current market action, but
should not be used alone for short term trading. They are most useful when they
diverge from the Index.)
...My current invested
position is about 75% stocks, including stock mutual funds and ETFs. I’m
usually about 50% invested in stocks, so this is a bullish, over-invested
position. This is my max % for stock allocation. I trade about 15-20% of the total portfolio using the
momentum-based analysis I provide here. When I see a definitive bottom, I add a
lot more stocks to the portfolio, usually by using an S&P 500 ETF as I did
back in October 22 and 23.