NAVIGATE THE STOCK MARKET FOCUSES ON:
(1) Daily momentum analysis of the DOW 30 stocks and 15 ETFs across various market sectors.
(2) Stock Market commentary and analysis.
(3) Buy/Sell signals for major market turns.
(((The blog is for information only. You assume all risk of its use; we don’t warrant the accuracy of our content. You must do your own due diligence.)))
Pages
▼
Friday, July 26, 2024
PCE Prices ... Personal Income ... Momentum Trading DOW Stocks & ETFs … Stock Market Analysis ...
“Trade what you see; not what you think.” – The Old Fool,
Richard McCranie, trader extraordinaire. “Far
more money has been lost by investors in preparing for corrections, or
anticipating corrections, than has been lost in the corrections themselves.” -
Peter Lynch, former manager of Fidelity’s Magellan® fund. “One minute you're up half a million in soybeans and the
next, boom, your kids don't go to college and they've repossessed your Bentley.
Are you with me?" – Louis Winthorpe, III. PERSONAL INCOME (Calculated Risk) “Personal income increased $50.4 billion (0.2 percent at
a monthly rate) in June...” From... https://www.calculatedriskblog.com/2024/07/personal-income-increased-02-in-june.html PCE PRICES (CNBC) “The personal consumption expenditures price index
increased 0.1% on the month and was up 2.5% from a year ago, in line with Dow
Jones estimates, the Commerce Department reported Friday.” Story at... https://www.cnbc.com/2024/07/26/pce-inflation-june-2024-.html MARKET REPORT / ANALYSIS -Friday the S&P 500 rose about 1.1% to 5459. -VIX fell about 11% to 18.46. -The yield on the 10-year Treasury declined to 4.195%
(compared to this time, prior trading day). MY TRADING POSITIONS: XLK – Holding since the October 2022 lows. XLK – added more 7/26. This reestablishes the position I
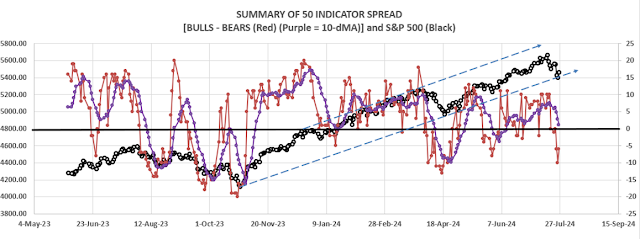
had before this recent weakness. UWM – added 7/15. QLD – added 7/24. CURRENT SUMMARY OF APPROXIMATELY 50 INDICATORS: The Bull/Bear Spread (Bull Indicators minus Bear
Indicators) improved to 13 Bear-signs and 7-Bull. (The rest are neutral. It is
normal to have a lot of neutral indicators since many of those are top or
bottom indicators that will signal only at extremes.)
The Bull/Bear, 50-Indicator spread improved from -10 to -6
(6 more Bear indicators than Bull indicators). TODAY’S COMMENT: The S&P 500 bounced back above its 50-dMA and that
was a good sign. As of yesterday, the S&P 500 declined 4.7% from its all-time
high of 5667. If yesterday was the low, and it appears that it may have been,
that’s about what we expected. The Index dropped exactly to its 50-dMA. I’ll
feel better when the 10-dMA of the 50-indicator spread (purple line in the
chart above) starts moving up. When that happens, I’ll add to stocks. LONG-TERM INDICATOR: The Long Term NTSM indicator improved
to HOLD: VOLUME was bearish; PRICE, VIX, & SENTIMENT are neutral. (The Long-Term Indicator is not a good top-indicator. It
can signal BUY at a top.) (The important major BUY in this indicator was on 21
October 2022, 7-days after the bear-market bottom. For my NTSM overall signal,
I suggested that a short-term buying opportunity occurred on 27 September
(based on improved market internals on the retest), although without market
follow-thru, I was unwilling to call a buy; however, I did close shorts and
increased stock holdings. I issued a Buy-Signal on 4 October, 6-days before the
final bottom, based on stronger market action that confirmed the market
internals signal. The NTSM sell-signal was issued 21 December, 9 sessions
before the high of this recent bear market, based on the bearish “Summary of 50”
indicator. BOTTOM LINE I am leaning Bullish on the market, but I’ll feel better
when the 10-dMA of indicators moves higher. ETF - MOMENTUM ANALYSIS: TODAY’S RANKING OF 15 ETFs (Ranked Daily) ETF ranking
follows:
The top ranked ETF receives
100%. The rest are then ranked based on their momentum relative to the leading
ETF. *For additional background on
the ETF ranking system see NTSM Page at… http://navigatethestockmarket.blogspot.com/p/exchange-traded-funds-etf-ranking.html DOW STOCKS - TODAY’S MOMENTUM RANKING
OF THE DOW 30 STOCKS (Ranked Daily)
My basket of Market Internals remained HOLD. (My basket of Market
Internals is a decent trend-following analysis of current market action, but
should not be used alone for short term trading. They are most useful when they
diverge from the Index.)
...My current invested
position is about 55% stocks, including stock mutual funds and ETFs. I’m
usually about 50% invested in stocks when markets are stretched; my current
stock position is slightly above the norm. (75% is my max stock allocation when
I am strongly bullish.) I trade about 15-20% of the total portfolio using the
momentum-based analysis I provide here. When I see a definitive bottom, I add a
lot more stocks to the portfolio, usually by using an S&P 500 ETF as I did
back in October 2022 and 2023.