Monday, December 31, 2012

Is Un-employment better than Working?

NO APPLICANTS?
Plenty of Manufacturing Jobs, but Too Few Applicants (CNBC – 28 Dec 2012)
“Bill Black…the executive vice president of Aphelion Precision Technologies has been unable to fill 7 to10 job openings…’I sometimes wake up in the morning and I'm thinking, maybe people just don't want to go to work," said Black. "Maybe it's easier to stay at home and not work. I don't know.’…”

“At Metal Technologies in Bloomfield, Indiana these are boom times. In the last three years business has doubled for the auto parts supplier …
Still, the company with 128 employees has 5 to 7 job openings it can't fill. ‘We get really frustrated when we have a job and we can't get anyone to work it,’ said Randy Lovelace a production manager at Metal Technologies.
http://www.cnbc.com/id/100289795

Here’s a presentation by the Secretary of Public Welfare for Pennsylvania.  He clearly demonstrates problems and solutions in the welfare system.

WELFARE’S FAILURE AND THE SOLUTION - Presentation by Gary D. Alexander
Secretary of Public Welfare Commonwealth of Pennsylvania
“The U.S. welfare system would be an unlikely model for anyone designing a welfare system from scratch. The dozens of programs that make up the ‘system’ have different (sometimes competing) goals, inconsistent rules, and over-lapping groups of beneficiaries.”

The single mom is better off earning gross income of $29,000 (and collecting welfare to total $57,327 in net income & benefits) than to earn gross income of $69,000 (that provides after-tax, net income & benefits of $57,045).
http://www.aei.org/files/2012/07/11/-alexander-presentation_10063532278.pdf

When I first saw a reference to the above story about how it’s better to collect welfare than work, I thought it was by some conservative zealot, but instead, it is a well thought out and legitimate presentation.

My wife and I had related experiences.  While volunteering with the homeless at church, I met a very attractive young woman in her late teens or early twenties.  In casual conversation she seemed intelligent and hardly a “street-person.”  One of my fellow volunteers offered her a job on the spot at his business.  She turned him down – she said, “I don’t need to work.  I get everything I need for free.” {A short term view of life – not recommended for anyone.}

My wife’s story is more personal and tragic.  My wife is a teacher and she has a student who is a talented kid with a lot of potential.  Her father wouldn’t let her work because he would lose benefits if she had a job.  Her father passed away recently forcing the child to move back in with her mother (her father left the mother years ago and got custody of the children).  Now, her drug-addict, alcoholic mother won’t let her work because mom would lose benefits if the child worked.  My wife has been counseling her that she must work (if not now – as soon as she turns 18) to break the cycle of poverty that she has known all her life. 

NAJARIAN COMPLETELY OUT OF EVERYTHING (CNBC)
(an update) “…what would make him jump back in…”
“…Najarian said that worries in the first few weeks of January about extension of the federal debt ceiling would push the stock market lower...I would like to see that same sort of panic that lifts us into the mid-20s for the VIX. I don't want to see that, folks," he said. "I'll get back in because I anticipate that panic."  Full story at…
http://www.cnbc.com/id/100343637

MARKET RECAP
Monday the S&P 500 was up 1.7% to 1426 (rounded).  VIX was DOWN almost 21% to 18.02 in a huge turn-around.

A hint of Cliff resolution and all is well.  As of this morning the Senate was passing a bill to send to the House.  I thought the Constitution required all Appropriations bills to be originated in the House.  Well, they are Politicians – why follow the Constitution?

NYSE Volume on Monday was above normal, non-Holiday volume and that’s really big on a Holiday “tween” day.   I can’t really say what it means.  Buying ahead of cliff-resolution? End of year window dressing?  Blow off top?

MIXED MESSAGES
Market internals are oddly flat - neutral. 

Investors are snapping up cyclical stocks much faster than the S&P 500 so they don’t think there is a recession coming - bullish.

NTSM
The NTSM analysis switched back to HOLD Monday as VIX crashed back to the 18 region - bullish.

Bullish sentiment now is up to 70%-Bulls over a 5-day moving average and on Friday, fully 78% of all bets placed were to the bull side in the Guggenheim funds that I track.  That sort of action is consistent with a Top - very bearish.

I am going to keep following my numbers.  In spite of the coming resolution of the cliff, my “numbers” aren’t all that bullish.

MY INVESTED POSITION
Based on the SELL signal, 7 November 2012, I moved out of the stock market at 1377 on the S&P 500.  Because of the negativity I have noted from Hussman and others, I am currently invested in a range of near 15% invested in stocks. 

Friday, December 28, 2012

Smart Money Selling? NTMS is SELL…again

NAJARIAN COMPLETELY OUT OF EVERYTHING (CNBC)
“With the likelihood that the U.S. will go over the so-called "fiscal cliff," OptionMonster's Jon Najarian said Thursday he has exited all his positions.
‘For the first time in 31 years in the market, I'm completely out of everything,’ he said. "I see no reason to stick with this thing – no reason to get short, either." Full story at…
http://www.cnbc.com/id/100341721

I thought this was a very curious story.  My Sentiment indicator (now at extreme bullish levels) is based on Guggenheim (formerly Rydex) mutual funds so it is not considered “smart money” because mutual funds are not a very sophisticated way to hedge or use options.  Extreme bullish sentiment by “dumb-money” is bearish for the stock market.  When everyone thinks the market is going up – it goes down.

Jon Najarian as the founder of Options Monster would be considered “smart money”.  So the dumb money is betting there will be a big relief rally after a Fiscal Cliff settlement – the smart money (at least one of them) is taking a position of extreme caution.  Actually, there are two of us since I am almost out of everything too.  (Unfortunately, I don’t really consider myself smart money – the real, smart-money people have access to more information and resources.)

I thought this was curious because if Najarian’s attitude becomes widespread amongst the pros, the correction will continue at a more vigorous pace.

I’ve experimented with my own “smart-money” index that tracks market moves in the last hour of trading and that is supposed to be when the smart money moves.  The NTSM Smart Money indicator is trending down, but not at an extreme rate.  I still don’t have much confidence in this experimental indicator – it needs work.

CHART OF THE DAY – (DECLINING) CLAIMS NOT TRANSLATING INTO (INCREASED) JOBS (From dshort advisors re-posted from StreetTalk Live, originally written by Lance Roberts)
"There are roughly 127 million people who receive government transfers or benefits. Sixty-one million recipients of Social Security and Medicare and 66 million people receiving welfare (SNAP food stamps, housing credits, Medicaid, etc.) Since there are about 115 million full-time jobs in the U.S., this means there are 1.1 government dependents for every full-time worker in the U.S.” From the King Report at
http://www.streettalklive.com/off-the-street/1412-king-report-structural-end-game-to-fiscal-cliff.html

“This brings us to the chart of the day which compares initial jobless claims (inverted scale) to full-time employees relative to the population. While the media has spun the idea that current levels of initial jobless claims are supportive of a strengthening economy - the reality is that full-time employment remains stymied near its lowest levels on record. Low levels of full-time employment keeps incomes suppressed, and dependency on government support programs high, which are not supportive to stronger economic growth rates.”


MARKET RECAP
Friday the S&P 500 was down 1.1 % to 1402 (rounded).  VIX was UP almost 17% to  22.72.

The options boys have suddenly gotten very nervous and the VIX has exploded to the upside by increasing nearly 25% over the last 3-days.  VIX is the best indicator in the NTSM system based on back testing to 2006.

The Volume over the last 3-trading days has been about 75% of the pre-Holiday volume; light, but not extremely low.  I’d expect very low volume on Monday unless there are new developments in the Fiscal Cliff negotiations.

NTSM
The NTSM analysis switched back to SELL Friday.

That is based on the huge spike in the VIX over the past 3-days and the continuing extreme bullish sentiment, exceeding 66%-Bulls over a 5-day moving average, in the Guggenheim funds that I track. 

MY INVESTED POSITION
Based on the SELL signal, 7 November 2012, I moved out of the stock market at 1377 on the S&P 500.  Because of the negativity I have noted from Hussman and others, I am currently invested in a range of near 15% invested in stocks. 
Thursday, December 27, 2012

Markets in Wait Mode

JAPAN – MAD, MAD, WORLD (from Mish’s Global Economic Trend Analysis)
“The Keynesian and Monetarist clowns in Japan are going all out in Japan with pledges to ignore debt caps and implement "bold monetary policy"…Japan's crisis is not deflation as the economic illiterates suggest. Rather, Japan's problem is a debt-to-GDP ratio of 230%, caused by economic illiterates attempting to defeat deflation….It's a mad, mad world with monetarist fools in complete control of the Fed, the Bank of England, and the ECB.”
Read more at http://globaleconomicanalysis.blogspot.com/#KCyC7dCluEL71g48.99

The WSJ reported that Japan is concerned that they must weaken their currency to make their trade position better vs. the US and others.  Let the monetary wars begin!

The next clip is a little extreme; the scary part is that it is from a Canadian Member of Parliament – not an American wacko.

A CANADIAN SUMMARIZES AMERICA’S COLLAPSE: “EVERYONE TAKES, NOBODY MAKES, MONEY IS FREE, AND MONEY IS WORTHLESS” - Canadian MP Pierre Poilievre (ZeroHedge)
"…through debt interest alone, soon the US taxpayer will be funding 100% of the Chinese Military complex." – ZeroHedge at…
http://www.zerohedge.com/news/2012-12-26/canadian-summarizes-americas-collapse-everyone-takes-nobody-makes-money-free-and-mon

US TO HIT THE 16.4 TRILLION DEBT LIMIT ON NEW YEAR’S EVE – GEITHNER (The Hill)
“The United States will reach its $16.4 trillion borrowing limit on Dec. 31 and undertake “extraordinary measures” to avoid default, the Treasury Department informed congressional leaders in a letter on Wednesday.”
http://thehill.com/blogs/on-the-money/economy/274591-us-to-hit-164t-debt-limit-on-dec-31

Great!!! So…if we get past the Fiscal Cliff, prepare for a couple more months of Political and Financial drama courtesy of the people we elected to run the country - coming to a financial TV network near you, “Attack of the Giant debt Limit”.    

MARKET RECAP
Thursday the S&P 500 was down 0.1% to 1418 (rounded).  VIX was down about 1% to 19.31.

Markets had been down about 1/2% earlier in the day, but reports that the House would be in session on Sunday fueled a rally on the hope that the Fiscal Cliff might be avoided.  It will be avoided – but I think they will simply buy more time by delaying the Cliff so they can continue negotiations.  We’ll see…

NTSM
The NTSM analysis remained HOLD Thursday.  Sentiment remains the only negative indicator.

I had to all the way back to August of 2009 to find a more bullish reading than the value of 68%-bulls my sentiment indicator hit today.  At that time, the market was coming off its 2009 bottom and the correct call was to be long.  An overly bullish reading is not always wrong, nor does it always suggest market declines, however; since we now are closer to a top than a bottom, I think the current overly Bullish reading is NOT GOOD.

MY INVESTED POSITION
Based on the SELL signal, 7 November 2012, I moved out of the stock market at 1377 on the S&P 500.  Because of the negativity I have noted from Hussman and others, I am currently invested in a range of near 15% invested in stocks. 

Wednesday, December 26, 2012

Falling Revenues

FALLING REVENUES
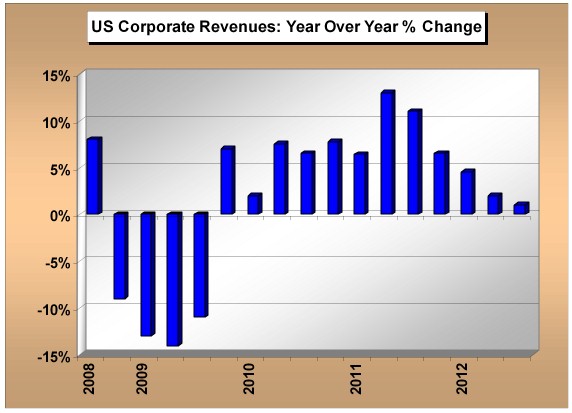
The stock market is all about earnings, or more specifically, earnings growth.  If earnings are growing, stock prices are usually rising.  Rising earnings go hand in hand with rising revenues.  Companies need to bring in more dollars each quarter to improve the earnings.  If revenues are falling, companies can make up for that by reducing costs or increasing productivity, but cost reduction can only go so far.  Here’s what Contrary Investor had to say about Revenues (Contrary Investor.com):

“3Q saw the smallest year over year gain in US corporate revenues since 2009. Moreover, the ongoing trend in slowing year over year revenue growth is unmistakable over the last five quarters.”

“Looking beyond the US Fiscal Cliff issues specifically, it’s clear that global economic slowing is negatively impacting US goods exports, one of the two key legs of the economic stool in the current recovery. Additionally, the ability of the US Federal government to continue to take on debt is more of a question mark than has been the case in recent years. Both of these issues have direct bearing on the forward character of US corporate earnings. Is this what is really causing angst among the equity investment community as of late as opposed to the already more than well-known Fiscal Cliff issues?…Now is the time to look over the Cliff and assess the forward rhythm and tenor of the global economy, as well as how that rhythm will either positively or negatively impact the US corporate revenue and earnings growth outlook for the next two to three quarters.”  From Contrary Investor.com at…
http://www.contraryinvestor.com/mo.htm

ATA TRUCK TONNAGE
The ATA Truck tonnage Index, as reported by the American Trucking Association, rebounded from a 3.8% drop in October to post a seasonally adjusted 3.7% gain in November.  That’s the first positive month since July.  ATA said, “Year-to-date, compared with the same period last year, tonnage was up 2.8%.” From their website: “Trucking serves as a barometer of the U.S. economy, representing 67% of tonnage carried by all modes of domestic freight transportation…  My cmt: I think this data supports a slightly growing economy, though one-month’s increase (remember August thru October were down) may not indicate we are out of the woods yet.   From ATA at…

RETAIL SALES DOWN (coloradoan.com)
“Holiday retail sales this year were the weakest since 2008, when the nation was in a deep recession. In 2012, the shopping season was disrupted by bad weather and consumers’ rising uncertainty about the economy… In the end, even steep last-minute discounts weren’t enough to get people into stores, said Marshal Cohen, chief research analyst at the market research firm NPD Inc.”  Full story at…
http://www.coloradoan.com/viewart/20121225/BUSINESS/312260006/Holiday-Retail-sales-weakest-since-2008

SENTIMENT
As of Monday’s close, sentiment is 66%-bulls so now it’s official: 2 out of every 3 investors are betting the markets will rise. (My sentiment indicator tracks the assets invested in selected bull and bear mutual funds in the Guggenheim Investment Family, formerly Rydex Funds.)  This is negative for the markets.  Too much bullish sentiment is not a good thing.  Furthermore, sentiment usually peaks after the stock market has topped as investors move in to buy-the-dip.  Could sentiment be right?  Is now the time to be more optimistic than at any other time since last May? - Maybe, but not likely.

MARKET RECAP
Wednesday the S&P 500 was down 0.5% to 1420 (rounded).  VIX rose 9% to 19.48. 

NTSM
The NTSM analysis remained HOLD Wednesday.  Sentiment is the only negative indicator.

MY INVESTED POSITION
Based on the SELL signal, 7 November 2012, I moved out of the stock market at 1377 on the S&P 500.  Because of the negativity I have noted from Hussman and others, I am currently invested in a range of near 15% invested in stocks. 

Monday, December 24, 2012

Fiscal Cliff - What does Wall Street Really Think?

FISCAL CLIFF – FROM WALL STREET
I have commented a couple of times that I have seen comments (mainly on the web) that the Republicans were simply waiting for the New Year so they could vote for a tax decrease instead of an increase.

Here’s a comment by a Wall Street pro, Charles Lahr, Managing Director and global equity portfolio manager for Pacific Investment Management Company (from WSJ, print edition, 22 Dec 2012): “If we go over the fiscal cliff, tax rates will go up on everyone, and someone will quickly come up with a bill to cut taxes on 98% of the American public. Who’s going to argue with that?  At the end of the day, an agreement will be reached, though not necessarily in the timeframe we want.”

So basically, no problem. As reported by CNBC this morning, the only Fiscal Cliff offer on the table is the last one by President Obama – higher taxes on the highest 2%.  That will raise around 100-billion in revenue.  The deficit this year is $1-trillion+. 

My comment: The President’s proposal, if it comes to pass, will be a sad day for America.   We need to do more to cut the deficit, however; since the stock market tends to look ahead only about 3-6 months, any fiscal deal will be welcomed by Wall Street.  Don’t expect stocks to rise much because of it, though, because a “deal” is already baked-in-the-cake.

SENTIMENT
Sentiment is high enough and has been sustained long enough to call this indicator a sell.  As of Friday’s close, sentiment is 64%-bulls, so almost 2 out of every 3 investors are betting the markets will rise. (My sentiment indicator tracks the assets invested in selected bull and bear mutual funds in the Guggenheim Investment Family, formerly Rydex Funds.)  Clearly, the current bullish sentiment does not indicate that anyone believes we will actually go over the Fiscal Cliff in a meaningful way.

MARKET RECAP
Monday the S&P 500 was down 0.24% to 1427 (rounded).  VIX was unchanged at 17.84. 

NTSM
Overall, the NTSM analysis remains neutral, or HOLD.  Sentiment is the only negative indicator.

MY INVESTED POSITION
Based on the SELL signal, 7 November 2012, I moved out of the stock market at 1377 on the S&P 500.  Because of the negativity I have noted from Hussman and others, I am currently invested in a range of near 15% invested in stocks. 

HAVE A MERRY CHRISTMAS AND HAPPY HOLIDAY.

Saturday, December 22, 2012

NTSM is HOLD

I delayed posting the final result of the daily analysis because the NYSE total volume reported by Briefing.com looked suspicious.  The total number of shares traded by 3PM was about 50% above recent final daily levels – no problem there – but in the last hour they reported that the volume doubled to 1.8 billion shares.  My analysis relies heavily on volume, so I needed further confirmation. 
 
Bottom line: The S&P 500 volume was high, as expected, but there was no change to the NTSM analysis.  (Had I used the extreme number it would have switched a “panic-indicator” to sell (based on statistical analysis of price-volume) and that could have changed future NTSM calls.

Sorry for all the boring details, but the daily analysis is quite rigorous. 

At this point, staying out of the market may yet turn out to be for the best. 

I think the market had priced-in a deal on the Cliff that doesn’t do much, i.e., no change to Medicare, small tax increase on the rich and some mild spending cuts.

The Wall Street Journal reported today (Saturday) that Congressman Ryan is holding out for changes to the Medicare structure.  (I agree with that course – Medicare is in trouble because people are living longer and it is bleeding the Treasury; to fix it, just raise the eligibility age.)  Other Republicans are unwilling to vote for any tax increase and most Democrats oppose changes to Medicare.

In a weird sort of political game, I have read that some think the Republicans may be willing to vote for the President’s tax proposal after taxes are raised by the Fiscal Cliff legislation already enacted into law.  The increase would (at that point) be a decrease if that makes sense.  The WSJ said nothing about such possible motivations.  It simply noted that many Republicans are against ANY tax increase. 

If Fiscal Cliff becomes reality, the CNBC fear mongering will reach unprecedented levels and will push the S&P 500 down for that correction the NTSM system predicted in early November. 

No point in guessing now though.  NTMS is in neutral territory waiting for more direction – like all investors.

Friday, December 21, 2012

More Waiting

DISFUNCTIONAL GOVERNMENT
The Republicans in the House couldn’t agree to raise taxes at all and cancelled last night’s vote on the Republican Plan “B” Deal that would increase taxes only for those making above 1-million.  That calls into question the ability of the House to pass a fiscal cliff deal that involves any tax increase.  Presumably, the Democrats in the House could join with the moderate Republicans and do something.

On the Democratic side, it would appear that the only change to entitlement programs possible is one that reduces Social Security cost of living increases.  This isn’t looking good for a meaningful solution, or even a 1st step toward solving our deficit problem. 

Regarding cost of living; I always thought that COLAS already cheated retirees.  For example, the Consumer Price Index shifts the basket of goods considered, as prices change.  For example, if beef prices go up, an assumption is made that consumers will switch to chicken.  Extending that rationale to an extreme conclusion (for the sake of argument) would have all the elderly that rely on Social Security eating dog-food.  For a discussion as it relates to the cost of a Big Mac, read on…

BIG MAC AND CONSUMER PRICES
“The rise in the price of a Big Mac is faster than the official rise in consumer prices and has been since the late 90's. In 1998, the average price of a Big Mac was about $2.50. Today, the average Big Mac is $4.33. If we were using the Consumer Price Index (CPI), the price of a Big Mac today would be about $3.35.” - James Cornehlsen (December 17, 2012) from dshort.com.  Full discussion at…
http://advisorperspectives.com/dshort/guest/James-Cornehlsen-121217-Big-Mac-Inflation-Risk.php

RECESSION? – NOT ACCORDING TO D. SHORT
UNDERMINING THE ECRI RECESSION CALL
“…the November strength exhibited by Personal Incomes and Industrial Production certainly undermines their (ECRI) recession call… ECRI, however, has "walked the plank" with the company's recession call. And at this point there's no "Peter Pan" recession to save them from a sea of crocodiles.” – Full analysis and charts, Doug Short, dshort.com at…
http://advisorperspectives.com/dshort/updates/ECRI-Weekly-Leading-Index.php

MARKET RECAP
Friday the S&P 500 was down 0.9% to 1430 (rounded).  VIX was up 0.9% to 17.83. 

NTSM
I have what appears to be some bad volume data from my usual source for NYSE volume today.  I will post tomorrow regarding the NTSM status after I check other volume sources.

I’d like to comment generally, on the recent NTSM analysis.

Normally, if there is a switch in direction of the markets, the NTSM system will generate numerous signals in the direction of the move.  For example, the sell signal last April involved every indicator and persisted for many days.

Tuesday’s BUY signal (that I ignored, so far) only involved 2-trend-following indicators and was not repeated.  Further, the Sentiment indicator switched to sell Wednesday.   As a result, I will continue to wait for more clarity before I get back in the market – if at all.  If the Sentiment indicator had switched to sell on Tuesday (one day earlier), there never would have been a “buy” in the first place.  To summarize, we may as well cancel the Buy recommendation of last Tuesday and wait for confirmation, one way or the other.

MY INVESTED POSITION
Based on the SELL signal, 7 November 2012, I moved out of the stock market at 1377 on the S&P 500.  Because of the negativity I have noted from Hussman and others, I am currently invested in a range of near 15% invested in stocks. 

Thursday, December 20, 2012

GDP Up for the 3rd Quarter

US ECONOMY GREW BY 3.1%  (CNBC)
“The U.S. economy grew faster than previously estimated in the third quarter as exports and government spending provided a lift…With imports falling for the first time since the second quarter of 2009, that narrowed the trade deficit. Trade contributed 0.38 percentage point to GDP growth. The drop in imports is a sign of weak domestic demand…
…Government spending …boosted by a rebound in state and local government outlays…added three quarters of a percentage point to GDP growth in the third quarter…(G)rowth in consumer spending...reflected higher health care costs…
…Business inventories were trimmed to $60.3 billion from $61.3 billion. Restocking by businesses contributed 0.73 percentage point to GDP growth.”  Full story at…
http://www.cnbc.com/id/100330697

LEADING ECONOMIC INDICATORS (LEI) DECLINES
“The Conference Board’s Leading Economic Index® (LEI) for the U.S. declined 0.2 percent in November…bringing its six-month growth rate to zero,” says Ataman Ozyildirim, economist at The Conference Board….Says Ken Goldstein, economist at The Conference Board: “The indicators reflect an economy that remains weak in the face of strong domestic and international headwinds…”  Press release at…
http://www.conference-board.org/data/bcicountry.cfm?cid=1

CMT: The LEI numbers are not good news since previously, the LEI numbers had been up 0.3% and 0.4% in September and October respectively.  The data was released this morning. 

AMERICANS SEEKING UNEMPLYMENT AID RISES BY 17,000 (Washington) – “The number of Americans applying for unemployment benefits rose last week by 17,000, reversing four weeks of declines. But the number of people seeking aid is consistent with a job market that continues to grow modestly.” Full story at…
http://www.philly.com/philly/business/20121220_ap_americansseekingunemploymentaidrisesby17000.html#ixzz2Fce9H0XL
Watch sports videos you won't find anywhere else

MARKET RECAP
Thursday the S&P 500 was up 0.5% to 1444 (rounded).  VIX was up 2% to 17.70.  (The options boys seem to be getting nervous.)

NTSM
Thursday the NTSM analysis remains HOLD. 

As of yesterday’s close the NTSM Sentiment indicator is reaching extreme levels since it has climbed to 65%.  It is the only negative indicator.  While the VIX indicator appears to be waking up, it remains neutral.   

MY INVESTED POSITION
Based on the SELL signal, 7 November 2012, I moved out of the stock market at 1377 on the S&P 500.  Because of the negativity I have noted from Hussman and others, I am currently invested in a range of near 15% invested in stocks.  NTSM analysis now indicates BUY, as of 18 December, but my tentative plan is to buy back into the stock market late in the month.

I don’t like the rise in sentiment and the low volume Holiday trading could be exaggerated either way, so I’ll remain on the sidelines for a while longer.

Wednesday, December 19, 2012

Wait and See

CYCLICAL SPREAD – RECESSION INDICATOR
The long-term spread between the Morgan Stanley Cyclical Index and the S&P 500 continues increase.  At this point, this is not a concern since the Cyclical stocks are going up too.  Even though the charts I’ve posted are similar to precursors of previous market declines (http://navigatethestockmarket.blogspot.com/2012/12/ntsm-cyclical-index-spread-increasing.html), unless the spread starts getting steeper and the Cyclical stocks start falling too, this isn’t a negative for the overall market.
 
MARKET RECAP
Wednesday the S&P 500 was down 0.76% to 1436 (rounded).  VIX was up over 11% to 17.36.   (Who woke up the Options Boys?!)

NTSM
Wednesday the NTSM analysis switched to HOLD as volume moved to the downside. 

Sentiment increased to 63%-bulls at the close on Tuesday.  (I am always a day late on this indicator unless I stay up late to collect today’s, Wednesdays, data.)

The sell point is currently 67%-bulls for the Sentiment indicator.  I say, “currently” because this indicator varies with the sentiment trends over the past year and a statistical analysis of that trend.  It could easily move to SELL in a day or two if the buy-the-dip crowd moves in. 
 
MY THOUGHTS
A Sell in the sentiment indicator wouldn’t push the entire system to sell, but it calls into question whether I should be buying back in at this point.  I missed buying-the-low at 1353 and the move has been straight up since then, so the market is due for a breather.  We’ll see low-volume over the Holidays, so it’s anybody’s guess where the market goes, especially with the Fiscal Cliff still out there.  At this point, I have earned 10% this year – I’d rather not try to be a hero.  I am inclined to stand pat and buy later, perhaps at the end of December, assuming the market doesn’t deteriorate.  Who knows?…let’s see what happens.  As I said yesterday, this is not an exact science.  However; if I wanted to get back in the market now, I’d be inclined to invest only 50% in stocks.  I think caution remains the watch-word.

In the mean-time, I have a lot of work to do analyzing the 1353-low to figure out why the Wall Street algorithms bought before I did.  I’ll post more on that later.

MY INVESTED POSITION
Based on the SELL signal, 7 November 2012, I moved out of the stock market at 1377 on the S&P 500.  Because of the negativity I have noted from Hussman and others, I am currently invested in a range of near 15% invested in stocks.  NTSM now has a BUY in effect as of 18 December, but my tentative plan is to buy back into the stock market late in the month - wait and see.

Tuesday, December 18, 2012

NTSM Switches to BUY

WHAT WALL STREET ANALYSTS ARE GOOD FOR (Tyler Durden at ZeroHedge)...
It seems like it was only yesterday (actually it was 20 days ago) that Citi boldly went where every single other sellside analyst has gone before, and initiated...AAPL, with a Buy and a $675 price target...much has changed in three weeks apparently, because (Citi) just slashed AAPL's price target from $675 to $575, and cut its outlook on the name from Buy to Neutral, once again confirming what everyone knows: sellside research is the most hopelessly useless goalseeking, backward looking product created by Wall Street's brilliant minds whose only prerogative is how to bleed their clients dry.  Commentary at...
http://www.zerohedge.com/news/2012-12-16/citis-apple-coverage-tag-trio-downgrades-aapl-neutral-price-target-cut-100-575

Right now I feel like the Wall Street analysts referenced in the ZeroHedge article above.  Even more than being on the wrong side of a trade from the money aspect – I hate being wrong!

MARKET RECAP
Tuesday the S&P 500 was UP another 1.2% to 1447 (rounded).  VIX was down almost 5% to 15.57.  

Today was the 3rd statistically significant day in the past 4-days consisting of a down-day followed by 1 non-significant day followed by 2-up days that were significant.  That last happened last August 24th (see Monday’s blog for a discussion of statistically significant days).  That turned out to be 3-weeks before the 1466 top.  That situation could repeat again since there are several of my indicators that seem quite stretched, even though overall the NTSM system is signaling BUY.

NTSM
Tuesday the NTSM analysis switched to BUY based on the trend following indicators of Price and Volume. 

With 2-statistically significant days up in a row (and the S&P 500 chart looking parabolic (if only for a couple of days) I am going to sit out another day or two just to be sure this isn’t a fake-out, market-manipulation move.  (Well, I can never be "sure" so perhaps I should say, I'll wait for a little more information and hopefully, gain some confidence.)

Longer term trends for Market Internals still don’t look great, but they are not horrible either.  More recently, internals have been great, as would be expected on days with extreme positive moves.  As I noted in posting about the top on the MS Cyclical Index chart yesterday, the spread has topped anywhere from 6-weeks to 2-months early in the past so we could go up a while further.   Sentiment is getting toppy at 60%-bulls as of Monday’s close so, here again, this looks negative and it could top in a few weeks, or less.

So the bottom line is; I’ll probably get back in in the next day or two unless the market takes a sharp turn for the worse or (if on the other hand) it continues screaming up.  Screaming up could be a blow-off top, especially if sentiment continues up at the rate it has recently.  Ah well, this is not an exact science by any means and it has been very un-exact over the past month or two.

As noted recently by ZeroHedge: “Bullish or bearish, it seems the velocity and scale of the runaway moves after every utterance from D.C. has wrong-footed many across every asset class.”  The author went on to suggest that the market action was much like the Debt Ceiling negotiations that turned out to be a buy-the-rumor sell-the-news story last year.  That is very likely here.  A Fiscal Cliff deal is likely to bring-on selling – even if it’s only profit taking.  See ZeroHedge at…
http://www.zerohedge.com/news/2012-12-18/deja-vu-all-over-again

MY INVESTED POSITION
Based on the SELL signal, 7 November 2012, I moved out of the stock market at 1377 on the S&P 500.  Because of the extreme negativity I have noted from Hussman and others, I am currently invested in a range of near 15% invested in stocks and I am still holding short positions; but I plan to move back into the market in the next day or two, after Wednesday.  I’ll cover shorts Wednesday.

Monday, December 17, 2012

NTSM Cyclical Index Spread – Increasing Recession Risk

RECESSON REPORT – UPDATE OF THE NTSM INDICATOR
My “Fear-of-Recession” indicator tracks the spread (on a moving-average, percentage basis) between the S&P 500 and the Morgan Stanley Cyclical Index.  The theory is that since the cyclical stocks tend to be more recession sensitive, they will fall before a recession starts, thus giving a warning of an impending downturn in the S&P 500.  I have looked at this theory from a number of angles, but I haven’t been able to come up with accurate buy/sell points.  So far I have developed only a rough indicator shown on the following chart.  The Black line is the S&P 500; the Blue is the Morgan Stanley Cyclical index.  The spread between the indices (expressed as the inverse of a moving-average of percentage change) is shown solid Red.  The indicator falls when the spread increases since it is an inverse of the spread.  (That just makes it easier to visualize.)

A downturn in the spread has preceded corrections in 2010 and 2011 by about 6-weeks to 2-months.

The indicator is now falling steeply and thus it is “leaning toward recession”; the current downtrend started 8-trading days ago on 6 December.  My “Fear of Recession” indicator would move to an all-out sell mode if the Morgan Stanley Cyclical Index falls at a steeper rate.


Because of its limitations noted above, the Fear-of-Recession indicator is not yet included in the Navigate the Stock Market system that generated a sell signal on 7 November.

HUSSMAN ON RECESSION
John Hussman, PhD, still thinks we are in recession.  Here’s a comment from a trader board I visit (my friend Cliff will appreciate this comment): “so what ?  this guy has been calling the same doom and gloom since SP 1000, 3-yrs ago....here we are 42% higher... one day, he'll be right, in the meantime he got hammered....”

BORING STATISTICS
After 3-weeks without a statistically significant move, as measured in price-volume, the S&P 500 has had 3-statistically significant days in the last 5-trading days.  (A statistically significant day exceeds the average plus 1-std deviation over the last 10 or 20-days {one-sigma}.) There is an underlying trend in the data that suggests weakening.  Looking at only the statistically significant days that were up, the trend in the size of the up-days has been declining.  That is not a tradable trend though – it could persist as the market continues up for some time.  It’s a trend worth watching.

MORE ON THE FED “EXPERIMENT” (FROM HUSSMAN’S POINT OF VIEW)
“Federal deficits presently support about 10% of economic activity... last week, Ben Bernanke announced that the current “Twist” program (where the Fed buys long-term Treasuries and sells an equal amount of shorter-dated Treasuries) will be replaced with outright “unsterilized” bond purchases. In doing so, Ben Bernanke has put the economy on course to choke down 27 cents of monetary base for every dollar of nominal GDP by the end of next year – in an economy where even the slightest normalization to interest rates of just 2% would require the monetary base to be cut to just 9 cents per dollar of GDP to avoid inflationary outcomes.

...To normalize the Fed’s balance sheet without contraction and get from 27 cents back to 9 cents of base money per dollar of GDP without rapid inflation, we would require over 22 years of suppressed interest rates below 2%, assuming GDP growth at a 5% nominal rate. Indeed, Japan is on course for precisely that outcome, having tied its fate 13 years ago to Bernanke’s experimental prescription.”  - John Hussman, PhD, Weekley Market Commentary for 17 December 2012, Hussman Funds at...
http://www.hussmanfunds.com/

IS THE US THE NEXT JAPAN?
Japan has the highest Debt to GDP ratio in the developed world.  The United States is number 2.  Today the NIKKEI is only 25% of its value in 1990 – or stated another way – the Japanese stock market has lost 75% of its value in the last 20-years.  A similar outcome for the US would put S&P 500 at about 400 in year 2032.  Kind of plays havoc with retirement planning doesn’t it?   Keep in mind, as Hussman noted, the United States has been advising Japan how to “stimulate” their economy with deficit spending and monetary easing.

Fortunately, our country is blessed with natural resources while Japan is not.  This should give us significant capability for our economy to grow when compared to Japan, but make no mistake; the hole our Politicians have put us in is massive and there will be long-term consequences.  Our Politicians must act now to minimize the damage.

MARKET RECAP
Monday the S&P 500 was UP 1.2% to 1430 (rounded).  VIX was down  4% to 16.34.  

NTSM
Monday the NTSM analysis remained HOLD. 

MY INVESTED POSITION
Based on the SELL signal, 7 November 2012, I moved out of the stock market at 1377 on the S&P 500.  Because of the extreme negativity I have noted from Hussman and others, I am currently invested in a range of near 15% invested in stocks and I am still holding short positions.

Friday, December 14, 2012

Federal Reserve – If they were Doctors, they’d be in Jail

THE GREAT FEDERAL RESERVE EXPERIMENT (WSJ)
Regarding the Federal Reserve, Wednesday’s Wall Street Journal stated: “Their monetary strategy isn’t found in standard textbooks.  The Central bankers are in effect conducting a high stakes experiment…(that) could kindle inflation or sow the seeds of another financial crisis.”  Kenneth Rogoff, professor of economics at Harvard and author of “This Time is Different” has examined 800-years of data.  He said, “They are taking risks…it is an experimental strategy.”

As pointed out by MIT Professor Athanasios Orphanides, this strategy failed in the 1970’s when the central banks kept rates too low for too long – it brought high inflation, not high employment. – Wall Street Journal, print edition, 12/12/12

MOHAMED EL-ERIAN, PIMCO CEO & CO-CHIEF INVESTMENT OFFICER (NBR) 12 Dec 2012
Regarding the Federal Reserve’s latest moves (additional Bond buying), El-Erian said in a Nightly Business Report interview:  “The analogy, Susie, is look at the patient who is taking an experimental drug, that hasn’t been clinically tested…It doesn’t speak to what is going to happen to equity prices on its own, but it does speak to certain things. It speaks to a weaker dollar, probably higher gold prices and more inter-day volatility.”

“The most likely scenario is that you get a bit of tranquility and then something breaks. And it breaks in the sense that systems are not built to be run at artificial interest rates and with the Fed being both a player and a referee in markets.”

“… we are taking down risks. It has been a wonderful time for risk assets. It is time to reduce your risk exposure and it is time to build a little bit more inflation protection in your portfolios.”  Interview at….
http://www.nbr.com/videos/video/2031787879001#.UMnxU794w7I

AND THIS FROM A MEMBER OF THE FEDERAL RESERVE
from CNBC:  The U.S. Federal Reserve's latest policy actions risk stoking inflation and stray into fiscal policy territory, said Richmond Federal Reserve President, Jeffrey Lacker, explaining why he had voted against the Fed's policy actions on Wednesday…"With economic activity growing at a modest pace and inflation fluctuating close to 2 percent the Committee's inflation goal - further monetary stimulus runs the risk of raising inflation and destabilizing inflation expectations."

Furthermore, he argued buying mortgage-backed bonds meant the Fed was favoring housing over other parts of the economy.  "Deliberately tilting the flow of credit to one particular economic sector is an inappropriate role for the Federal Reserve," he said, adding that trying to influence credit allocation within the economy was a function of fiscal policy.  Story at…
http://www.cnbc.com/id/100314725

ANOTHER RECESSION CALL
“How to position yourself for the coming recession” (MarketWatch) - John Nyaradi, Publisher of Wall Street Sector Selector

“With the forecast for recession at 100%, it's highly likely that investors will need to be more active and knowledgeable than ever… Wall Street Sector Selector remains in "red flag" mode as we approach the end of 2012.”   Full story at….
http://www.marketwatch.com/story/us-chance-of-recession-is-100-2012-12-12?link=MW_popular

MARKET RECAP 
Friday the S&P 500 was down 0.4% to 1414 (rounded).  VIX was up 2.7% to 17.00.  

Apple broke to new lows today; it was down 4%.  That may be a bad indicator for the future of this market.  When leaders fail – others follow.

NTSM
Friday the NTSM analysis remained HOLD. 

Market internals are breaking down and late-day selling continues, so I think the market generally goes down for a while.  Of course I have been wrong in my call for a retest of the 1353 so far - that is still my best guess though.

MY INVESTED POSITION
Based on the SELL signal, 7 November 2012, I moved out of the stock market at 1377 on the S&P 500.  Because of the extreme negativity I have noted from Hussman and others, I am currently invested in a range of near 15% invested in stocks and I am still holding short positions.