Friday and the weekend will be a bear so I may not have a
post for Friday...we’ll see. For the time being, I’m planning to post Friday’s
Blog Sunday evening.
“Trade what you see; not what you think.” – The Old Fool,
Richard McCranie, trader extraordinaire.
“Far
more money has been lost by investors in preparing for corrections, or
anticipating corrections, than has been lost in the corrections themselves.” -
Peter Lynch, former manager of Fidelity’s Magellan® fund.
The above cartoon refers to the phony electors Trump put
forward in 2020. Trump’s next trials are the critical ones. Based on what we
learned during the House January 7 hearings, Trump is guilty of conspiracy to
overturn his loss in the 2020 election.
TRUMP CONVICTED (CNN)
“A Manhattan jury found
Donald Trump guilty of 34 charges of falsifying business records
Thursday, an unprecedented and historic verdict that makes Trump the
first former president in American history to be convicted of a felony.” Story
at...
https://www.cnn.com/2024/05/30/politics/donald-trump-hush-money-trial-verdict/index.html
My cmt: One of my acquaintances claimed that Trump could
be convicted with less than a unanimous decision, because he gets his news from
suspect sources. That was not true. The decision was unanimous on all accounts.
“Merchan told the jury in his instructions on Wednesday that their verdict “must
be unanimous” on each of the 34 counts that Trump faces and that, to
convict Trump of felony falsification of business records, they would have
to unanimously agree that he falsified business records with the intent to
commit, aid or conceal another crime – that other crime being a violation of a
New York election law.” From...
https://www.cnn.com/politics/live-news/trump-hush-money-trial-05-30-24/h_14037bf137beb71163ae91cf4a151dd6
My cmt: Jail time is not expected by most experts.
TRUMP’S REACTION
Predictably, Trump claimed it was a “rigged trial.” “Corrupt
Disgraceful.”
What struck me was his statement, “We will fight for
our Constitution.” WTF??? Trump tried to overturn the 2020 election by
putting forth a phony set of electors. In the history of our country, no one
has done more to void the Constitution than Donald Trump. (Biden’s student loan
forgiveness is not a Presidential power under the Constitution, however, that pales
in comparison to attempting to overturn an election.)
JOBLESS CLAIMS (AP News)
“The number of Americans applying for unemployment
benefits ticked up last week, but layoffs remain historically low in the face
of lingering inflation and high interest rates. Jobless claims for the week
ending May 25 rose by 3,000 to 219,000...” Story at...
https://apnews.com/article/unemployment-benefits-jobless-claims-layoffs-laborb1cc3ffde0194a96e5859def09d75040
GDP (Yahoo News)
“The Bureau of Economic Analysis's second estimate of first quarter US gross domestic product (GDP) showed the economy grew at an annualized pace of
1.3% during the period, down from a first reading in April of 1.6%
growth and in line with economist estimates.” Story at...
https://finance.yahoo.com/news/gdp-us-economy-grew-at-a-slower-pace-than-initially-thought-in-q1-131220924.html
CRUDE INVENTORIES (EIA)
“U.S. commercial crude oil inventories (excluding those
in the Strategic Petroleum Reserve) decreased by 4.2 million barrels from the
previous week. At 454.7 million barrels, U.S. crude oil inventories are about
4% below the five year average for this time of year.” Report at...
https://ir.eia.gov/wpsr/wpsrsummary.pdf
MARKET REPORT / ANALYSIS
-Thursday the S&P 500 declined about 0.6% to 5235.
-VIX rose about 1% to 14.47.
-The yield on the 10-year Treasury fell to 4.55%.
MY TRADING POSITIONS:
UWM – Added 5/2/2024
QLD – Added 4/29/2024
SSO – Added 4/29/2024.
XLE – Added 4/24/2024
CRM – Added 1/22/2024.
XLK – Technology ETF (holding since the October 2022
lows). I don’t want to pay taxes on this gain, so I am holding this position.
DWCPF - Dow Jones U.S. Completion Total Stock Market
Index. – Added 12/7/2023 when I sold the S&P 500.
“The Dow Jones U.S. Completion Total Stock Market Index,
also known as the DWCPF, is a widely used financial index that provides a
comprehensive measure of the US equity market. The DWCPF includes all US stocks
that are not included in the Dow Jones US Total Stock Market Index, which
comprises large-cap and mid-cap companies. As a result, the DWCPF provides a
complete picture of the US stock market, including small-cap and micro-cap
companies, which are often overlooked by other indexes.” From...
https://fi.money/blog/posts/what-is-dow-jones-u-s-completion-total-stock-market-index-dwcpf
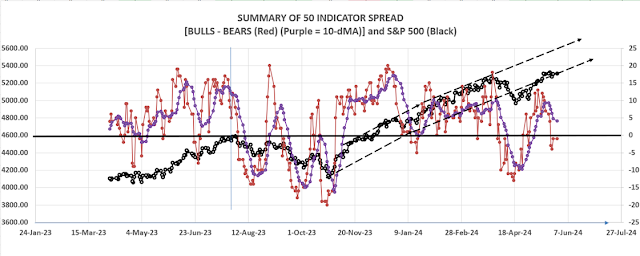
CURRENT SUMMARY OF APPROXIMATELY 50 INDICATORS:
The Bull/Bear Spread (Bull Indicators minus Bear
Indicators) is now bearish. Today there were 16 Bear-signs and 8-Bull. (The
rest are neutral. It is normal to have a lot of neutral indicators since many
of those are top or bottom indicators that will signal only at extremes.) The
10-dMA of spread (purple line in the chart below) was down again today.

TODAY’S COMMENT:
The Trump news came out after the market close. S&P
500 Futures are down slightly (-0.14%) as I write this blog post at 7 pm, so it
is not clear that the Trump verdict will affect the markets. PCE inflation is a
bigger deal at this point.
On a more positive note, Thursday was a statistically
significant down-day. That just means that the price-volume move exceeded my
statistical parameters. Statistics show that a statistically-significant,
down-day is followed by an up-day about 60% of the time. Bottoms occur on
statistically-significant, down-days, since they tend to be flush out days that
shake out weak hands; but not all statistically-significant, down-days are
bottoms. Breadth improved today, so it is possible that today was a
bottom. The Trump news may be the
wild-card that “Trumps” the technical.
The S&P 500 is 1.1% above 50-dMA; I don’t expect the
Index to fall lower than the 50-day, if it does continue its decline. That is
normally the lower trend line so I am not making moves in the portfolio yet. So
far, weakness is perfectly normal.
I did not sell leveraged positions today; breadth
improved and the Russell 200 was up 1%.
Considering the charts and indicators, I don’t see enough
bear-signs to make significant changes to the portfolio at this time, although
I will be watching closely over the next several days. A break below the 50-dMA
would be a concern.
LONG-TERM INDICATOR: The Long Term NTSM indicator
remained HOLD: PRICE is bullish; VOLUME, VIX & SENTIMENT are neutral.
(The Long-Term Indicator is not a good top-indicator. It
can signal BUY at a top.)
(The important major BUY in this indicator was on 21
October 2022, 7-days after the bear-market bottom. For my NTSM overall signal,
I suggested that a short-term buying opportunity occurred on 27 September
(based on improved market internals on the retest), although without market
follow-thru, I was unwilling to call a buy; however, I did close shorts and
increased stock holdings. I issued a Buy-Signal on 4 October, 6-days before the
final bottom, based on stronger market action that confirmed the market internals
signal. The NTSM sell-signal was issued 21 December, 9 sessions before the high
of this recent bear market, based on the bearish “Friday Rundown” of
indicators.)
BOTTOM LINE
I neutral at this point watching the markets.
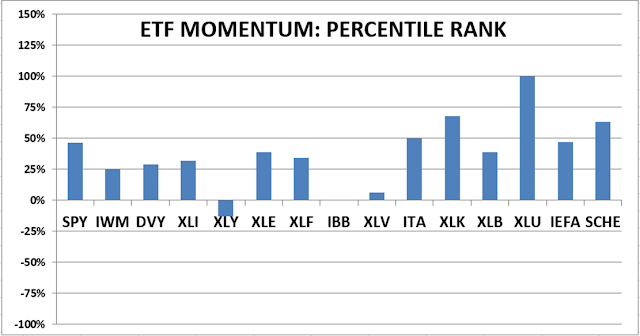
ETF - MOMENTUM ANALYSIS:
TODAY’S RANKING OF 15 ETFs (Ranked Daily) ETF ranking
follows:
The top ranked ETF receives
100%. The rest are then ranked based on their momentum relative to the leading
ETF.
*For additional background on
the ETF ranking system see NTSM Page at…
http://navigatethestockmarket.blogspot.com/p/exchange-traded-funds-etf-ranking.html
DOW STOCKS - TODAY’S MOMENTUM RANKING
OF THE DOW 30 STOCKS (Ranked Daily)
The top ranked Stock receives
100%. The rest are then ranked based on their momentum relative to the leading Stock.
For more details, see NTSM
Page at…
https://navigatethestockmarket.blogspot.com/p/a-system-for-trading-dow-30-stocks-my_8.html
THURSDAY MARKET INTERNALS (NYSE
DATA)
My basket of Market Internals remained Bearish. (My basket of Market
Internals is a decent trend-following analysis of current market action, but
should not be used alone for short term trading. They are most useful when they
diverge from the Index.)
...My current invested
position is about 75% stocks, including stock mutual funds and ETFs. I’m usually
about 50% invested in stocks, so this is a bullish, over-invested position.
This is my max % for stock allocation.
I trade about 15-20% of the total portfolio using the
momentum-based analysis I provide here. When I see a definitive bottom, I add a
lot more stocks to the portfolio, usually by using an S&P 500 ETF as I did
back in October 2022 and 2023.
“Trade what you see; not what you think.” – The Old Fool,
Richard McCranie, trader extraordinaire.
“Far
more money has been lost by investors in preparing for corrections, or
anticipating corrections, than has been lost in the corrections themselves.” -
Peter Lynch, former manager of Fidelity’s Magellan® fund.
The above picture proves the Moon landings were fake? The
people who believe that are the same folks who believe Trump won the 2020
election, the CIA killed JFK and the Twin Towers were brought down by the US
Government. (FYI, the photo was taken during astronaut training at Kennedy
Space Center – not the moon.) Oh yeah, here’s another one... Coronavirus was
fake. My nurse-daughter heard that one
from patients (“I can’t be dying; Covid is fake.”) at her hospital early in the
pandemic.
ARE BIDEN OFFICIALS COVERING UP A TERROR ATTACK BY
ILLEGAL IMMIGRANTS (New York Post)
“By refusing repeated chances to answer simple questions
about a May 3 incident at Quantico Marine Corps base, the Biden administration
has essentially confirmed one of America’s worst — and most politically
consequential — nightmares related to the ongoing border crisis. Two illegal
immigrants just attempted a terror attack on US soil.” Story at...
Are
Biden officials covering up an attempted terror attack by illegal immigrants?
(msn.com)
BUY THIS LEGISLATION OR WE’LL KILL THE INTERNET (WSJ)
“Repealing Section 230 [it sunsets 31 December 2025] without
a plan to replace it is a bipartisan idea—and a terribly reckless one.
The law in question is Section 230 of the 1996
Communications Decency Act. The statute provides that the person who creates
content online is legally responsible for it and that websites aren’t liable
for efforts to moderate their platforms to make them more welcoming, useful or
interesting... Recent history suggests Congress won’t meet its self-imposed
deadline. It’s best to judge this latest exercise in brinkmanship for what it
is: A reckless ploy to repeal Section 230 without a plan to replace it.” Story
at...
https://www.wsj.com/articles/buy-this-legislation-or-well-kill-the-internet-9184202b
My cmt: Blaming “Big Tech” is popular, but if platforms
are responsible for the posts of nut-case, whakos the internet will be
profoundly different and probably not for the better. Is the phone company
liable if someone is harassed on the telephone?
FED BEIGE BOOK (RTT News)
“U.S. economic activity continued to expand from early
April to mid-May, according to the Federal Reserve's Beige Book, although
conditions varied across industries and districts... Several Districts reported
that wage growth was at pre-pandemic historical averages or was normalizing
toward those rates... The report also said prices increased at a modest pace
over the reporting period and are expected to continue to grow at a modest pace
in the near term.” Story at...
https://www.rttnews.com/3450960/fed-s-beige-book-says-u-s-economy-continued-to-expand-prices-rose-modestly.aspx
MARKET REPORT / ANALYSIS
-Wednesday the S&P 500 declined about 0.8% to 5267.
-VIX rose about 11% to 14.28 so the Options players are
worried.
-The yield on the 10-year Treasury rose to 4.736%.
MY TRADING POSITIONS:
UWM – Added 5/2/2024
QLD – Added 4/29/2024
SSO – Added 4/29/2024.
XLE – Added 4/24/2024
CRM – Added 1/22/2024.
XLK – Technology ETF (holding since the October 2022
lows). I don’t want to pay taxes on this gain, so I am holding this position.
DWCPF - Dow Jones U.S. Completion Total Stock Market
Index. – Added 12/7/2023 when I sold the S&P 500.
“The Dow Jones U.S. Completion Total Stock Market Index,
also known as the DWCPF, is a widely used financial index that provides a comprehensive
measure of the US equity market. The DWCPF includes all US stocks that are not
included in the Dow Jones US Total Stock Market Index, which comprises
large-cap and mid-cap companies. As a result, the DWCPF provides a complete
picture of the US stock market, including small-cap and micro-cap companies,
which are often overlooked by other indexes.” From...
https://fi.money/blog/posts/what-is-dow-jones-u-s-completion-total-stock-market-index-dwcpf
CURRENT SUMMARY OF APPROXIMATELY 50 INDICATORS:
The Bull/Bear Spread (Bull Indicators minus Bear
Indicators) continued its trend toward bearish. Today there were 14 Bear-signs
and 9-Bull. (The rest are neutral. It is normal to have a lot of neutral
indicators since many of those are top or bottom indicators that will signal
only at extremes.) The 10-dMA of spread (purple line in the chart below) was
down again today.
TODAY’S COMMENT:
Indicators are now bearish, but not extremely so. The S&P 500 is 1.7% above it 50-dMA. That is normally the lower trend line so I am
not making moves in the portfolio yet. So far, weakness is perfectly normal. I’ll
need to look at the leveraged positions tomorrow; I don’t like to take losses
in those trades.
Salesforce tanked today, down 16% afterhours.
“Salesforce (CRM) shares are
sinking after Wednesday's market close as the cloud computing company reported
mixed first-quarter earnings results. Salesforce posted $9.13 billion in
revenue ($9.15 billion expected) and gains of $2.44 per share ($2.38 per share
expected). The downward stock pressure is heavily attributed to Salesforce's
miss on second-quarter forecasts.” From...
https://finance.yahoo.com/video/salesforce-stock-sinking-q2-earnings-202330512.html
I don’t see enough bear signs to make significant changes
to the portfolio at this time, although I will consider selling leveraged
positions.
LONG-TERM INDICATOR: The Long Term NTSM indicator
remained HOLD: PRICE is bullish; VOLUME, VIX & SENTIMENT are neutral.
(The Long-Term Indicator is not a good top-indicator. It
can signal BUY at a top.)
(The important major BUY in this indicator was on 21
October 2022, 7-days after the bear-market bottom. For my NTSM overall signal,
I suggested that a short-term buying opportunity occurred on 27 September
(based on improved market internals on the retest), although without market
follow-thru, I was unwilling to call a buy; however, I did close shorts and
increased stock holdings. I issued a Buy-Signal on 4 October, 6-days before the
final bottom, based on stronger market action that confirmed the market
internals signal. The NTSM sell-signal was issued 21 December, 9 sessions
before the high of this recent bear market, based on the bearish “Friday Rundown”
of indicators.)
BOTTOM LINE
I remain cautiously bullish.
ETF - MOMENTUM ANALYSIS:
TODAY’S RANKING OF 15 ETFs (Ranked Daily) ETF ranking
follows:
The top ranked ETF receives
100%. The rest are then ranked based on their momentum relative to the leading
ETF.
*For additional background on
the ETF ranking system see NTSM Page at…
http://navigatethestockmarket.blogspot.com/p/exchange-traded-funds-etf-ranking.html
DOW STOCKS - TODAY’S MOMENTUM RANKING
OF THE DOW 30 STOCKS (Ranked Daily)
The top ranked Stock receives
100%. The rest are then ranked based on their momentum relative to the leading Stock.
For more details, see NTSM
Page at…
https://navigatethestockmarket.blogspot.com/p/a-system-for-trading-dow-30-stocks-my_8.html
WEDNESDAY MARKET INTERNALS
(NYSE DATA)
My basket of Market Internals remained Bearish. (My basket of Market
Internals is a decent trend-following analysis of current market action, but
should not be used alone for short term trading. They are most useful when they
diverge from the Index.)
...My current invested
position is about 75% stocks, including stock mutual funds and ETFs. I’m
usually about 50% invested in stocks, so this is a bullish, over-invested
position. This is my max % for stock allocation.
I trade about 15-20% of the total portfolio using the
momentum-based analysis I provide here. When I see a definitive bottom, I add a
lot more stocks to the portfolio, usually by using an S&P 500 ETF as I did
back in October 2022 and 2023.
“Trade what you see; not what you think.” – The Old Fool,
Richard McCranie, trader extraordinaire.
“Far
more money has been lost by investors in preparing for corrections, or
anticipating corrections, than has been lost in the corrections themselves.” -
Peter Lynch, former manager of Fidelity’s Magellan® fund.
“...why is our media coverage of Russia’s massive bombing
of Ukraine’s civilian housing and infrastructure so lightly reported,
especially compared with its immediate, intense coverage of Israel’s attempts
to root out and finally destroy the terrorist organizations that so brutally
attacked it on Oct. 7?” - Ellery
Block, WSJ letters.
LIBERTARIANS WARN ABOUT TRUMP (CNN)
“You don’t need to be a member of the Libertarian Party
to understand that if Trump had been successful in his efforts to remain in
power despite losing the 2020 election, our democratic republic as we know it
would have ended. Elections would no longer matter if Trump or any candidate —
without credible evidence and after losing all judicial appeals — could declare
that he or she could remain in office simply by alleging there was widespread
fraud. That is why he has been charged with
numerous felonies in both the federal courts and in Fulton County, Georgia... I
hope people across the country read about what took place Saturday night at the
Libertarian convention. Maybe, just maybe, the loud jeers and boos by those
patriotic Americans directed against Trump will wake up their fellow citizens
to the threat he poses if he’s elected again to lead our country.” - Dean
Obeidallah, a former attorney, is the host of SiriusXM radio’s daily program
“The Dean Obeidallah Show.” Follow him on Threads. Opinion
at...
https://www.cnn.com/2024/05/27/opinions/trump-booed-libertarian-convention-2024-election-obeidallah/index.html
BRAGG HASN’T PROVED THE TRUMP NY FRAUD CASE (WSJ)
“To get a guilty verdict on the 34 bookkeeping felonies,
Mr. Bragg must prove both that Mr. Trump falsified business records, and also
that he did it with intent to commit or conceal a second crime... Mr. Bragg’s
main argument for the second crime is that because the Stormy payoff was
primarily meant to influence the 2016 election, it was in effect an illegal
donation to Mr. Trump’s campaign... Judge Merchan said Tuesday he was reserving
decision on a request by the defense to tell jurors Mr. Trump must have acted
“willfully” to be found guilty. Either way, the reality is that hush money
isn’t illegal, disguising the bookkeeping is a misdemeanor that’s past its
statute of limitations, and Mr. Bragg jury-rigged the felonies using an alleged
second crime that doesn’t look like a crime.” WSJ Editorial staff. Opinion at...
https://www.wsj.com/articles/donald-trump-trial-jury-stormy-daniels-alvin-bragg-juan-merchan-campaign-finance-fa2d1596
My cmt: Regular readers know I do not support trump (or
Biden either), but this Stormy Daniels case has always looked like a witch
hunt.
BIDEN LIES AGAIN (NY Post)
“President Biden
repeated a claim that he turned down an appointment to the Naval Academy, where
he said he intended to play football, during his commencement speech at West
Point on Saturday... “And I’d found out two days earlier they had a quarterback
named Roger Staubach and a halfback named Joe Bellino — I said, ‘I’m not going
there.’ I went to Delaware. Not a joke,’ the president said... “He has repeated
this lie many times before and there is still no record any of it ever
happened,” the RNC posted. Biden’s 2008 autobiography “Promises to Keep” notably does not mention the Naval Academy.”
Story at...
Biden
repeats 2022 Naval Academy appointment story at West Point commencement
(msn.com)
My cmt: What did we do to deserve Biden and Trump as the
party candidates for president?
"Thinking is the hardest work there is, which is the
probable reason why so few engage in it.” - Henry Ford
CONSUMER CONFIDENCE (Conference Board)
“Consumers’ assessment of current business conditions was
slightly less positive than last month. However, the strong labor market
continued to bolster consumers’ overall assessment of the present situation.
Views of current labor market conditions improved in May... Compared to last
month, confidence improved among consumers of all age groups.” Press release
at...
https://www.conference-board.org/topics/consumer-confidence
MARKET REPORT / ANALYSIS
-Tuesday the S&P 500 rose about 1 pt to 5306.
-VIX rose about 8% to 12.92 so the Options players are
worried.
-The yield on the 10-year Treasury rose above 4.5%, but the
actual numbers were not available from my usual source.
MY TRADING POSITIONS:
UWM – Added 5/2/2024
QLD – Added 4/29/2024
SSO – Added 4/29/2024.
XLE – Added 4/24/2024
CRM – Added 1/22/2024.
XLK – Technology ETF (holding since the October 2022
lows). I don’t want to pay taxes on this gain, so I am holding this position.
DWCPF - Dow Jones U.S. Completion Total Stock Market
Index. – Added 12/7/2023 when I sold the S&P 500.
“The Dow Jones U.S. Completion Total Stock Market Index,
also known as the DWCPF, is a widely used financial index that provides a
comprehensive measure of the US equity market. The DWCPF includes all US stocks
that are not included in the Dow Jones US Total Stock Market Index, which
comprises large-cap and mid-cap companies. As a result, the DWCPF provides a
complete picture of the US stock market, including small-cap and micro-cap
companies, which are often overlooked by other indexes.” From...
https://fi.money/blog/posts/what-is-dow-jones-u-s-completion-total-stock-market-index-dwcpf
CURRENT SUMMARY OF APPROXIMATELY 50 INDICATORS:
The Bull/Bear Spread (Bull Indicators minus Bear
Indicators) was slightly more bearish, but still close to a Neutral position
with 12 Bear-signs and 10-Bull. (The rest are neutral. It is normal to have a
lot of neutral indicators since many of those are top or bottom indicators that
will signal only at extremes.) The 10-dMA of spread (purple line in the chart
below) was down again today but its rate of fall improved.
TODAY’S COMMENT:
The Bull-Bear spread of indicators is close to neutral,
but bear signs are concerning. Some of those Bear signs are:
-Money Trend
-McClellan Oscillator.
-The smoothed advancing volume on the NYSE is falling.
-Breadth MACD
-Long-term and short-term New-high new-low data.
-Cyclical Industrials vs. the S&P 500.
-The 10-dMA of issues advancing on the NYSE is again below
50%.
-The Hindenburg Omen improved and is not giving a signal
today, however, the Omen remains in place until the McClellan Oscillator turns
positive. The Oscillator is still
negative, so the Hindenburg warning remains in place.
A couple of important Bull signs are:
-Buying Pressure has been exceeding selling pressure
-The S&P 500 is 2.5% above its 50-dMA. That’s usually
the lower trend line so the Index remains in its channel; I remain cautiously bullish.
I don’t see enough bear signs to make any changes to the
portfolio. I am worried about my
Salesforce holding. It has not been
performing well recently – do other investors know something I don’t? I may be punished again for not following my own system.
LONG-TERM INDICATOR: The Long Term NTSM indicator
remained HOLD: PRICE is bullish; VOLUME, VIX & SENTIMENT are neutral.
(The Long-Term Indicator is not a good top-indicator. It
can signal BUY at a top.)
(The important major BUY in this indicator was on 21
October 2022, 7-days after the bear-market bottom. For my NTSM overall signal,
I suggested that a short-term buying opportunity occurred on 27 September
(based on improved market internals on the retest), although without market
follow-thru, I was unwilling to call a buy; however, I did close shorts and
increased stock holdings. I issued a Buy-Signal on 4 October, 6-days before the
final bottom, based on stronger market action that confirmed the market internals
signal. The NTSM sell-signal was issued 21 December, 9 sessions before the high
of this recent bear market, based on the bearish “Friday Rundown” of
indicators.)
BOTTOM LINE
I remain cautiously bullish.
ETF - MOMENTUM ANALYSIS:
TODAY’S RANKING OF 15 ETFs (Ranked Daily) ETF ranking
follows:
The top ranked ETF receives
100%. The rest are then ranked based on their momentum relative to the leading
ETF.
*For additional background on
the ETF ranking system see NTSM Page at…
http://navigatethestockmarket.blogspot.com/p/exchange-traded-funds-etf-ranking.html
DOW STOCKS - TODAY’S MOMENTUM RANKING
OF THE DOW 30 STOCKS (Ranked Daily)
The top ranked Stock receives
100%. The rest are then ranked based on their momentum relative to the leading Stock.
For more details, see NTSM
Page at…
https://navigatethestockmarket.blogspot.com/p/a-system-for-trading-dow-30-stocks-my_8.html
TUESDAY MARKET INTERNALS (NYSE
DATA)
My basket of Market Internals switched back to Bearish. (My basket of Market
Internals is a decent trend-following analysis of current market action, but
should not be used alone for short term trading. They are most useful when they
diverge from the Index.)
...My current invested
position is about 75% stocks, including stock mutual funds and ETFs. I’m
usually about 50% invested in stocks, so this is a bullish, over-invested
position. This is my max % for stock allocation.
I trade about 15-20% of the total portfolio using the
momentum-based analysis I provide here. When I see a definitive bottom, I add a
lot more stocks to the portfolio, usually by using an S&P 500 ETF as I did
back in October 2022 and 2023.
“Trade what you see; not what you think.” – The Old Fool,
Richard McCranie, trader extraordinaire.
“Far
more money has been lost by investors in preparing for corrections, or
anticipating corrections, than has been lost in the corrections themselves.” -
Peter Lynch, former manager of Fidelity’s Magellan® fund.
“Houstonians with electric stoves can’t cook, those with
electric water heaters lack hot water – and those with electric cars can’t
charge them. The range of an EV without electricity is zero. But President Joe
Biden’s Environmental Protection Agency and Department of Transportation are
requiring that 70% of new cars and 25% of new trucks sold in 2032 be electric.
Imagine the state Houston would be in if the number of EVs on the road today
met those standards.” Commentary at...
Commentary:
Houston storm shows downside of forced electrification (msn.com)
“The US Federal Communications Commission (FCC) is
seeking to impose a hefty $6 million fine on a political consultant responsible
for creating and distributing a fake election campaign call that used a
convincingly real-sounding voice of President Joe Biden. The automated call,
which targeted voters in New Hampshire, urged them to abstain from
participating in the Democratic Party's primary election.”
Biden
Call Faked: Creator Faces Million-Dollar Fine (msn.com)
My cmt: It is a felony to tamper with one vote in an
election. This sort of election
interference cannot be tolerated from either party.
DURABLES (Breakingthenews.net)
“The number of durable goods orders in the United States
went up by 0.7% or $1.9 billion in April, landing at $284.1 billion, a report
published by the United States Census Bureau on Friday showed.” Story at...
https://breakingthenews.net/Article/US-durable-goods-orders-up-0.7-in-April/62108800
MARKET REPORT / ANALYSIS
-Friday the S&P 500 rose about 0.7% to 5305.
-VIX fell about 7% to 11.92.
-The yield on the 10-year Treasury declined to 4.467%.
MY TRADING POSITIONS:
UWM – Added 5/2/2024
QLD – Added 4/29/2024
SSO – Added 4/29/2024.
XLE – Added 4/24/2024
CRM – Added 1/22/2024.
XLK – Technology ETF (holding since the October 2022
lows). I don’t want to pay taxes on this gain, so I am holding this position.
DWCPF - Dow Jones U.S. Completion Total Stock Market
Index. – Added 12/7/2023 when I sold the S&P 500.
“The Dow Jones U.S. Completion Total Stock Market Index,
also known as the DWCPF, is a widely used financial index that provides a
comprehensive measure of the US equity market. The DWCPF includes all US stocks
that are not included in the Dow Jones US Total Stock Market Index, which
comprises large-cap and mid-cap companies. As a result, the DWCPF provides a
complete picture of the US stock market, including small-cap and micro-cap
companies, which are often overlooked by other indexes.” From...
https://fi.money/blog/posts/what-is-dow-jones-u-s-completion-total-stock-market-index-dwcpf
CURRENT SUMMARY OF APPROXIMATELY 50 INDICATORS:
The Bull/Bear Spread (Bull Indicators minus Bear
Indicators) moved in a bullish direction, but should be considered neutral at 11
Bear-signs and 10-Bull. (The rest are neutral. It is normal to have a lot of
neutral indicators since many of those are top or bottom indicators that will
signal only at extremes.) The 10-dMA of spread (purple line in the chart below)
was down again today and that is still a bearish sign.
TODAY’S COMMENT:
The 10-dMA of Breadth bounced back above 50% signaling
that more than half of the issues on the NYSE have been up over the last 10-days. Below 50% is the first sign of possible real
trouble, so this is trouble avoided. Let’s hope it stays that way.
The Hindenburg Omen improved and is not giving a signal
today, however, the Omen remains in place until the McClellan Oscillator turns
positive. The Oscillator is still
negative, so the Hindenburg warning remains in place. As we noted yesterday,
neither the long-term or short-term Fosback Hi/Low Logic indicators are
bearish. They are both closer to giving
bullish indications. Those indicators also look at the number of new-highs and
new-lows in a somewhat similar style of analysis as the Hindenburg Omen
indicator. It is well known that the Hindenburg is not always right. The last time we saw an Omen (actually 3 in a
row) was in February and the market ignored it.
I think the weakness may be over, the decline stopped
where we would expect it, but rather than going with what I think, I’ll wait
and see what the indicators say next week.
LONG-TERM INDICATOR: The Long Term NTSM indicator
remained HOLD: PRICE is bullish; VOLUME, VIX & SENTIMENT are neutral.
(The Long-Term Indicator is not a good top-indicator. It
can signal BUY at a top.)
(The important major BUY in this indicator was on 21
October 2022, 7-days after the bear-market bottom. For my NTSM overall signal,
I suggested that a short-term buying opportunity occurred on 27 September
(based on improved market internals on the retest), although without market
follow-thru, I was unwilling to call a buy; however, I did close shorts and
increased stock holdings. I issued a Buy-Signal on 4 October, 6-days before the
final bottom, based on stronger market action that confirmed the market internals
signal. The NTSM sell-signal was issued 21 December, 9 sessions before the high
of this recent bear market, based on the bearish “Friday Rundown” of
indicators.)
BOTTOM LINE
I remain cautiously bullish.
ETF - MOMENTUM ANALYSIS:
TODAY’S RANKING OF 15 ETFs (Ranked Daily) ETF ranking
follows:
The top ranked ETF receives
100%. The rest are then ranked based on their momentum relative to the leading
ETF.
*For additional background on
the ETF ranking system see NTSM Page at…
http://navigatethestockmarket.blogspot.com/p/exchange-traded-funds-etf-ranking.html
DOW STOCKS - TODAY’S MOMENTUM RANKING
OF THE DOW 30 STOCKS (Ranked Daily)
The top ranked Stock receives
100%. The rest are then ranked based on their momentum relative to the leading Stock.
For more details, see NTSM
Page at…
https://navigatethestockmarket.blogspot.com/p/a-system-for-trading-dow-30-stocks-my_8.html
FRIDAY MARKET INTERNALS (NYSE
DATA)
My basket of Market Internals improved to HOLD. (My basket of Market
Internals is a decent trend-following analysis of current market action, but
should not be used alone for short term trading. They are most useful when they
diverge from the Index.)
...My current invested
position is about 75% stocks, including stock mutual funds and ETFs. I’m
usually about 50% invested in stocks, so this is a bullish, over-invested
position. This is my max % for stock allocation.
I trade about 15-20% of the total portfolio using the
momentum-based analysis I provide here. When I see a definitive bottom, I add a
lot more stocks to the portfolio, usually by using an S&P 500 ETF as I did
back in October 2022 and 2023.
“Trade what you see; not what you think.” – The Old Fool,
Richard McCranie, trader extraordinaire.
“Far
more money has been lost by investors in preparing for corrections, or
anticipating corrections, than has been lost in the corrections themselves.” -
Peter Lynch, former manager of Fidelity’s Magellan® fund.
BIDEN’S MOREHOUSE SPEECH WAS A FAREWELL (CNN via msn)
“...The shortcomings of the president’s speech highlight
the broader set of problems he’s having with Black voters as revealed
consistently by the polls...
...the Morehouse crowd, at least, understood that no
matter how much Biden talks about his proximity to HBCU graduates and having
worked with President Barack Obama and Vice President Kamala Harris, his
policies have yet to fully meet their expectations, and while some may argue
that a little progress is better than no progress at all, it begs the question
for many of how long they should accept minimal change when the needs are far
greater. Democrats dismissing Biden’s bad poll numbers showcases the disconnect
between wealthy Washington elites whose hubris does not allow them to
understand the very real and salient experiences of many working-class Black
people who feel disillusioned and often forgotten by a political class that
only shows up when it’s time to vote.
Democrats are frankly delusional if they think they can
take these voters’ sentiments for granted. There’s a strong chance they will
not vote for Biden at the same level they did in 2020...
...The speech was more a farewell from a past ally than
an invitation to a new vision for a prosperous future. Biden is in the
valley as Black voters led by young men abandon him, even while
speaking from a red clay hill.” - Shermichael Singleton, CNN political
commentator and Morehouse graduate.
Commentary at...
Opinion:
Biden’s Morehouse address was a farewell speech (msn.com)
NEW HOME SALES (Reuters)
“Sales of new U.S. single-family homes fell more than
expected in April amid a resurgence in mortgage rates and higher prices,
further evidence that the housing market was losing momentum in the second
quarter. New home sales dropped 4.7%...” Story at...
https://www.reuters.com/markets/us/us-new-home-sales-fall-april-prices-rise-year-ago-2024-05-23/
JOBLESS CLAIMS (Yahoo Finance)
“Again the numbers are well-behaved, coming in at 215K
last week, below the 220K expected and the slightly upwardly revised 223K from
the previous week. This 215K figure is the lightest we’ve seen in a month...”
https://finance.yahoo.com/news/jobless-claims-decreased-more-expected-145300340.html
MARKET REPORT / ANALYSIS
-Thursday the S&P 500 declined about 0.7% to 5268.
-VIX rose about 4% to 12.77.
-The yield on the 10-year Treasury rose to 4.479%.
MY TRADING POSITIONS:
UWM – Added 5/2/2024
QLD – Added 4/29/2024
SSO – Added 4/29/2024.
XLE – Added 4/24/2024
CRM – Added 1/22/2024.
XLK – Technology ETF (holding since the October 2022
lows). I don’t want to pay taxes on this gain, so I am holding this position.
DWCPF - Dow Jones U.S. Completion Total Stock Market
Index. – Added 12/7/2023 when I sold the S&P 500.
“The Dow Jones U.S. Completion Total Stock Market Index,
also known as the DWCPF, is a widely used financial index that provides a
comprehensive measure of the US equity market. The DWCPF includes all US stocks
that are not included in the Dow Jones US Total Stock Market Index, which
comprises large-cap and mid-cap companies. As a result, the DWCPF provides a
complete picture of the US stock market, including small-cap and micro-cap
companies, which are often overlooked by other indexes.” From...
https://fi.money/blog/posts/what-is-dow-jones-u-s-completion-total-stock-market-index-dwcpf
CURRENT SUMMARY OF APPROXIMATELY 50 INDICATORS:
The Bull/Bear Spread (Bull Indicators minus Bear
Indicators) continued its slide to the bear-side and switched to bearish (but
close to neutral) at 14 Bear-signs and 9-Bull. (The rest are neutral. It is
normal to have a lot of neutral indicators since many of those are top or
bottom indicators that will signal only at extremes.) The 10-dMA of spread
(purple line in the chart below) was down again today – a bearish sign.
TODAY’S COMMENT:
Nvidia didn’t save the markets from a down-day Thursday
even though it finished the day up over 9%.
Hindenburg Omen
Today there was a Hindenburg Omen. Investopedia says, “The
Hindenburg Omen is a technical
indicator that was designed to signal the increased probability of
a stock market
crash. It compares the percentage of new 52-week highs and new 52-week lows in
stock prices to a predetermined reference percentage that is supposed to
predict the increasing likelihood of a market crash...
The Hindenburg Omen looks for a statistical deviation from the premise that
under normal conditions, some stocks are either making new 52-week highs or new
52-week lows. It would be abnormal if both were occurring at the same time.”
From Investopedia at...
https://www.investopedia.com/terms/h/hindenburgomen.asp
Neither the long-term or short-term Fosback Hi/Low Logic
indicators are bearish. They are both
closer to giving bullish indications. Those indicators also look at the number
of new-highs and new-lows in a somewhat similar style of analysis as the
Hindenburg Omen indicator. It is well known that the Hindenburg is not always
right. The last time we saw an Omen (actually
3 in a row) was in February and the market ignored it.
10-dMA of Breadth dropped below 50% signaling that less
than half of the issues on the NYSE have been up over the last 10-days. That’s the first sign of possible real trouble.
There are no top-signs today so if there is a correction,
it won’t be from overly exuberant market action.
As noted yesterday, the S&P 500 is 1.9 % above its
50-dMA. That usually tracks the lower
trend line so a fall to the current 50-dMA of 5170 would be perfectly normal.
The S&P 500 just completed a 10% correction on 19 April so it seems
unlikely that the markets would experience another significant correction so
soon, but it is not impossible.
On a more positive note, Thursday was a statistically
significant down-day. That just means that the price-volume move exceeded my
statistical parameters. Statistics show that a statistically-significant,
down-day is followed by an up-day about 60% of the time. Bottoms occur on
statistically-significant, down-days, since they tend to be flush out days that
shake out weak hands; but not all statistically-significant, down-days are
bottoms.
LONG-TERM INDICATOR: The Long Term NTSM indicator remained
HOLD: PRICE is bullish; VOLUME, VIX & SENTIMENT are neutral.
(The Long-Term Indicator is not a good top-indicator. It
can signal BUY at a top.)
(The important major BUY in this indicator was on 21
October 2022, 7-days after the bear-market bottom. For my NTSM overall signal,
I suggested that a short-term buying opportunity occurred on 27 September
(based on improved market internals on the retest), although without market
follow-thru, I was unwilling to call a buy; however, I did close shorts and
increased stock holdings. I issued a Buy-Signal on 4 October, 6-days before the
final bottom, based on stronger market action that confirmed the market internals
signal. The NTSM sell-signal was issued 21 December, 9 sessions before the high
of this recent bear market, based on the bearish “Friday Rundown” of
indicators.)
BOTTOM LINE
I am cautiously bullish.
ETF - MOMENTUM ANALYSIS:
TODAY’S RANKING OF 15 ETFs (Ranked Daily) ETF ranking
follows:
The top ranked ETF receives
100%. The rest are then ranked based on their momentum relative to the leading
ETF.
*For additional background on
the ETF ranking system see NTSM Page at…
http://navigatethestockmarket.blogspot.com/p/exchange-traded-funds-etf-ranking.html
DOW STOCKS - TODAY’S MOMENTUM RANKING
OF THE DOW 30 STOCKS (Ranked Daily)
The top ranked Stock receives
100%. The rest are then ranked based on their momentum relative to the leading Stock.
For more details, see NTSM
Page at…
https://navigatethestockmarket.blogspot.com/p/a-system-for-trading-dow-30-stocks-my_8.html
THURSDAY MARKET INTERNALS (NYSE
DATA)
My basket of Market Internals declined to SELL. (My basket of Market
Internals is a decent trend-following analysis of current market action, but
should not be used alone for short term trading. They are most useful when they
diverge from the Index.)
...My current invested
position is about 75% stocks, including stock mutual funds and ETFs. I’m
usually about 50% invested in stocks, so this is a bullish, over-invested
position. This is my max % for stock allocation.
I trade about 15-20% of the total portfolio using the
momentum-based analysis I provide here. When I see a definitive bottom, I add a
lot more stocks to the portfolio, usually by using an S&P 500 ETF as I did
back in October 2022 and 2023.
“Trade what you see; not what you think.” – The Old Fool,
Richard McCranie, trader extraordinaire.
“Far more
money has been lost by investors in preparing for corrections, or anticipating
corrections, than has been lost in the corrections themselves.” -
Peter Lynch, former manager of Fidelity’s Magellan® fund.
"Today in Georgia, they won't allow water to be
available to you while you wait in line to vote in an election," Biden
told the graduating class at Morehouse College, a historically Black university
in Atlanta, over the weekend. "What in the hell is that all about?"
..."It’s obviously a factually false
statement," Heritage Foundation senior legal fellow Zack Smith told Fox
News Digital. "Every state bans electioneering near polling
places. Prohibiting giving money and gifts to potential voters – as Georgia
election law does – to prevent unduly influencing them as they wait to vote is
a good and reasonable policy." – Story at...
Biden
blasted by experts for repeating 'debunked lie' to Black students at HBCU
graduation: 'Factually false' (msn.com)
My cmt: Biden’s home state of Delaware has a similar
rule. In Virginia, “it is unlawful for any person (i) to loiter or congregate
within 40 feet of any entrance of any polling place; (ii) within such distance
to give, tender, or exhibit any ballot, ticket, or other campaign material to
any person or to solicit or in any manner attempt to influence any person in
casting his vote...”
FED MINUTES (CNBC)
“Federal Reserve officials grew more concerned at their
most recent meeting about inflation, with members indicating that they lacked
the confidence to move forward on interest rate reductions... The minutes also
showed “various participants mentioned a willingness to tighten policy further
should risks to inflation materialize in a way that such an action became
appropriate.” Story at...
https://www.cnbc.com/2024/05/22/fed-minutes-may-2024-.html
EXISTING HOME SALES (ABC News)
"Existing home sales fell 1.9% to a seasonally adjusted
annual rate of 4.14 million in April...” Story at...
https://abcnews.go.com/Business/wireStory/us-existing-home-sales-drop-19-april-pushed-110466713
CRUDE INVENTORIES (EIA)
“U.S. commercial crude oil inventories (excluding those
in the Strategic Petroleum Reserve) increased by 1.8 million barrels from the
previous week. At 458.8 million barrels, U.S. crude oil inventories are about
3% below the five year average for this time of year.” Report at...
https://ir.eia.gov/wpsr/wpsrsummary.pdf
MARKET REPORT / ANALYSIS
-Wednesday the S&P 500 declined about 0.3% to 5307.
-VIX rose about 3% to 12.22.
-The yield on the 10-year Treasury rose to 4.426%.
MY TRADING POSITIONS:
UWM – Added 5/2/2024
QLD – Added 4/29/2024
SSO – Added 4/29/2024.
XLE – Added 4/24/2024
CRM – Added 1/22/2024.
XLK – Technology ETF (holding since the October 2022
lows). I don’t want to pay taxes on this gain, so I am holding this position.
DWCPF - Dow Jones U.S. Completion Total Stock Market
Index. – Added 12/7/2023 when I sold the S&P 500.
“The Dow Jones U.S. Completion Total Stock Market Index,
also known as the DWCPF, is a widely used financial index that provides a
comprehensive measure of the US equity market. The DWCPF includes all US stocks
that are not included in the Dow Jones US Total Stock Market Index, which
comprises large-cap and mid-cap companies. As a result, the DWCPF provides a
complete picture of the US stock market, including small-cap and micro-cap
companies, which are often overlooked by other indexes.” From...
https://fi.money/blog/posts/what-is-dow-jones-u-s-completion-total-stock-market-index-dwcpf
CURRENT SUMMARY OF APPROXIMATELY 50 INDICATORS:
The Bull/Bear Spread (Bull Indicators minus Bear
Indicators) continued its slide to the bear-side and switched to bearish (but
close to neutral) at 13 Bear-signs and 10-Bull. (The rest are neutral. It is
normal to have a lot of neutral indicators since many of those are top or
bottom indicators that will signal only at extremes.) The 10-dMA of spread
(purple line in the chart below) was down again today.
TODAY’S COMMENT:
CNBC wrote today that “Troubling
market internals warrant buying some portfolio protection.” Most of my
indicators are based on market internals and we can certainly see that indicators
are deteriorating and have now turned bearish. The catch is that I know of very
few ways to predict the amount of decline that may occur. The S&P 500 is 2.5
% above its 50-dMA. That usually tracks
the lower trend line so a fall to the current 50-dMA of 5167 would be perfectly
normal. The S&P 500 just completed a 10% correction on 19 April so it seems
unlikely that the markets would experience another significant correction so
soon.
Many on CNBC have suggested the recent market weakness
has been due to concern over Nvidia’s earnings announcement today. If so, there was nothing to worry about. Today,
Nvidia reported a sales increase of 262%. Nvidia was up about 6% around 5:30pm
in afterhours trading.
While indicators have slipped, Breadth indicators are all
bullish. (Even the Breadth vs the S&P 500 indicator is close to issuing a
buy signal.) The market still looks OK to me.
LONG-TERM INDICATOR: The Long Term NTSM indicator declined
to HOLD: PRICE is bullish; VOLUME, VIX & SENTIMENT are neutral.
(The Long-Term Indicator is not a good top-indicator. It
can signal BUY at a top.)
(The important major BUY in this indicator was on 21
October 2022, 7-days after the bear-market bottom. For my NTSM overall signal,
I suggested that a short-term buying opportunity occurred on 27 September
(based on improved market internals on the retest), although without market
follow-thru, I was unwilling to call a buy; however, I did close shorts and
increased stock holdings. I issued a Buy-Signal on 4 October, 6-days before the
final bottom, based on stronger market action that confirmed the market internals
signal. The NTSM sell-signal was issued 21 December, 9 sessions before the high
of this recent bear market, based on the bearish “Friday Rundown” of
indicators.)
BOTTOM LINE
I am bullish.
ETF - MOMENTUM ANALYSIS:
TODAY’S RANKING OF 15 ETFs (Ranked Daily) ETF ranking
follows:
The top ranked ETF receives
100%. The rest are then ranked based on their momentum relative to the leading
ETF.
*For additional background on
the ETF ranking system see NTSM Page at…
http://navigatethestockmarket.blogspot.com/p/exchange-traded-funds-etf-ranking.html
DOW STOCKS - TODAY’S MOMENTUM RANKING
OF THE DOW 30 STOCKS (Ranked Daily)
The top ranked Stock receives
100%. The rest are then ranked based on their momentum relative to the leading Stock.
For more details, see NTSM
Page at…
https://navigatethestockmarket.blogspot.com/p/a-system-for-trading-dow-30-stocks-my_8.html
WEDNESDAY MARKET INTERNALS
(NYSE DATA)
My basket of Market Internals remained HOLD. (My basket of Market
Internals is a decent trend-following analysis of current market action, but
should not be used alone for short term trading. They are most useful when they
diverge from the Index.)
...My current invested
position is about 75% stocks, including stock mutual funds and ETFs. I’m
usually about 50% invested in stocks, so this is a bullish, over-invested
position. This is my max % for stock allocation.
I trade about 15-20% of the total portfolio using the
momentum-based analysis I provide here. When I see a definitive bottom, I add a
lot more stocks to the portfolio, usually by using an S&P 500 ETF as I did
back in October 2022 and 2023.