Friday, November 30, 2018

Chicago PMI … Correction Over … Stock Market Analysis… ETF Trading … Dow 30 Ranking

CHICAGO PMI (Investing.com)
“Manufacturing activity in the Chicago-area accelerated in November to a four-and-a-half year high as new orders and production boosted confidence, although the study noted concerns over labor issues and Chinese tariffs. In a report, the Institute for Supply Management (ISM) said its Chicago purchasing managers’ index rose to a seasonally adjusted 66.4 this month, from 58.4 in October.” Story at…
 
MARKET REPORT / ANALYSIS         
-Friday the S&P 500 rose about 0.8% to 2760.
-VIX dropped about 4% to 18.07.
-The yield on the 10-year Treasury dipped to 3.003% as of 4:11pm. 
 
Correction Over:
Thursday’s headlines said “Fed chairman’s comments send market soaring.” Perhaps, but the spread between new-highs and new-lows showed a huge bullish positive swing a week before the Fed chair speech and we noted then that the correction was nearly over. We saw a positive test of the prior low on the Friday before the Fed speech. Following the retest, Monday, stock markets were up bigley (1.6%).  They were up again Tuesday. On Wednesday they were having a big day before the Fed speech and jumped farther after the speech. Wednesday was very positive and was a 90% up-volume day.
 
Regarding 90% up-volume days, one of the oldest stock market advisor groups, Lowry Research, noted the following: “In approximately half the cases in the past 69 years, the 90% Upside Day…which signaled a major market reversal, occurred within five trading days or less of the market low.” This time the reversal was 3-trading sessions after the low. The S&P 500 is up nearly 5% since the Friday successful re-test. I am simply pointing out that the media’s continual reporting of why the market moves up or down is probably wrong and rather pointless. I don’t care.  The market action since last Friday’s retest tends to confirm the correction is over - that’s what we care about.
 
My daily sum of 17 Indicators improved from +3 to +5 (a positive number is bullish; negatives are bearish) while the 10-day smoothed version that negates the daily fluctuations rose from -53 to -41.
 
It is still possible that we could see a retest of the 2633 low, but it is not likely that the S&P 500 would drop significantly farther than the prior low. It could fall farther – it’s just not very likely.
 
There are, of course, news events that could upset the apple cart – all we have to do is to hear Trump’s tariff tweets repeated on the national news – so let’s hope all is quiet on the tariff front. Impeachment? Who knows, some might see it as a positive.
 
As of Tuesday, I went from 30% invested in stocks to fully invested in stocks plus about 10% extra since I think we made a bottom last Friday.
 
In summary, still - “Looking good Billy Ray! Feeling good Lewis!”
 
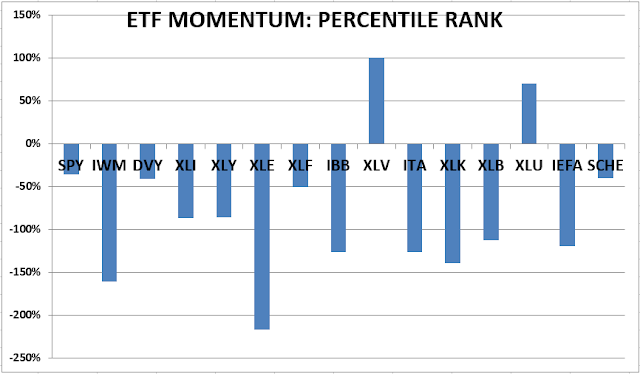
MOMENTUM ANALYSIS:
(Momentum analysis is suspect in a selloff, but since we are coming off the bottom (I think) we might begin to use this data again. I‘d be careful though – the only reason utilities are highly ranked among ETFs is as an alternative to stocks in the correction.) 
TODAY’S RANKING OF  15 ETFs (Ranked Daily)
The top ranked ETF receives 100%. The rest are then ranked based on their momentum relative to the leading ETF.  While momentum isn’t stock performance per se, momentum is closely related to stock performance. For example, over the 4-months from Oct thru mid-February 2016, the number 1 ranked Financials (XLF) outperformed the S&P 500 by nearly 20%. In 2017 Technology (XLK) was ranked in the top 3 Momentum Plays for 52% of all trading days in 2017 (if I counted correctly.) XLK was up 35% on the year while the S&P 500 was up 18%.
*For additional background on the ETF ranking system see NTSM Page at…
 
TODAY’S RANKING OF THE DOW 30 STOCKS (Ranked Daily)
The top ranked stock receives 100%. The rest are then ranked based on their momentum relative to the leading stock.
*I rank the Dow 30 similarly to the ETF ranking system. For more details, see NTSM Page at…
 
FRIDAY MARKET INTERNALS (NYSE DATA)
Market Internals remained Neutral on the market, but they were almost positive.
Market Internals are a decent trend-following analysis of current market action but should not be used alone for short term trading. They are usually right, but they are often late.  They are most useful when they diverge from the Index.  In 2014, using these internals alone would have made a 9% return vs. 13% for the S&P 500 (in on Positive, out on Negative – no shorting). 
 
I am increasing stock allocations to 60% invested in stocks Tuesday. For me, fully invested is a balanced 50% stock portfolio so this is slightly higher. I will cut back to 50% if/when we reach the old highs depending on indicators.
 
INTERMEDIATE / LONG-TERM INDICATOR
Friday, the Price indicator was positive; Volume and Sentiment indicators were neutral; the VIX indicator was negative. Overall this is a NEUTRAL indication, but improvements to the numbers do support the belief that the bottom was Friday, 23 November.
Thursday, November 29, 2018

FOMC Minutes … Personal Income / Personal Spending … PCE Prices / Inflation … Jobless Claims … Stock Market Analysis… ETF Trading … Dow 30 Ranking

FOMC MINUTES (Reuters)
"U.S. central bankers discussed raising interest rates soon to counter excessive economic strength but also examined how global trade disputes could batter businesses and households, minutes of the Federal Reserve’s last policy meeting showed on Wednesday. A Key Point: MANY PARTICIPANTS SAID IT WOULD LIKELY “SOON” BE APPROPRIATE TO RAISE INTEREST RATES [their caps].” Story at…
 
PERSONAL INCOME / SPENDING (Nasdaq.com)
“Personal income and spending in the U.S. both increased by more than anticipated in the month of October, according to a report released by the Commerce Department on Thursday.” Story at…
 
PCE PRICES (MarketWatch)
“Inflationary pressures, meanwhile, did not move the needle. The 12-month rate of inflation was flat at 2%, as measured by Federal Reserve’s preferred PCE gauge.” Story at…
 
JOBLESS CLAIMS (Bloomberg)
“Filings for U.S. unemployment benefits rose for a third week to the highest level since May, potentially reflecting volatility around two consecutive periods that included holidays. Jobless claims increased by 10,000 to 234,000 in the week ended Nov. 24, Labor Department figures showed Thursday.” Story at at…
 
MARKET REPORT / ANALYSIS         
-Thursday the S&P 500 slipped about 0.2% to 2738.
-VIX rose about 2% to 18.79.
-The yield on the 10-year Treasury dipped to 3.029% as of 4:32pm. 
 
My daily sum of 17 Indicators improved from +1 to +3 (a positive number is bullish; negatives are bearish) while the 10-day smoothed version that negates the daily fluctuations rose from -61 to -53.
 
I noticed that yesterday’s up-volume was very high and thus close enough to trigger a bullish high up-volume signal.  This cancels the bearish, low up-volume signal that we saw on 10 October as the correction got under way. This is another decent confirmation of the “correction over” call I made previously.  It is still possible that we could see a retest of the 2633 low, but it is not likely that the S&P 500 would drop significantly farther than the prior low. It could fall farther – it’s just not very likely.
 
There are, of course, news events that could upset the apple cart – all we have to do is to hear Trump’s tariff tweets repeated on the national news – so let’s hope all is quiet on the tariff front.
 
As of Tuesday, I went from 30% invested in stocks to fully invested in stocks plus about 10% extra since I think we made a bottom last Friday.
 
In summary: “Looking good Billy Ray! Feeling good Lewis!”
 
MOMENTUM ANALYSIS:
(Momentum analysis is not useful in a selloff, but since we are coming off the bottom (I think) we may begin to use this data again.) 
TODAY’S RANKING OF  15 ETFs (Ranked Daily)
The top ranked ETF receives 100%. The rest are then ranked based on their momentum relative to the leading ETF.  While momentum isn’t stock performance per se, momentum is closely related to stock performance. For example, over the 4-months from Oct thru mid-February 2016, the number 1 ranked Financials (XLF) outperformed the S&P 500 by nearly 20%. In 2017 Technology (XLK) was ranked in the top 3 Momentum Plays for 52% of all trading days in 2017 (if I counted correctly.) XLK was up 35% on the year while the S&P 500 was up 18%.
*For additional background on the ETF ranking system see NTSM Page at…
 
TODAY’S RANKING OF THE DOW 30 STOCKS (Ranked Daily)
The top ranked stock receives 100%. The rest are then ranked based on their momentum relative to the leading stock.
*I rank the Dow 30 similarly to the ETF ranking system. For more details, see NTSM Page at…
 
THURSDAY MARKET INTERNALS (NYSE DATA)
Market Internals remained Neutral on the market, but they were almost positive.
Market Internals are a decent trend-following analysis of current market action but should not be used alone for short term trading. They are usually right, but they are often late.  They are most useful when they diverge from the Index.  In 2014, using these internals alone would have made a 9% return vs. 13% for the S&P 500 (in on Positive, out on Negative – no shorting). 
 
I am increasing stock allocations to 60% invested in stocks Tuesday. For me, fully invested is a balanced 50% stock portfolio so this is slightly higher. I will cut back to 50% if/when we reach the old highs depending on indicators.
 
INTERMEDIATE / LONG-TERM INDICATOR
Thursday, the Price indicator was positive; Volume and Sentiment indicators were neutral; the VIX indicator was negative. Overall this is a NEUTRAL indication, but improvements to the numbers do support the belief that the bottom was Friday.

Wednesday, November 28, 2018

GDP … New Home Sales … Crude Inventories … Stock Market Analysis… Correction Over … ETF Trading … Dow 30 Ranking

GDP (Reuters)
“The U.S. economy slowed in the third quarter as previously reported…Gross domestic product increased at a 3.5 percent annualized rate, the Commerce Department said on Wednesday in its second estimate of third-quarter GDP growth.” Story at…
 
NEW HOME SALES (BondBuyer)
“Sales of new U.S. homes fell in October to the weakest pace since March 2016 as rising borrowing costs and elevated prices keep buyers out of the market.
Single-family home sales fell 8.9% from the prior month to a 544,000 annualized pace…” Story at…
 
CRUDE INVENTORIES (OilPrice.com)
“Crude oil prices slipped further down today after the Energy Information Administration reported crude oil inventories for the week to November 23 had added 3.6 million barrels. That’s compared with a build of 4.9 million barrels a week earlier.” Story at…
 
MARKET REPORT / ANALYSIS         
-Wednesday the S&P 500 rose about 2.3% to 2744.
-VIX dipped about 3% to 18.49.
-The yield on the 10-year Treasury dipped to 3.035%. 
 
Correction Over: Based on the new-high/new-low reversal that occurred Wednesday of last week and better market data at the Friday low (compared to the prior low), we have a more bullish stance on the market. Since the Friday bottom, we’ve seen 3 straight days of late-day buying when the Pros are active; the S&P 500 is up over 4% in 3-days; improving indicators; falling utilities; improving new-highs; and other signs that tend to confirm that Friday was the bottom of this correction.
 
As of Tuesday, I went from 30% invested in stocks to fully invested in stocks plus about 10% extra since I think we made a bottom last Friday.
 
Today (Wednesday) was a statistically-significant, up-day.  That just means that the price-volume move up exceeded statistical parameters that I track. The stats show that about 60% of the time a statistically significant move up will be followed by a down-day the next day.
 
My daily sum of 17 Indicators improved from -5 to zero (a positive number is bullish; negatives are bearish) while the 10-day smoothed version that negates the daily fluctuations slipped from -61 to -62.
 
In summary: “Looking good Billy Ray! Feeling good Lewis!”
 
MOMENTUM ANALYSIS:
(Momentum analysis is not useful in a selloff, but since we are coming off the bottom (I think) we may begin to use this data again.) 
TODAY’S RANKING OF  15 ETFs (Ranked Daily)
The top ranked ETF receives 100%. The rest are then ranked based on their momentum relative to the leading ETF.  While momentum isn’t stock performance per se, momentum is closely related to stock performance. For example, over the 4-months from Oct thru mid-February 2016, the number 1 ranked Financials (XLF) outperformed the S&P 500 by nearly 20%. In 2017 Technology (XLK) was ranked in the top 3 Momentum Plays for 52% of all trading days in 2017 (if I counted correctly.) XLK was up 35% on the year while the S&P 500 was up 18%.
*For additional background on the ETF ranking system see NTSM Page at…
 
TODAY’S RANKING OF THE DOW 30 STOCKS (Ranked Daily)
The top ranked stock receives 100%. The rest are then ranked based on their momentum relative to the leading stock.
*I rank the Dow 30 similarly to the ETF ranking system. For more details, see NTSM Page at…
 
WEDNESDAY MARKET INTERNALS (NYSE DATA)
Market Internals remained Neutral on the market, but improvements to the numbers do support the belief that the bottom was Friday.
Market Internals are a decent trend-following analysis of current market action but should not be used alone for short term trading. They are usually right, but they are often late.  They are most useful when they diverge from the Index.  In 2014, using these internals alone would have made a 9% return vs. 13% for the S&P 500 (in on Positive, out on Negative – no shorting). 
 
I am increasing stock allocations to 60% invested in stocks Tuesday. For me, fully invested is a balanced 50% stock portfolio so this is slightly higher. I will cut back to 50% if/when we reach the old highs depending on indicators.
 
INTERMEDIATE / LONG-TERM INDICATOR
Wednesday, the Price indicator was positive; Volume and Sentiment indicators were neutral; the VIX indicators were negative. Overall this is a NEUTRAL indication, but improvements to the numbers do support the belief that the bottom was Friday.

Tuesday, November 27, 2018

Chicago FED National Activity Index … Consumer Confidence … Stock Market Analysis… ETF Trading … Dow 30 Ranking

CHICAGO FED NATIONAL ACTIVITY INDEX (Chicago FED)
“Led by improvements in employment-related indicators, the Chicago Fed National Activity Index (CFNAI) increased to +0.24 in October from +0.14 in September. Only one of the four broad categories of indicators that make up the index increased from September, but three of the four categories made positive contributions to the index in October. The index’s three-month moving average, CFNAI-MA3, ticked up to +0.31 in October from +0.30 in September.” Press release at…
 
CONSUMER CONFIDENCE (Bloomberg)
“U.S. consumer confidence fell in November for the first time in five months, cooling from an 18-year high, as optimism dimmed for business conditions and incomes.” Story at…
My cmt: Nothing like a stock market correction to make consumer confidence drop.
 
MARKET REPORT / ANALYSIS         
-Tuesday the S&P 500 rose about 0.3% to 2682.
-VIX rose about 0.6% to 19.02.
-The yield on the 10-year Treasury was up to 3.062%. 
 
Based on the new-high/new-low reversal that occurred Wednesday of last week, we now have a more bullish stance on the market. Charts and internals are improving too. This all suggests that Friday was the bottom of this correction (or close to it). Today, nothing is different that would change my mind.
 
I am now at fully invested position plus about 10% extra invested since I think we made a bottom last Friday.
 
MOMENTUM ANALYSIS:
(Momentum analysis is not useful in a selloff.) 
 
TODAY’S RANKING OF  15 ETFs (Ranked Daily)
The top ranked ETF receives 100%. The rest are then ranked based on their momentum relative to the leading ETF.  While momentum isn’t stock performance per se, momentum is closely related to stock performance. For example, over the 4-months from Oct thru mid-February 2016, the number 1 ranked Financials (XLF) outperformed the S&P 500 by nearly 20%. In 2017 Technology (XLK) was ranked in the top 3 Momentum Plays for 52% of all trading days in 2017 (if I counted correctly.) XLK was up 35% on the year while the S&P 500 was up 18%.
*For additional background on the ETF ranking system see NTSM Page at…
 
TODAY’S RANKING OF THE DOW 30 STOCKS (Ranked Daily)
The top ranked stock receives 100%. The rest are then ranked based on their momentum relative to the leading stock.
*I rank the Dow 30 similarly to the ETF ranking system. For more details, see NTSM Page at…
 
TUESDAY MARKET INTERNALS (NYSE DATA)
Market Internals remained Neutral on the market.
Market Internals are a decent trend-following analysis of current market action but should not be used alone for short term trading. They are usually right, but they are often late.  They are most useful when they diverge from the Index.  In 2014, using these internals alone would have made a 9% return vs. 13% for the S&P 500 (in on Positive, out on Negative – no shorting). 
 
I am increasing to 60% invested in stocks Tuesday. For me, fully invested is a balanced 50% stock portfolio so this is slightly higher. I will cut back to 50% if/when we reach the old highs.
 
INTERMEDIATE / LONG-TERM INDICATOR
Tuesday, the Price indicator was positive; Volume and Sentiment indicators were neutral; the VIX indicators were negative. Overall this is a NEUTRAL indication. This indicator is slow to turn so it is not a concern that it is only neutral.

The Worst Place for Bond Investors … Jeffrey Saut Commentary Excerpt … Stock Market Analysis… ETF Trading … Dow 30 Ranking

THE WORST PLACE FOR BOND INVESTORS (Real Investment Advice)
“Last week, Jeffrey Gundlach of DoubleLine Funds did a webcast where he noted, among other things, that investment grade corporate bonds are terrible. There is no way to win with them, he said. As much as half the investment grade universe could be downgraded to junk…Interestingly, it’s not that investment grade companies are ready to default…It’s that the starting yield on investment grade corporates is so low that there is a lot of duration risk in them. That risk reflects how soon or long it takes for an investor to receive their money back in interest and principal payments.” Commentary at…
 
JEFFREY SAUT EXCERPT (Raymond James)
“It is stunning to us at this stage of a secular bull market, and a very bullish chart pattern, that so many pundits are scared to death! We have long targeted mid-November as a turning point for the various markets for a variety of reasons often mentioned in these missives.” Commentary at…
My cmt: I was in St. Petersburg, Florida for a family event over Thanksgiving. While waiting for a to-go order in the restaurant of the hotel where we were staying, I struck up a conversation with a nice gentleman. Turns out, it was Jeffrey Saut, Chief Investment Strategist of Raymond James. As a stock market junkie, I am a big fan of his and regular readers know that we quote from his Weekly Commentaries with some regularity. He said there are a number of CNBC regulars who live in the St Petersburg area including Liz Ann Sonders, Sam Stovall and Ned Beatty (Ned Beatty Research). My wife was unimpressed that I had met a finance celebrity.  She said, “If we were going to meet a celebrity, I would have preferred George Clooney.” To each her own.
 
MARKET REPORT / ANALYSIS         
-Monday the S&P 500 rose about 1.6% to 2673.
-VIX fell about 12% to 18.9.
-The yield on the 10-year Treasury was little changed at 3.057%. 
 
TIME TO BUY
I went back over the weekend and examined Wednesday’s big shift in new-high/new-low data. Over the last 10-years or so, there have only been about 10 New-High/New-Low reversals (big positive changes in the spread between new-highs and new-low that met my statistical test). Nearly every one was at a bottom, or near the bottom of a pullback. The only ones that weren’t were associated with bullish conditions after the 2009 major bottom. 
 
Based on the new-high/new-low reversal that occurred Wednesday and a comparison of Friday’s market data to the most recent low on Tuesday it is time to take a more bullish stance on the market. Charts are improving too.
 
This all suggests that Friday was the bottom of this correction. We’re not sure (we never are really) – but the market reaction Monday supports that conclusion. The timing seems right too.
 
In 2012 there were corrections of 8% and 10% that lasted 42-days.  The 9.9% correction this January took 45-days top to bottom so for length of correction we are certainly in the time-frame that would suggest we’re near the end (or at the end) of the correction. Today was day 46 in this pullback.
 
I am moving back to a fully invested position.
 
MOMENTUM ANALYSIS:
(Momentum analysis is not useful in a selloff.) 
 
TODAY’S RANKING OF  15 ETFs (Ranked Daily)
The top ranked ETF receives 100%. The rest are then ranked based on their momentum relative to the leading ETF.  While momentum isn’t stock performance per se, momentum is closely related to stock performance. For example, over the 4-months from Oct thru mid-February 2016, the number 1 ranked Financials (XLF) outperformed the S&P 500 by nearly 20%. In 2017 Technology (XLK) was ranked in the top 3 Momentum Plays for 52% of all trading days in 2017 (if I counted correctly.) XLK was up 35% on the year while the S&P 500 was up 18%.
*For additional background on the ETF ranking system see NTSM Page at…
 
TODAY’S RANKING OF THE DOW 30 STOCKS (Ranked Daily)
The top ranked stock receives 100%. The rest are then ranked based on their momentum relative to the leading stock.
*I rank the Dow 30 similarly to the ETF ranking system. For more details, see NTSM Page at…
 
MONDAY MARKET INTERNALS (NYSE DATA)
Market Internals improved to Neutral on the market.
Market Internals are a decent trend-following analysis of current market action but should not be used alone for short term trading. They are usually right, but they are often late.  They are most useful when they diverge from the Index.  In 2014, using these internals alone would have made a 9% return vs. 13% for the S&P 500 (in on Positive, out on Negative – no shorting). 
 
I am increasing to 60% invested in stocks Tuesday. For me, fully invested is a balanced 50% stock portfolio so this is slightly higher. I will cut back to 50% if/when we reach the old highs.
 
INTERMEDIATE / LONG-TERM INDICATOR
Monday, the Price indicator was positive; the Sentiment indicator was neutral; the Volume and VIX indicators were negative. Overall this remains a NEGATIVE indication, but chart and market analysis over rules this indicator.  It can be slow to turn.

Saturday, November 24, 2018

Stock Market Long-Term Momentum Has Turned Negative … Stock Market Analysis… ETF Trading … Dow 30 Ranking

NEGATIVE MOMENTUM (Financial Sense)
“Though seasonality favors a year-end rally, with the long-term MACD (a monthly trend/momentum indicator) for the S&P 500 now making a bearish crossover, this lowers the probability of a quick rebound to higher highs above the October 3rd peak. More than likely, we are setting up for volatile sideways trading or further downside should fundamentals deteriorate.” – Chris Sheridan. Commentary at…
 
MARKET REPORT / ANALYSIS         
-Friday the S&P 500 dropped about 0.7% to 2633.
-VIX rose about 3% to 21.52.
-The yield on the 10-year Treasury was little changed at 3.040%. 
 
Volume was less than half of the monthly average today as is to be expected for Black Friday.
 
Correction Update:
The S&P 500 made a new low in this correction Friday.  Volume was low, but we can infer it was low due to the Holiday and not reduced selling pressure. Only 31% of the volume was up-volume today. At the prior low 40% of the volume was up-volume so we are inclined to conclude that there was more selling pressure today than at the prior low, albeit on much lower overall volume. Regardless, we didn’t see positive divergences that would have allowed us to call a bottom so we’ll have to wait for further testing at this level (now S&P 500 = 2633) before we’ll have a chance to call an end to the correction (assuming the signals line up).
 
Today is trading day 45 for this pullback (counting from the top). The drop from the top is now 10.2% (10.2% max so far). These numbers are based on closing data. Over the last 10-years, the average correction was about 12% and lasted 53 trading-days including retests (excluding major crashes).
 
The most likely course remains that there will be another retest of the correction low. We’ll have to see what happens if and when the S&P 500 tests around the 2633 low again.
 
MOMENTUM ANALYSIS:
(Momentum analysis is not useful in a selloff.) 
 
TODAY’S RANKING OF  15 ETFs (Ranked Daily)
The top ranked ETF receives 100%. The rest are then ranked based on their momentum relative to the leading ETF.  While momentum isn’t stock performance per se, momentum is closely related to stock performance. For example, over the 4-months from Oct thru mid-February 2016, the number 1 ranked Financials (XLF) outperformed the S&P 500 by nearly 20%. In 2017 Technology (XLK) was ranked in the top 3 Momentum Plays for 52% of all trading days in 2017 (if I counted correctly.) XLK was up 35% on the year while the S&P 500 was up 18%.
*For additional background on the ETF ranking system see NTSM Page at…
 
TODAY’S RANKING OF THE DOW 30 STOCKS (Ranked Daily)
The top ranked stock receives 100%. The rest are then ranked based on their momentum relative to the leading stock.
*I rank the Dow 30 similarly to the ETF ranking system. For more details, see NTSM Page at…
 
FRIDAY MARKET INTERNALS (NYSE DATA)
Market Internals remained Negative on the market.
Market Internals are a decent trend-following analysis of current market action but should not be used alone for short term trading. They are usually right, but they are often late.  They are most useful when they diverge from the Index.  In 2014, using these internals alone would have made a 9% return vs. 13% for the S&P 500 (in on Positive, out on Negative – no shorting). 
 
I am now 30% invested in stocks. For me, fully invested is a balanced 50% stock portfolio.
 
Given that the S&P 500 has dropped below its trendline (going back 2-1/2 years) and closed below the 200-dMA on consecutive days, I have a defensive stance now.  If we have a successful test of the prior low, and that could happen soon, I’ll be right back in.  On the other hand, since we don’t really know where the bottom is, I am taking the conservative route. This move may result in underperforming the S&P 500, but there is a risk that declines may be more than we expect resulting in even bigger losses if I had stayed fully invested.
 
INTERMEDIATE / LONG-TERM INDICATOR
Friday, the Price indicator was positive; the Sentiment indicator was neutral; the Volume and VIX indicators were negative. Overall this is a NEGATIVE indication. This would be a Sell indication, but it’s probably too late to sell now - unfortunately, I don’t know how far this pullback will go.  The first (and important) sell signal of this corrective cycle by this indicator was on 11 October.)