“Trade what you see; not what you think.” – The Old Fool,
Richard McCranie, trader extraordinaire.
“Far more money has been lost by investors in preparing for
corrections, or anticipating corrections, than has been lost in the corrections
themselves.” - Peter Lynch, former manager of Fidelity’s Magellan®
fund.
PCE (CNBC)
“The personal consumption expenditures price index increased
2.6% on a year-over-year basis in December, 0.2 percentage point higher than
the November reading and in line with the Dow Jones estimate.” Story at...
https://www.cnbc.com/2025/01/31/pce-inflation-december-2024-.html
My cmt: Yesterday’s PCE was a preliminary number.
PERSONAL INCOME (Eye on Housing)
“Personal income increased by 0.4% in December, following
a 0.3% rise in November and a 0.7% gain in October, according to the latest
data from the Bureau of Economic Analysis. The gains in personal income were
largely driven by higher wages and salaries.” Story at...
https://eyeonhousing.org/2025/01/personal-income-rises-0-4-in-december/
CHICAGO PMI (Investing.com)
“...the Chicago Purchasing Managers' Index (PMI) has
posted a new figure, reflecting the current health of the manufacturing sector
in the Chicago region. The actual number for the PMI has come in at 39.5. This
figure, although showing an improvement, falls short of the forecasted number
of 40.3.” Story at...
https://www.investing.com/news/economic-indicators/chicago-pmi-shows-slight-recovery-still-below-forecast-93CH-3843019
TRUMP TO IMPOSE TARIFFS ON CANADA, MEXICO, AND CHINA (NBC
News)
“The White House said Friday that President Donald Trump
would impose a 25% tariff on goods coming to the U.S. from Canada and Mexico
and a 10% tariff on those from China on Saturday, a move that could drive up
prices for products coming into the U.S. from those countries... Trump said
Friday that there was nothing that the three countries could do to avoid the
tariffs, which he said were in response to the import of fentanyl into the U.S.
and because the U.S. has a trade deficit with the three countries.” Story at...
https://www.nbcnews.com/politics/donald-trump/trump-impose-tariffs-canada-mexico-china-saturday-white-house-says-rcna190221
MARKET REPORT / ANALYSIS AS OF 1PM FRIDAY
-Friday the S&P 500 declined about 0.5% to 6041.
-VIX rose about 4% to 16.43.
-The yield on the 10-year Treasury rose (compared to
about this time, prior trading day) to 4.543%.
MY TRADING POSITIONS:
XLK – Holding since the October 2022 lows. Added more 9/20.
SSO – added 12/20. (IRA acct.)
SPY – added 12/20. (IRA acct.)
QLD – added 12/20. (IRA acct.)
NVDA – added 1/6/2025.
The decline in Nvidia appears to be overblown. Regarding
competition to Nvidia, Dan Ives (Managing Director and Senior Equity Research
Analyst covering the Technology sector at Wedbush Securities) says, “The
threat is minimal.” He recommended buying Nvidia. I will hold NVDA and see what
develops...
CURRENT SUMMARY OF APPROXIMATELY 50 INDICATORS:
Today, of the 50-Indicators I track, 6 gave Bear-signs
and 13 were Bullish. The rest are neutral. (It is normal to have a lot of
neutral indicators since many of the indicators are top or bottom indicators
that will signal only at extremes.)
The daily Bull/Bear, 50-Indicator spread (Bull Indicators
minus Bear Indicators, red curve in the chart above) declined to +7 (7 more Bull
indicators than Bear indicators).
TODAY’S COMMENT
Today’s market action can be summed up in one word –
Tariffs. Markets looked good today, at least until the reports that Trump would
place tariffs on major US trading partners (see story above). The S&P 500 then
fell about 1% as the day progressed. I
ran some preliminary numbers before the selloff and my indicators were looking good,
but they fell sharply, too, as the markets declined.
The daily, bull-bear spread of 50-indicators is a bullish
+10, but we can’t be encouraged by the falling indicators especially the sharp
drop today on the tariff news. The 10-dMA of the spread turned down today and
that is never good.
Markets don’t like uncertainty and the tariffs are uncertainty
in spades, spades being the highest-ranking suit when playing bridge.
With the daily-indicator, bull-bear spread turning down,
and the 10-dMA of the bull-bear spread now falling, I am inclined to sell
leveraged positions. I’ll make that decision on Monday depending on market
action.
BOTTOM LINE
I am neutral – we need more information so we’ll see Monday.
ETF - MOMENTUM ANALYSIS:
TODAY’S RANKING OF 15 ETFs (Ranked Daily) ETF ranking
follows:
The top ranked ETF receives
100%. The rest are then ranked based on their momentum relative to the leading
ETF.
*For additional background on
the ETF ranking system see NTSM Page at…
http://navigatethestockmarket.blogspot.com/p/exchange-traded-funds-etf-ranking.html
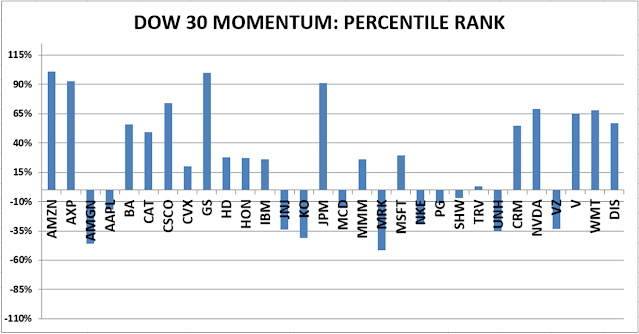
DOW STOCKS - TODAY’S MOMENTUM RANKING
OF THE DOW 30 STOCKS (Ranked Daily)
The top ranked Stock receives
100%. The rest are then ranked based on their momentum relative to the leading Stock.
For more details, see NTSM
Page at…
https://navigatethestockmarket.blogspot.com/p/a-system-for-trading-dow-30-stocks-my_8.html
FRIDAY MARKET INTERNALS (NYSE
DATA)
My basket of Market Internals remained HOLD. (My basket of Market
Internals is a decent trend-following analysis that is most useful when it
diverges from the Index.)
...My current invested
position is about 75% stocks, including stock mutual funds and ETFs. 50%
invested in stocks is a normal position. (75% is my max stock allocation when I
am confident that markets will continue higher; 30% in stocks is my Bear market
position.)
I trade about 15-20% of the total portfolio using the
momentum-based analysis I provide here. When I see bullish signs, I add a lot more
stocks to the portfolio, usually by using an S&P 500 ETF as I did back in
October 2022 and 2023.
“Trade what you see; not what you think.” – The Old Fool,
Richard McCranie, trader extraordinaire.
“Far more money has been lost by investors in preparing for
corrections, or anticipating corrections, than has been lost in the corrections
themselves.” - Peter Lynch, former manager of Fidelity’s Magellan®
fund.
GDP / PCE PRICES (BEA)
“Real gross domestic product (GDP) increased at an
annual rate of 2.3 percent in the fourth quarter of 2024 (October, November,
and December), according to the advance estimate released by the U.S. Bureau of
Economic Analysis. In the third quarter, real GDP increased 3.1 percent...
...The price index for gross domestic
purchases increased 2.2 percent in the fourth quarter, compared with an
increase of 1.9 percent in the third quarter. The personal consumption
expenditures (PCE) price index increased 2.3 percent, compared with an
increase of 1.5 percent. Excluding food and energy prices, the PCE price index
increased 2.5 percent, compared with an increase of 2.2 percent.” Press release
at...
https://www.bea.gov/news/2025/gross-domestic-product-4th-quarter-and-year-2024-advance-estimate
JOBLESS CLAIMS (Reuters)
“Initial claims for state unemployment benefits dropped
16,000 to a seasonally adjusted 207,000 for the week ended Jan. 25, the Labor
Department said on Thursday. Economists polled by Reuters had forecast 220,000
claims for the latest week.” Story at...
https://www.reuters.com/markets/us/us-weekly-jobless-claims-decline-more-than-expected-2025-01-30/
NYSE A-D LINE DIVERGENCE (McClellan Financial
Publications)
“The SP500 on Jan. 23, 2025 was able to climb up to a new
all-time closing high. But it is not yet dragging along the rest of the
market, and this may indicate a problem. This week's chart shows a bearish
divergence evident in the NYSE's cumulative Daily Advance-Decline Line... One
important point is that a divergence represents a "condition" and not
a "signal". Just because we notice a divergence does not mean
that it has to matter right away. When they do matter, it is on their own
schedule.” – Tom McClellan.

Analysis at...
https://www.mcoscillator.com/learning_center/weekly_chart/nyse_a-dine_divergence/
NTSM ANALYSIS OF BREADTH (NTSM)
As shown in the chart above, my analysis of Breadth shows
a similar divergence in breadth, but as Tom McClellan notes, divergence is not a
signal. My signal is bearish if the 100-dMA of Issues advancing on the NYSE is
below 50%. It’s not there yet (The right x-axis in the above chart is a %). In
my system, breadth is still issuing a buy signal.
MARKET REPORT / ANALYSIS AS OF 1PM FRIDAY
-Thursday the S&P 500 rose about 0.5% to 6071.
-VIX declined about 1.2% to 15.84.
-The yield on the 10-year Treasury was little changed
(compared to about this time, prior trading day) at 4.535%.
MY TRADING POSITIONS:
XLK – Holding since the October 2022 lows. Added more 9/20.
SSO – added 12/20. (IRA acct.)
SPY – added 12/20. (IRA acct.)
QLD – added 12/20. (IRA acct.)
NVDA – added 1/6/2025.
The decline in Nvidia appears to be overblown. Regarding
competition to Nvidia, Dan Ives (Managing Director and Senior Equity Research
Analyst covering the Technology sector at Wedbush Securities) says, “The
threat is minimal.” He recommended buying Nvidia. I will hold NVDA and see what
develops...
CURRENT SUMMARY OF APPROXIMATELY 50 INDICATORS:
Today, of the 50-Indicators I track, 5 gave Bear-signs
and 15 were Bullish. The rest are neutral. (It is normal to have a lot of
neutral indicators since many of the indicators are top or bottom indicators
that will signal only at extremes.)
The daily Bull/Bear, 50-Indicator spread (Bull Indicators
minus Bear Indicators, red curve in the chart above) declined to +10 (10 more Bull
indicators than Bear indicators).
TODAY’S COMMENT
Overall, the daily, bull-bear spread of 50-indicators is
a bullish +10. The 10-dMA of the spread is also moving higher, another bull-sign.
Microsoft made concerning comments about future revenues
so it was down late in after-hours trading yesterday and down in today’s
trading. Other tech companies were more
optimistic – Apple was up 3% after-hours and IBM was up 13% on the day.
BOTTOM LINE
I remain bullish.
ETF - MOMENTUM ANALYSIS:
TODAY’S RANKING OF 15 ETFs (Ranked Daily) ETF ranking
follows:
The top ranked ETF receives
100%. The rest are then ranked based on their momentum relative to the leading
ETF.
*For additional background on
the ETF ranking system see NTSM Page at…
http://navigatethestockmarket.blogspot.com/p/exchange-traded-funds-etf-ranking.html
DOW STOCKS - TODAY’S MOMENTUM RANKING
OF THE DOW 30 STOCKS (Ranked Daily)
The top ranked Stock receives
100%. The rest are then ranked based on their momentum relative to the leading Stock.
For more details, see NTSM
Page at…
https://navigatethestockmarket.blogspot.com/p/a-system-for-trading-dow-30-stocks-my_8.html
THURSDAY MARKET INTERNALS (NYSE
DATA)
My basket of Market Internals declined to HOLD. (My basket of Market
Internals is a decent trend-following analysis that is most useful when it
diverges from the Index.)
...My current invested
position is about 75% stocks, including stock mutual funds and ETFs. 50%
invested in stocks is a normal position. (75% is my max stock allocation when I
am confident that markets will continue higher; 30% in stocks is my Bear market
position.)
I trade about 15-20% of the total portfolio using the
momentum-based analysis I provide here. When I see bullish signs, I add a lot more
stocks to the portfolio, usually by using an S&P 500 ETF as I did back in
October 2022 and 2023.
“Trade what you see; not what you think.” – The Old Fool,
Richard McCranie, trader extraordinaire.
“Far more money has been lost by investors in preparing for
corrections, or anticipating corrections, than has been lost in the corrections
themselves.” - Peter Lynch, former manager of Fidelity’s Magellan®
fund.
TRUMP ISN’T KING (WSJ – LETTERS)
“It is common today to think of our branches of
government as coequal, as Daniel Henninger writes in his column “Trump’s Imperial Presidency?” (Wonder Land, Jan. 23). But
this is incorrect. The Founders would say our branches are coordinate, that
each has its own role...
...Unfortunately, our government today bears little
resemblance to this constitutional vision. It is, as Mr. Henninger writes,
closer to an imperium, with the president as elected emperor. The blame for
this situation belongs to Congress, which has over the last century ceded de
facto lawmaking powers to the executive branch and its legions of unelected
bureaucrats. This violates an essential maxim of our constitutional order: that
the preservation of liberty requires that the executive, legislative and judicial
powers mostly be kept separate...
...Perhaps congressional dysfunction isn’t a consequence
of our civic malady but its cause. By divesting itself of power, Congress has
robbed the people of meaningful input into the rules that govern them. If some
wish to “Make America Great Again,” as President Trump and his supporters
proclaim, the executive should return to Congress the powers that, under the
Constitution, it never should have had in the first place.” - Jay Cost, American
Enterprise Institute. Full letter at...
https://www.wsj.com/opinion/trump-isnt-king-and-congress-isnt-coequal-trump-republic-1f7f46f1?mod=letterstoeditor_more_article_pos13
my cmt: Of course this didn’t start with Trump, Biden or
even Obama, though they all assumed powers that were not granted to the
President.
"I've officially introduced legislation to put
President Trump's face on Mount Rushmore. His remarkable accomplishments for
our country and the success he will continue to deliver deserve the highest
recognition and honor on this iconic national monument. Let's get
carving!" - Anna Paulina Luna, Florida, (R) House of Representatives.
"This is silly. I'm a Republican, but Trump's first
term wasn't impressive. He hasn't done much to earn praise, let alone
consideration for Mount Rushmore. This is when our movement feels weird."
– Mark Valley, Republican voter.
FED RATE DECISION (CNBC)
“In a widely anticipated move, the central bank’s Federal
Open Market Committee left unchanged its overnight borrowing rate in a range
between 4.25%-4.5%... The post-meeting
statement dropped a few clues about the reasoning behind the
decision to hold rates steady. It offered a somewhat more optimistic view on
the labor market while losing a key reference from the December statement that
inflation ‘has made progress toward’ the Fed’s 2% inflation goal.” Story at...
https://www.cnbc.com/2025/01/29/fed-rate-decision-january-2025.html
CRUDE INVENTORIES (EIA)
“U.S. commercial crude oil inventories (excluding those
in the Strategic Petroleum Reserve) increased by 3.5 million barrels from the
previous week. At 415.1 million barrels, U.S. crude oil inventories are about
6% below the five year average for this time of year.” Report at...
https://ir.eia.gov/wpsr/wpsrsummary.pdf
MARKET REPORT / ANALYSIS AS OF 1PM FRIDAY
-Wednesday the S&P 500 declined about 0.5% to 6039.
-VIX rose about 0.9% to 16.56.
-The yield on the 10-year Treasury was unchanged
(compared to about this time, prior trading day) at 4.534%.
MY TRADING POSITIONS:
XLK – Holding since the October 2022 lows. Added more 9/20.
SSO – added 12/20. (IRA acct.)
SPY – added 12/20. (IRA acct.)
QLD – added 12/20. (IRA acct.)
NVDA – added 1/6/2025.
The decline in Nvidia appears to be overblown. Regarding
competition to Nvidia, Dan Ives (Managing Director and Senior Equity Research
Analyst covering the Technology sector at Wedbush Securities) says, “The
threat is minimal.” He recommended buying Nvidia. I will hold NVDA and see what
develops...
...Down 17% Monday; up 9% Tuesday; down 4% Wednesday –
whiplash!
Nvidia was up 2% after hours Wednesday so perhaps
investors were encouraged by earnings from Microsoft and Meta.
CURRENT SUMMARY OF APPROXIMATELY 50 INDICATORS:
Today, of the 50-Indicators I track, 4 gave Bear-signs
and 17 were Bullish. The rest are neutral. (It is normal to have a lot of
neutral indicators since many of the indicators are top or bottom indicators
that will signal only at extremes.)
The daily Bull/Bear, 50-Indicator spread (Bull Indicators
minus Bear Indicators, red curve in the chart above) declined to +13 (13 more Bull
indicators than Bear indicators).
TODAY’S COMMENT
Overall, the daily, bull-bear spread of 50-indicators is a
bullish +13. The 10-dMA of the spread is also moving higher, another bull-sign.
The decline in indicators is not particularly concerning, especially on a Fed-decision
day. There’s often angst when the Fed is talking. There were some critical
earnings due today and that may have also worried investors.
Microsoft and Meta are both up in after-hours trading as
I write this. Investors liked their
earnings and statements. Let’s hope that translates into an up-day tomorrow. Today’s
low was well above Monday’s low so it seems likely that markets will move
higher.
BOTTOM LINE
I remain bullish.
ETF - MOMENTUM ANALYSIS:
TODAY’S RANKING OF 15 ETFs (Ranked Daily) ETF ranking
follows:
The top ranked ETF receives
100%. The rest are then ranked based on their momentum relative to the leading
ETF.
*For additional background on
the ETF ranking system see NTSM Page at…
http://navigatethestockmarket.blogspot.com/p/exchange-traded-funds-etf-ranking.html
DOW STOCKS - TODAY’S MOMENTUM RANKING
OF THE DOW 30 STOCKS (Ranked Daily)
The top ranked Stock receives
100%. The rest are then ranked based on their momentum relative to the leading Stock.
For more details, see NTSM
Page at…
https://navigatethestockmarket.blogspot.com/p/a-system-for-trading-dow-30-stocks-my_8.html
WEDNESDAY MARKET INTERNALS
(NYSE DATA)
My basket of Market Internals remained BUY. (My basket of Market
Internals is a decent trend-following analysis that is most useful when it
diverges from the Index.)
...My current invested
position is about 75% stocks, including stock mutual funds and ETFs. 50%
invested in stocks is a normal position. (75% is my max stock allocation when I
am confident that markets will continue higher; 30% in stocks is my Bear market
position.)
I trade about 15-20% of the total portfolio using the
momentum-based analysis I provide here. When I see bullish signs, I add a lot more
stocks to the portfolio, usually by using an S&P 500 ETF as I did back in
October 2022 and 2023.
“Trade what you see; not what you think.” – The Old Fool,
Richard McCranie, trader extraordinaire.
“Far more money has been lost by investors in preparing for
corrections, or anticipating corrections, than has been lost in the corrections
themselves.” - Peter Lynch, former manager of Fidelity’s Magellan®
fund.
DURABLE GOODS (RTT News)
“A report released by the Commerce Department on Tuesday
unexpectedly showed a steep drop by new orders for U.S. manufactured durable
goods in the month of December amid a nosedive by orders for transportation
equipment. The Commerce Department said durable goods orders plunged by 2.2
percent in December after tumbling by a revised 2.0 percent in November.” Story
at...
https://www.rttnews.com/3506528/u-s-durable-goods-orders-unexpectedly-plunge-2-2-in-december.aspx
CONSUMER CONFIDENCE (AP News)
“U.S. consumer confidence dipped for the second
consecutive month in January, a business research group said Tuesday. The
Conference Board reported that its consumer confidence index retreated this
month to 104.1, from 109.5 in December.” Story at...
https://apnews.com/article/consumer-confidence-conference-board-spending-economy-31aab08b4281d3d23961c5c25fef6cca
MARKET REPORT / ANALYSIS AS OF 1PM FRIDAY
-Tuesday the S&P 500 rose about 0.9% to 6068.
-VIX declined about 8% to 16.41.
-The yield on the 10-year Treasury was unchanged
(compared to about this time, prior trading day) at 4.534%.
MY TRADING POSITIONS:
XLK – Holding since the October 2022 lows. Added more 9/20.
SSO – added 12/20. (IRA acct.)
SPY – added 12/20. (IRA acct.)
QLD – added 12/20. (IRA acct.)
NVDA – added 1/6/2025.
The decline in Nvidia appears to be overblown. Regarding
competition to Nvidia, Dan Ives (Managing Director and Senior Equity Research
Analyst covering the Technology sector at Wedbush Securities) says, “The
threat is minimal.” He recommended buying Nvidia. I will hold NVDA and see what
develops...
...Down 17% yesterday; up 9% today.
CURRENT SUMMARY OF APPROXIMATELY 50 INDICATORS:
Today, of the 50-Indicators I track, 3 gave Bear-signs
and 19 were Bullish. The rest are neutral. (It is normal to have a lot of
neutral indicators since many of the indicators are top or bottom indicators
that will signal only at extremes.)
The daily Bull/Bear, 50-Indicator spread (Bull Indicators
minus Bear Indicators, red curve in the chart above) improved to +16 (16 more Bull
indicators than Bear indicators).
TODAY’S COMMENT
Overall, the daily, bull-bear spread of 50-indicators is
a very bullish +16. The 10-dMA of the spread is also moving higher, another
bull-sign.
Improving indicators is a good sign.
BOTTOM LINE
I remain bullish.
ETF - MOMENTUM ANALYSIS:
TODAY’S RANKING OF 15 ETFs (Ranked Daily) ETF ranking
follows:
The top ranked ETF receives
100%. The rest are then ranked based on their momentum relative to the leading
ETF.
*For additional background on
the ETF ranking system see NTSM Page at…
http://navigatethestockmarket.blogspot.com/p/exchange-traded-funds-etf-ranking.html
DOW STOCKS - TODAY’S MOMENTUM RANKING
OF THE DOW 30 STOCKS (Ranked Daily)
The top ranked Stock receives
100%. The rest are then ranked based on their momentum relative to the leading Stock.
For more details, see NTSM
Page at…
https://navigatethestockmarket.blogspot.com/p/a-system-for-trading-dow-30-stocks-my_8.html
TUESDAY MARKET INTERNALS (NYSE
DATA)
My basket of Market Internals remained BUY. (My basket of Market
Internals is a decent trend-following analysis that is most useful when it
diverges from the Index.)
...My current invested
position is about 75% stocks, including stock mutual funds and ETFs. 50%
invested in stocks is a normal position. (75% is my max stock allocation when I
am confident that markets will continue higher; 30% in stocks is my Bear market
position.)
I trade about 15-20% of the total portfolio using the
momentum-based analysis I provide here. When I see bullish signs, I add a lot more
stocks to the portfolio, usually by using an S&P 500 ETF as I did back in
October 2022 and 2023.
“Trade what you see; not what you think.” – The Old Fool,
Richard McCranie, trader extraordinaire.
“Far more money has been lost by investors in preparing for
corrections, or anticipating corrections, than has been lost in the corrections
themselves.” - Peter Lynch, former manager of Fidelity’s Magellan®
fund.
“Of Mr. Trump’s executive orders, some were sound... But
let me tell you what happens when you pardon virtually everyone who did Jan. 6:
You get more Jan. 6ths. When people who commit crimes see that their punishment
will be minimal they are encouraged. It was a wicked act. Conservatives are
tough on crime because of the pain and disorder it causes. In that case it
pained an entire nation. Jan. 6 too shamed us in the eyes of the world. This
pardon was not a patriotic act.” Peggy Noonan, WSJ. Commentary at...
https://www.wsj.com/opinion/the-white-house-wonder-horse-donald-trump-america-inaugural-address-f4569d27?mod=opinion_recentauth_pos3&mod=opinion_recentauth_pos_3
My cmt: It was neither patriotic nor the act of a real
conservative. It was the act of a coward who may have been worried that if he
didn’t offer a pardon, some of those incarcerated may have broken their silence
and testified against him. How’s that for a conspiracy theory? Regular readers
know that I have previously noted that there have been numerous reports by
major news sources that there were phone communications between the White House
and January 6 rioters, both before, and during the riot.
“The press is reporting that Republicans in Congress are
getting nervous about spending reductions in social programs as too politically
risky. Another GOP faction wants to retain Joe Biden’s green subsidies. And
this is only week one of the new Administration. If this keeps up, why not let
Democrats run the place? ... Progressives claim that Republicans want to take
food and healthcare away from the poor and sick. But the reality is that Mr.
Biden’s welfare expansions have mostly benefited those who can support
themselves but for any number of reasons choose not to. Republicans need not
fall into the trap of talking about this like accountants. This is a moral
issue of helping people who really need it but not those who don’t.” – WSJ
Editorial Board. Commentary at...
https://www.wsj.com/opinion/biden-welfare-spending-transfer-payments-republicans-savings-tax-reform-3f10d9eb?mod=opinion_lead_pos12
CHINESE AI UPSTART SPARKS TRILLION DOLLAR MARKET ROUT
(The Daily Beast)
“A Chinese artificial
intelligence startup’s latest AI model spooked markets Monday, leaving U.S.
and European technology
stocks on track for a $1 trillion wipeout, a week after President Donald Trump threw
his weight behind a $500 billion private sector investment in AI infrastructure.
DeepSeek’s latest AI model topped Apple’s App Store charts over the weekend,
challenging the dominance of Silicon
Valley giants like ChatGPT-maker OpenAI and leading to concerns
that some of America’s largest publicly traded companies are overvalued. Chinese
AI researchers have more widely shared their work—DeepSeek is an open-source
model, meaning anyone can view, use and modify its source code. And, because of
U.S. sanctions disrupting their access to advanced semiconductor chips,
developed AI models that require far less computing power.” Story at...
Chinese
AI Upstart Sparks $1 Trillion Market Rout After Trump Hyped AI Megadeal
NEW HOME SALES (Realtor.com)
“New-home sales rose again in December to a seasonally
adjusted annual rate of 698,000, a 3.6% increase from November 2024 and a 6.7%
increase from December 2023.” Story at...
https://www.realtor.com/research/new-home-sales-december-2024/
MARKET REPORT / ANALYSIS AS OF 1PM FRIDAY
-Monday the S&P 500 declined about 1.5% to 6012.
-VIX rose about 21% to 20.54.
-The yield on the 10-year Treasury declined (compared to
about this time, prior trading day) to 4.534%.
MY TRADING POSITIONS:
XLK – Holding since the October 2022 lows. Added more 9/20.
SSO – added 12/20. (IRA acct.)
SPY – added 12/20. (IRA acct.)
QLD – added 12/20. (IRA acct.)
NVDA – added 1/6/2025.
My Nvidia trade got blown up today. It had been drifting
lower before today. Now we know why. See
the article above. “A Chinese artificial
intelligence startup’s latest AI model spooked markets Monday...” CNBC
reporters congratulated themselves for being “out front” on this story. I watch a lot of CNBC and I don’t remember
hearing about this issue; the reporter today said that it was widely known in Silicon
Valley. In a different part of the story, Josh Brown said that NVDA is not held
by institutional investors, but instead, is held by “retail.” To translate, the
smart money unloaded their positions to the suckers like me - then it was
leaked to the press.
As a practical matter, this appears to be overblown. Regarding
competition to Nvidia, Dan Ives (Managing Director and Senior Equity Research
Analyst covering the Technology sector at Wedbush Securities) says, “The
threat is minimal.” He recommended buying Nvidia. I will hold NVDA and see what
develops.
CURRENT SUMMARY OF APPROXIMATELY 50 INDICATORS:
Today, of the 50-Indicators I track, 7 gave Bear-signs
and 16 were Bullish. The rest are neutral. (It is normal to have a lot of
neutral indicators since many of the indicators are top or bottom indicators
that will signal only at extremes.)
The daily Bull/Bear, 50-Indicator spread (Bull Indicators
minus Bear Indicators, red curve in the chart above) declined to +9 (9 more Bull
indicators than Bear indicators).
TODAY’S COMMENT
Overall, the daily, bull-bear spread of 50-indicators is
a bullish +9. The 10-dMA of the spread is also moving higher, another bull-sign.
Monday was a statistically significant down-day. That
just means that the price-volume move exceeded my statistical parameters.
Statistics show that a statistically-significant, down-day is followed by an up-day
about 60% of the time. Bottoms almost
always occur on Statistically-significant, down-days, but not all
statistically-significant, down-days occur at bottoms. The daily chart showed
that the S&P 500 bounced higher from below its 50-dMA (and lower trend-line)
suggesting that the markets will move higher from here.
I thought that my Panic Indicator would have been
triggered today, but it wasn’t. That’s probably good news. Today’s panic was not widespread and seemed
to be concentrated in chip names.
BOTTOM LINE
I remain bullish.
ETF - MOMENTUM ANALYSIS:
TODAY’S RANKING OF 15 ETFs (Ranked Daily) ETF ranking
follows:
The top ranked ETF receives
100%. The rest are then ranked based on their momentum relative to the leading
ETF.
*For additional background on
the ETF ranking system see NTSM Page at…
http://navigatethestockmarket.blogspot.com/p/exchange-traded-funds-etf-ranking.html
DOW STOCKS - TODAY’S MOMENTUM RANKING
OF THE DOW 30 STOCKS (Ranked Daily)
The top ranked Stock receives
100%. The rest are then ranked based on their momentum relative to the leading Stock.
For more details, see NTSM
Page at…
https://navigatethestockmarket.blogspot.com/p/a-system-for-trading-dow-30-stocks-my_8.html
MONDAY MARKET INTERNALS (NYSE
DATA)
My basket of Market Internals improved to BUY. (My basket of Market
Internals is a decent trend-following analysis that is most useful when it
diverges from the Index.)
...My current invested
position is about 75% stocks, including stock mutual funds and ETFs. 50%
invested in stocks is a normal position. (75% is my max stock allocation when I
am confident that markets will continue higher; 30% in stocks is my Bear market
position.)
I trade about 15-20% of the total portfolio using the
momentum-based analysis I provide here. When I see bullish signs, I add a lot more
stocks to the portfolio, usually by using an S&P 500 ETF as I did back in
October 2022 and 2023.
“Trade what you see; not what you think.” – The Old Fool,
Richard McCranie, trader extraordinaire.
“Far more money has been lost by investors in preparing for
corrections, or anticipating corrections, than has been lost in the corrections
themselves.” - Peter Lynch, former manager of Fidelity’s Magellan®
fund.
“When I saw the film, I thought it was great and that
Steve Carell was wonderful. But I thought, hey, I wasn’t that angry.
After the crash I was interviewed by the Federal Crisis Inquiry Commission, and
I saw a transcription later on. After reading it, I realized that ‘yes,’ I
really was that angry...” - Steven Eisman, discussing “The Big Short.” He was the
real Big Short investor played by Steve Carell (Mark Baum) in the “Big Short”
movie.
HOME SALES (CNN)
“Sales of previously owned homes, which make up the vast
majority of the market, totaled 4.06 million in 2024, the National Association
of Realtors said Friday. That’s the lowest level since 1995 and slightly below
2023’s similarly anemic levels.” Story at...
https://www.cnn.com/2025/01/24/economy/us-home-sales-worst-year-in-three-decades/index.html
MICHIGAN FINAL SENTIMENT (Advisor Perspectives)
“Consumer sentiment fell for the first time in six
months, according to the final January report for the Michigan Consumer
Sentiment Index, coming in at 71.1. The index dropped 2.9 points (-3.9%) from
December's final reading to 74.0 and is down 10.0% compared to one year ago.
The latest reading was lower than the 73.2 forecast.” Analysis and charts at...
https://www.advisorperspectives.com/dshort/updates/2025/01/24/michigan-consumer-sentiment-january-2025-final
MARKET REPORT / ANALYSIS AS OF 1PM FRIDAY
-Friday the S&P 500 declined about 0.3% to 6101.
-VIX declined about 1% to 14.85.
-The yield on the 10-year Treasury rose (compared to
about this time, prior trading day) to 4.617%.
MY TRADING POSITIONS:
XLK – Holding since the October 2022 lows. Added more 9/20.
SSO – added 12/20. (IRA acct.)
SPY – added 12/20. (IRA acct.)
QLD – added 12/20. (IRA acct.)
NVDA – added 1/6/2025
CURRENT SUMMARY OF APPROXIMATELY 50 INDICATORS:
Today, of the 50-Indicators I track, 7 gave Bear-signs
and 17 were Bullish. The rest are neutral. (It is normal to have a lot of
neutral indicators since many of the indicators are top or bottom indicators
that will signal only at extremes.)
The daily Bull/Bear, 50-Indicator spread (Bull Indicators
minus Bear Indicators, red curve in the chart above) declined to +10 (10 more Bull
indicators than Bear indicators).
TODAY’S COMMENT
I’ve been re-watching “The Big Short” on cable. The “can’t
lose” mentality shown in the movie is being mirrored by current stock market
action: Everyone on CNBC is bullish; Valuations are extreme by any measure; the
Government is considering establishing a bitcoin “asset stockpile” (bitcoins
have no real value); it’s been a generation (24 years) since there was a
valuation crash; Wall Street (Calamos Investments) is offering funds with 100%
downside protection.
The end could be near, but we don’t know. I bring this up
because at yesterday’s all-time S&P 500 high, the number of new 52-week
highs for issues on the NYSE was lower than I would like. They weren’t low
enough to trigger my Bear-indicator, but it was close.
In the Big Short, it was possible to predict a collapse
due to the sharply rising interest rates since the Fed was in a hiking cycle.
The mortgage-based instruments (Collateralized Mortgage Obligations) failed as interest
rates on sub-prime, adjustable-rate mortgages reset. My guess is the next crash will be a valuation
crash – markets will run out of buyers when the prices get too high. That was the
main cause of the dot.com crash although the Fed lit the fire by hiking
interest rates.
Now, markets could keep going up for another year or two,
or even longer. I’ll just keep watching indicators. Until I see more signs of
trouble, I’ll be fully invested.
Overall, the daily, bull-bear spread of 50-indicators is
a bullish +10. The 10-dMA of the spread is also moving higher, another bull-sign.
BOTTOM LINE
I remain bullish.
ETF - MOMENTUM ANALYSIS:
TODAY’S RANKING OF 15 ETFs (Ranked Daily) ETF ranking
follows:
The top ranked ETF receives
100%. The rest are then ranked based on their momentum relative to the leading
ETF.
*For additional background on
the ETF ranking system see NTSM Page at…
http://navigatethestockmarket.blogspot.com/p/exchange-traded-funds-etf-ranking.html
DOW STOCKS - TODAY’S MOMENTUM RANKING
OF THE DOW 30 STOCKS (Ranked Daily)
The top ranked Stock receives
100%. The rest are then ranked based on their momentum relative to the leading Stock.
For more details, see NTSM
Page at…
https://navigatethestockmarket.blogspot.com/p/a-system-for-trading-dow-30-stocks-my_8.html
FRIDAY MARKET INTERNALS (NYSE
DATA)
My basket of Market Internals declined to HOLD. (My basket of Market
Internals is a decent trend-following analysis that is most useful when it
diverges from the Index.)
...My current invested
position is about 75% stocks, including stock mutual funds and ETFs. 50%
invested in stocks is a normal position. (75% is my max stock allocation when I
am confident that markets will continue higher; 30% in stocks is my Bear market
position.)
I trade about 15-20% of the total portfolio using the
momentum-based analysis I provide here. When I see bullish signs, I add a lot more
stocks to the portfolio, usually by using an S&P 500 ETF as I did back in
October 2022 and 2023.
“Trade what you see; not what you think.” – The Old Fool,
Richard McCranie, trader extraordinaire.
“Far more money has been lost by investors in preparing for
corrections, or anticipating corrections, than has been lost in the corrections
themselves.” - Peter Lynch, former manager of Fidelity’s Magellan®
fund.
BIDEN INSISTED HE DIDN’T SIGN EXECUTIVE ORDER JUST WEEKS
AFTER DOING SO (NY Post)
“President Biden had no clue whether or not he signed a
critical executive order during a conversation last year with Republican House
Speaker Mike Johnson, who admitted he left the meeting fearing the nation is
in “serious trouble.” An addled Biden insisted to the Louisiana lawmaker
that he never issued the order to freeze new liquid natural gas export permits
— even though he signed off on it less than a month earlier. Johnson told the
Free Press’ Bari Weiss he didn’t believe Biden was lying, but was left to
believe the then-81-year-old leader “genuinely didn’t know what he had signed.”
Story at...
Biden
insisted he didn’t sign executive order just weeks after doing so, Speaker
Johnson reveals
My cmt: Disturbing, but not
surprising.
TRUMP EXECUTIVE ORDER ENDS BIRTHRIGHT
CITIZENSHIP – 22 STATES SUE (AP News)
“Trump’s order asserts that the
children of noncitizens [born in the U.S.] are not subject to the jurisdiction
of the United States...It goes on to bar federal agencies from recognizing the
citizenship of people in those categories. It takes effect 30 days from
Tuesday, on Feb. 19.” Story at...
https://apnews.com/article/birthright-citizenship-trump-executive-order-immigrants-fc7dd75ba1fb0a10f56b2a85b92dbe53
My cmt:
Section 1 of the 14th Amendment
states: “All persons born or naturalized in the United States, and subject to
the jurisdiction thereof, are citizens of the United States and of the State
wherein they reside.” I see no wiggle room in the language. The President does not have the authority to make
his own rules. Any real conservative would follow the constitution. King Trump
has forgotten the oath of office he took just a few days ago.
JOBLESS CLAIMS (Reuters)
“Initial claims for state unemployment benefits increased
6,000 to a seasonally adjusted 223,000 for the week ended Jan. 18. Economists
polled by Reuters had forecast 220,000 claims for the latest week. Claims were
lifted by the wildfire in Los Angeles, with unadjusted applications increasing
in California, but falling in the majority of states.” Story at...
https://www.reuters.com/markets/us/us-weekly-jobless-claims-increase-marginally-2025-01-23/
CRUDE INVENTORIES (EIA)
“U.S. commercial crude oil inventories (excluding those
in the Strategic Petroleum Reserve) decreased by 1.0 million barrels from the
previous week. At 411.7 million barrels, U.S. crude oil inventories are about
6% below the five-year average for this time of year.” Story at...
https://ir.eia.gov/wpsr/wpsrsummary.pdf
THE RICH AND FAMOUS DON’T FEAR A BUBBLE – BUT YOU SHOULD
(Mark Hulbert on MarketWatch)
“The risk of the stock market is forming a bubble that
will soon burst is higher — especially because the rich and famous don’t think
so. I’m referring to attendees at the World Economic Forum...By almost any
objective measure, the risk of a bubble bursting is perhaps higher now than at
any time in decades. But because no major asset bubble has burst in recent
years, recency bias leads the global elite — just like the rest of us — to
underestimate the risks of such an event...
... The table above contrasts where 10 valuation
indicators stand today versus January 2009. These are the same 10 indicators on
which I focus in my periodic valuation updates, each of which has a solid track
record forecasting the stock market’s inflation-adjusted total return over the
subsequent 10 years. For comparison, the table reports each indicator’s level
relative to the distribution of its readings since 2000, with a 100% reading
meaning that it’s at its most bearish level and 0% meaning it’s at its most
bullish. Notice that each of the 10 valuation indicators was at or near the
most bullish end of the spectrum in January 2009, while just the opposite is
the case today.” Story at...
The
rich and famous don’t fear a stock market bubble. That’s why you should.
CAN’T LOSE INVESTMENTS (Yahoo News)
“Calamos Investments is targeting two of the most popular
ETF themes with a new fund that offers 100% downside protection on bitcoin
investing... [It] builds on the Chicago area firm's suite of
exchange-traded funds that offer 100% downside protection on the S&P 500
Index, the Russell 2000 Index, and the Nasdaq Composite Index.” Story at...
https://finance.yahoo.com/news/calamos-unveils-cant-lose-bitcoin-225042366.html
My cmt: These funds cap upside
potential at around 10%, but when Wall Street decides markets can’t go down, it
is time to be afraid, very afraid.
MARKET REPORT / ANALYSIS AS OF 1PM FRIDAY
-Thursday the S&P 500 rose about 0.5% to 6119.
-VIX declined about 0.5% to 15.02.
-The yield on the 10-year Treasury rose (compared to
about this time, prior trading day) to 4.646%.
MY TRADING POSITIONS:
XLK – Holding since the October 2022 lows. Added more 9/20.
SSO – added 12/20. (IRA acct.)
SPY – added 12/20. (IRA acct.)
QLD – added 12/20. (IRA acct.)
NVDA – added 1/6/2025
CURRENT SUMMARY OF APPROXIMATELY 50 INDICATORS:
Today, of the 50-Indicators I track, 5 gave Bear-signs
and 18 were Bullish. The rest are neutral. (It is normal to have a lot of
neutral indicators since many of the indicators are top or bottom indicators
that will signal only at extremes.)
The daily Bull/Bear, 50-Indicator spread (Bull Indicators
minus Bear Indicators, red curve in the chart above) declined to +13 (13 more Bull
indicators than Bear indicators).
TODAY’S COMMENT
The Table in the above piece, “The Rich and Famous Don’t Fear
a Bubble,” notes how stocks are overvalued. Valuation is not a good way to time
the market. I heard Dennis Gartman
(Gartman letter, former CNBC contributor) on a local radio show this morning
and he said he has been out of the market for a year due to high valuations. This
just demonstrates the difficulty in using valuation for timing the market.
There are now fewer stocks and more investors chasing them – less supply and more
demand means that valuation-indicators are likely to be higher than past
historical extremes. I’ll be watching my 50-indicators (plus a dozen or so
others not in the system) to warn me of market dislocations. Valuation
indicators are not in my system.
Until I see signs of trouble, I’ll be fully invested. On
the other hand, I am inclined to invest in quality names and quality Indices
and avoid the small caps. Previously, I bought
small caps as interest rates came down.
I made some money and lost some money as the small cap rally didn’t materialize.
Now, avoiding small caps will avoid some
risk.
The daily, bull-bear spread of +13 is Bullish. The 10-dMA
of the spread is also moving higher, another bull-sign, but there was a
troubling sign today.
Thursday, the S&P 500 made a New All-time High. I always do a breadth check at new highs. Today, we note that on the NYSE, the number
of issues making new, 52-week highs was low, about half the 5-year average. This
indicates a narrow advance. The value was slightly above my “bear warning,” but
close enough to be a concern. I’ll watch other indicators before I take any
action. If there are declines now (and I’m
not predicting one), a correction is more likely to be greater than 10% than
not.
The S&P 500 is about 9% above its 200-dMA and that is
not particularly stretched and there are no top indicators currently warning. Markets can go higher.
BOTTOM LINE
I am bullish.
ETF - MOMENTUM ANALYSIS:
TODAY’S RANKING OF 15 ETFs (Ranked Daily) ETF ranking
follows:
The top ranked ETF receives
100%. The rest are then ranked based on their momentum relative to the leading
ETF.
*For additional background on
the ETF ranking system see NTSM Page at…
http://navigatethestockmarket.blogspot.com/p/exchange-traded-funds-etf-ranking.html
DOW STOCKS - TODAY’S MOMENTUM RANKING
OF THE DOW 30 STOCKS (Ranked Daily)
The top ranked Stock receives
100%. The rest are then ranked based on their momentum relative to the leading Stock.
For more details, see NTSM
Page at…
https://navigatethestockmarket.blogspot.com/p/a-system-for-trading-dow-30-stocks-my_8.html
THURSDAY MARKET INTERNALS (NYSE
DATA)
My basket of Market Internals improved to BUY. (My basket of Market
Internals is a decent trend-following analysis that is most useful when it
diverges from the Index.)
...My current invested
position is about 75% stocks, including stock mutual funds and ETFs. 50%
invested in stocks is a normal position. (75% is my max stock allocation when I
am confident that markets will continue higher; 30% in stocks is my Bear market
position.)
I trade about 15-20% of the total portfolio using the
momentum-based analysis I provide here. When I see bullish signs, I add a lot more
stocks to the portfolio, usually by using an S&P 500 ETF as I did back in
October 2022 and 2023.