PAUL SCHATZ COMMENTARY EXCERPT (Heritage Capital)
…in the strongest of strong markets, stocks should pause
and then continue higher towards the old highs without any downside. I am not
so sure that’s where we are today, but I wouldn’t sell the bulls short. Another
scenario has stocks seeing some modest weakness this week and then beginning a
more meaningful assault higher next week. I don’t see an immediate collapse
right here… Option traders are just as negative now as they were at market lows
in August and June. While this is only one single indicator and doesn’t
guarantee anything, it is certainly fuel for the bulls to move prices higher
this month.” – Paul Schatz, President Heritage Capital. Commentary at…
LARRY ADAMS COMMENTARY EXCERPT (Raymond James)
“Given our expectation for continued US economic growth
over the next 12 months, we believe that the economic landscape should provide
an environment for positive US earnings growth moving forward. Valuations are
not yet stretched and may have the capacity for slight multiple expansion given
low interest rates and muted inflation. When compared to bonds, the S&P 500
dividend yield outpaces that of most other global developed market sovereign
bond yields…Since 1929, the S&P 500 has an average return of ~11% in a
president’s fourth year and is positive 91% of the time. Our year-end target
for the S&P 500 is 3,053 and our 12-month target is 3,127…with our favorite
sectors being Technology, Health Care, and Communication Services.” – Larry
Adams, CIO, Raymond James. Commentary at…
MARKET REPORT / ANALYSIS
-Monday the S&P 500 dropped about 0.5% to 2939.
-VIX fell about 11% to 17.04.
-The yield on the 10-year Treasury rose a bit to 1.563.
We didn’t learn much today, Monday. We expected some
profit taking and we got it. So, it will be interesting to see if the stock market can move
up Tuesday and confirm our increased stock positions.
My daily sum of 20 Indicators improved from -9 to
-7 (a positive number is bullish; negatives are bearish) while the 10-day
smoothed version that negates the daily fluctuations dropped from -47 to
-50. (These numbers sometimes change after I post the blog based on data that
comes in late.) A reminder: Most of these indicators are short-term. This isn’t
much of an improvement in the indicator total, still…
I am bullish now since chart trends look good.
That is counter to all the economic news that seems to be trending down,
so I will pay close attention to the market. The market may still tell us to
get bearish.
I did reset some trading positions Monday and increase
stock holdings as noted below.
TOP / BOTTOM INDICATOR SCALE OF 1 TO 10 (Zero is a
neutral reading.)
Today’s Reading: 0
Most Recent Day with a value other than Zero: +2 on 3
October.
(1) +10 Max Bullish / -10 Max Bearish)
(2) -4 or below is a Sell sign. +4 or better is a Buy
Sign.
MOMENTUM ANALYSIS:
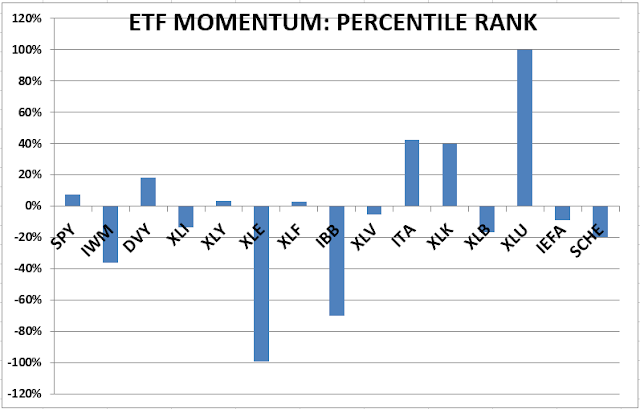
TODAY’S RANKING OF
15 ETFs (Ranked Daily)
The top ranked ETF receives 100%. The rest are then
ranked based on their momentum relative to the leading ETF. While momentum isn’t stock performance per
se, momentum is closely related to stock performance. For example, over the 4-months
from Oct thru mid-February 2016, the number 1 ranked Financials (XLF)
outperformed the S&P 500 by nearly 20%. In 2017 Technology (XLK) was ranked
in the top 3 Momentum Plays for 52% of all trading days in 2017 (if I counted
correctly.) XLK was up 35% on the year while the S&P 500 was up 18%.
*For additional background on the ETF ranking system see
NTSM Page at…
TODAY’S RANKING OF THE DOW 30 STOCKS (Ranked Daily)
The top ranked stock receives 100%. The rest are then
ranked based on their momentum relative to the leading stock.
*I rank the Dow 30 similarly to the ETF ranking system.
For more details, see NTSM Page at…
MONDAY MARKET INTERNALS (NYSE DATA)
Market Internals
remained NEGATIVE on the market.
Market Internals are a decent trend-following analysis of
current market action but should not be used alone for short term trading. They
are usually right, but they are often late.
They are most useful when they diverge from the Index. In 2014, using these internals alone would
have made a 9% return vs. 13% for the S&P 500 (in on Positive, out on
Negative – no shorting).
Using the Short-term indicator in 2018 in SPY would have
made a 5% gain instead of a 6% loss for buy-and-hold. The methodology was Buy
on a POSITIVE indication and Sell on a NEGATIVE indication and stay out until
the next POSITIVE indication. The back-test included 13-buys and 13-sells, or a
trade every 2-weeks on average.
My current stock allocation is about 60% invested in
stocks as of 7 Oct 2019 (up from 50%). This is a conservative balanced position
appropriate for a retiree.
INTERMEDIATE / LONG-TERM INDICATOR
Monday, the VOLUME, VIX, PRICE and
SENTIMENT Indicators were neutral. Overall, the Long-Term Indicator remained
HOLD.

