“Trade what you see; not what you think.” – The Old Fool,
Richard McCranie, trader extraordinaire.
“The big money is not in the buying and selling. But in the
waiting.” - Charlie Munger, Vice Chairman, Berkshire Hathaway
JOBLESS CLAIMS (CNBC)
“The number of first-time filers for unemployment
benefits were slightly higher than expected last week as the labor market continues
its sluggish recovery from the coronavirus pandemic.
The Labor Department reported Thursday that initial
jobless claims for the week ending Sept. 19 came in at 870,000...” Story at...
https://www.cnbc.com/2020/09/24/weekly-jobless-claims.html
NEW HOME SALES (MarketWatch)
“Sales of new single-family homes in August exceeded an
annual rate of 1 million for the first time since 2006...Compared with last
year, new home sales are up 43%.” Story at...
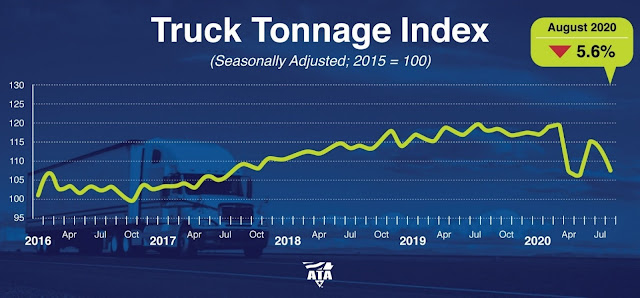
ATA TRUCK TONNAGE FELL IN AUGUST (American Trucking
Association)
“American Trucking Associations’ advanced seasonally
adjusted (SA) For-Hire Truck Tonnage Index decreased 5.6% in August after
declining 1.4% in July. In August, the index equaled 107.5 (2015=100) compared
with 113.9 in July.
“The August softness suggests that freight is very uneven in the trucking industry,” said ATA Chief Economist Bob Costello... Compared with August 2019, the SA index contracted 8.9%, the fifth straight year-over-year decline.” Press release at...
https://www.trucking.org/news-insights/ata-truck-tonnage-index-fell-56-august
This is not good since it may suggest a slowing economy.
STUNNING SHOCKING CHART CAUSES WORRY (Marketwatch)
“Is history repeating itself? Check out this chart,
courtesy of Mott Capital’s Michael Kramer, comparing the Nasdaq-100 NDX, -3.15% back then to the same tech-heavy index
today:
“I found this to be stunning and shocking,” Kramer told investors in a blog post. “I hope this turns out to be wrong, by the way.” More than just the chart, the numbers he highlighted this week mirror of the action in 1999 almost exactly.” Commentary at...
MORE DOWNSIDE AHEAD (Heritage Capital)
“Monday’s action saw the NASDAQ 100 close up on the day,
but the NASDAQ had four times the number of stocks going down than going up.
That’s not healthy behavior and continues to show what I have been warning
about since mid-July; there are many cracks in the foundation that need repair.
While nowhere near as egregious, this is what we saw in late 1999 and early
2000 before the Dotcom Bubble burst.”
Commentary at...
https://investfortomorrow.com/blog/market-finds-temp-low-on-schedule-but-more-downside-ahead/
CORONAVIRUS (NTSM)
Here’s the latest from the COVID19 Johns Hopkins website
at 5:00 Thursday. Total US numbers are on the left axis; daily numbers are on
the right side of the graph with the 10-dMA of daily numbers in Green.
MARKET REPORT / ANALYSIS
-Thursday the S&P 500 rose about 0.3% to 3247.
-VIX rose about 6% to 28.83.
-The yield on the 10-year Treasury slipped to 0.669%.
As of today, the S&P 500 is down 9.3% from its
all-time high. This is day 15 of the correction. The average time from top to
bottom for a correction is 35-days for corrections less than 10% and 68-days
for bigger corrections. The 200-dMA is now 3106, 4.5% lower than today’s close.
The daily sum of 20 Indicators improved from -4 to -2 (a
positive number is bullish; negatives are bearish). The 10-day smoothed sum
that smooths the daily fluctuations improved from -33 to -26. (These numbers
sometimes change after I post the blog based on data that comes in late.) Most
of these indicators are short-term and many are trend following.
RSI switched to Neutral today, so while we may be getting
closer to a bounce, there aren’t any indicators saying bounce now.
The Long Term NTSM indicator ensemble returned to SELL.
The Price, Volume and VIX Indicators are bearish. The Long term NTSM indicator
switched to SELL 3 days after the recent top, but I have been surprised that it
took so long for the VIX indicator to join the Bear Party. VIX may be warning
that this drop has a lot more room to fall.
I remain bearish.
MOMENTUM ANALYSIS:
TODAY’S RANKING OF
15 ETFs (Ranked Daily)
The top ranked ETF receives 100%. The rest are then
ranked based on their momentum relative to the leading ETF.
*For additional background on the ETF ranking system see NTSM Page at…
http://navigatethestockmarket.blogspot.com/p/exchange-traded-funds-etf-ranking.html
TODAY’S RANKING OF THE DOW 30 STOCKS (Ranked Daily)
Here’s the revised DOW 30 and its momentum analysis. The
top ranked stock receives 100%. The rest are then ranked based on their
momentum relative to the leading stock.
For more details, see NTSM Page at…
https://navigatethestockmarket.blogspot.com/p/a-system-for-trading-dow-30-stocks-my_8.html
THURSDAY MARKET INTERNALS (NYSE DATA)
Market Internals improved
to NEUTRAL on the market.
Market Internals are a decent trend-following analysis of
current market action, but should not be used alone for short term trading.
They are usually right, but they are often late. They are most useful when they diverge from
the Index.
Using the Short-term indicator in 2018 in SPY would have
made a 5% gain instead of a 6% loss for buy-and-hold. The methodology was Buy
on a POSITIVE indication and Sell on a NEGATIVE indication and stay out until
the next POSITIVE indication. The back-test included 13-buys and 13-sells, or a
trade every 2-weeks on average.
My current stock allocation is about 30% invested in
stocks. You may wish to have a higher or lower % invested in stocks depending
on your risk tolerance. 30% is a conservative position that I re-evaluate daily,
but it is appropriate for the correction.
As a retiree, 50% in the stock market is about fully
invested for me – it is a cautious and conservative number. If I feel very
confident, I might go to 60%; if this correction is deep enough, 80% would not
be out of the question.


