Monday, January 8, 2018

Hussman Market Commentary Excerpt … Stock Market Analysis … ETF Trading … Dow 30 Ranking

Busy day, but I did manage to crunch the numbers tonight.
 
JANUARY 2018 HUSSMAN COMMENTARY EXCERPT (Hussman Funds)
“As we begin 2018, the most appropriate starting point is to clarify our actual investment stance. A central aspect of our outlook is the distinction between investment and speculation. If Wall Street believes that stock prices could advance further because investors temporarily have a speculative bit in their teeth, and that they care more that the environment “feels good” than about any careful evaluation of long-term investment prospects, we have no strenuous objection to that argument. Indeed, that’s exactly why, until we see more than the early deterioration in market internals we observe at present, our immediate investment outlook is rather neutral. On the other hand, if Wall Street believes that current valuations are actually “justified,” that 10-12 year S&P 500 total returns are likely to be meaningfully positive, or that the S&P 500 will avoid a collapse on the order of -65% over the completion of the current market cycle, my view is that these beliefs are strenuously at odds with the evidence from a century of market history.” - John Hussman, PhD. Commentary at…
 
MARKET REPORT / ANALYSIS         
-Monday the S&P 500 was up about 0.2% to 2748.
-VIX was up about 3% to 9.52.
-The yield on the 10-year Treasury rose to 2.488%.
 
My sum of 17 Indicators slipped from +6 to +5 today. On a 10-day basis, values were down slightly. A “+” number means that most indicators are bullish.
 
No point in getting too detailed in the write-up today. Most short-term indicators are bearish.  I am not shorting though.  So many of these normally reliable indicators are questionable now as Investors and Traders seem to be in the mood to buy, buy, buy. It looks like the markets may trade sideways for a while until they don’t – at that point I think we’ll see some sort of pullback. We just don’t know how big.
 
I am bearish short-term; longer term I am a bull, but I recommend caution with the Fed raising rates and shrinking its balance sheet. In addition, we are due for a correction in 2018 due to Presidential election cycle history.
 
TODAY’S RANKING OF  15 ETFs (Ranked Daily)

The top ranked ETF receives 100%. The rest are then ranked based on their momentum relative to the leading ETF.  While momentum isn’t stock performance per se, momentum is closely related to stock performance. For example, over the 4-months from Oct thru mid-February 2016, the number 1 ranked Financials (XLF) outperformed the S&P 500 by nearly 20%.
*For additional background on the ETF ranking system see NTSM Page at…
Energy (XLE) was #1. The markets are due for some reversion so perhaps I’ll get a better buying opportunity later.  I’ll wait before adding any positions. (I hold XLK, DVY and SPY. DVY is a dividend play. SPY is a good core holding.)
 
Under my system in 2017, Technology (XLK) was ranked in the top 3 Momentum Plays for 52% of all trading days in 2017 (if I counted correctly.) XLK was up 35% on the year.
 
TODAY’S RANKING OF THE DOW 30 STOCKS (Ranked Daily)

The top ranked stock receives 100%. The rest are then ranked based on their momentum relative to the leading stock. 
 
Caterpillar remained #1.
I hold Intel – I’m waiting for a better entry point before adding other positions. Intel is now a value play so I am holding it. Avoid GE and Merck. Their 120-day moving averages are falling.
*I rank the Dow 30 similarly to the ETF ranking system. For more details, see NTSM Page at…
 
MONDAY MARKET INTERNALS (NYSE DATA)
Market Internals remained Positive on the market. (Market Internals are based on a package of internals and all must be positive to create a positive indication. At this point, they look too good.) 
Market Internals are a decent trend-following analysis of current market action, but should not be used alone for short term trading. They are usually right, but they are often late.  They are most useful when they diverge from the Index.  In 2014, using these internals alone would have made a 9% return vs. 13% for the S&P 500 (in on Positive, out on Negative – no shorting). 
 
LONG TERM INDICATOR                                                        
Monday, Price indicator was positive; Sentiment was negative; Volume & VIX indicators were neutral.  With VIX recently below 10 for a couple of days each month from May thru December 2017, and now January 2018, VIX may be prone to incorrect signals. Usually, a rising VIX is a bad market sign; now it may move up, but that might just signal normalization of VIX, i.e., VIX and the Index may both rise. As an indicator, VIX is out of the picture for a while. VIX below 10 last occurred about 4-months before the year 2007 crash and also several months before the 2001 crash. 6-months with VIX below 10 is unprecedented in the last 20-years.
MY INVESTED STOCK POSITION:
TSP (RETIREMENT ACCOUNT – GOV EMPLOYEES) ALLOCATION
I increased stock allocation to 50% stocks in the S&P 500 Index fund (C-Fund) 24 March 2017 in my long-term accounts, based on short-term indicators. The remainder is 50% G-Fund (Government securities). This is a conservative retiree allocation, but I consider it fully invested for my situation.

Friday, January 5, 2018

Payroll Report … Factory Orders … ISM Services … Stock Market Analysis … ETF Trading … Dow 30 Ranking

PAYROLL REPORT (Bloomberg)
“Employers added 148,000 workers, compared with the 190,000 median estimate of economists surveyed by Bloomberg, held back by a drop in retail positions, a Labor Department report showed Friday. The jobless rate was at 4.1 percent for a third month, while average hourly earnings increased by 2.5 percent from a year earlier, after a 2.4 percent gain in November that was revised downward.” Story at…
My cmt: The Unemployment rate is now 4.1%. A friend who is an MBA told me that he was taught that 4% was as low as the employment rate can go. In other words, we are very close to maximum employment.
 
FACTORY ORDERS (Morningstar)
“Sales at U.S factories rose steadily in November, suggesting the strengthening U.S. and global economies are boosting demand for American goods.
Factory orders, reflecting sales of everything from paper to bulldozers, increased 1.3% in November from a month earlier…” Story at…
 
ISM SERVICES
“…the ISM gauge on the vast U.S. services sector unexpectedly fell for a second straight month in December to 55.9 from 57.4 in November… “You are still seeing growth,” Nieves [Anthony Nieves, chair of the Institute for Supply Management’s non-manufacturing business survey committee] said on a conference call with reporters after ISM released its non-manufacturing activity data for December earlier.” Story at…
 
MARKET REPORT / ANALYSIS         
-Friday the S&P 500 was up about 0.7% to 2743.
-VIX was unchanged at 9.22.
-The yield on the 10-year Treasury dipped slightly to 2.477%.
 
My sum of 17 Indicators improved from +5 to +6 today. On a 10-day basis, values were flat. A “+” number means that most indicators are bullish.
 
In the last 5-years, the S&P 500 has never outperformed Utilities (XLU) as much as now. Utilities are a safe haven so this is a sign of complacency in the markets. Conversely, XLI (Cyclical Industrials) are outperforming the S&P 500, but not at an extreme. Cyclicals don’t do as well vs the S&P 500 if investors are worried. Currently, no one is worried. The extreme low VIX (below 10) is more evidence of complacency.
 
More topping indicators are negative today: Bollinger Bands remain “overbought”, a sell signal for this indicator; RSI is overbought which is now a sell signal and so is the Overbought-Oversold ratio.  The S&P 500 is 10.2% above its 200-day moving average and that is a sell signal too. Today was another statistically-significant up-day suggesting a down day for tomorrow about 60% of the time. If this isn’t a top, there will be one soon. It may be a short-term top or a bigger problem we don’t know.
 
I am bearish short-term; longer term I am a bull, but I recommend caution with the Fed raising rates and shrinking its balance sheet. In addition, we are due for a correction in 2018 due to Presidential election cycle history.
 
TODAY’S RANKING OF  15 ETFs (Ranked Daily)

The top ranked ETF receives 100%. The rest are then ranked based on their momentum relative to the leading ETF.  While momentum isn’t stock performance per se, momentum is closely related to stock performance. For example, over the 4-months from Oct thru mid-February 2016, the number 1 ranked Financials (XLF) outperformed the S&P 500 by nearly 20%.
*For additional background on the ETF ranking system see NTSM Page at…
Energy (XLE) was #1. The markets are due for some reversion so perhaps I’ll get a better buying opportunity later.  I’ll wait before adding any positions. (I hold XLK, DVY and SPY. DVY is a dividend play. SPY is a good core holding.)
 
Under my system in 2017, Technology (XLK) was ranked in the top 3 Momentum Plays for 52% of all trading days in 2017 (if I counted correctly.) XLK was up 35% on the year. Its weighted Average PE is 23.7.
 
TODAY’S RANKING OF THE DOW 30 STOCKS (Ranked Daily)

The top ranked stock receives 100%. The rest are then ranked based on their momentum relative to the leading stock. 
 
Caterpillar remained #1.
I hold Intel – I’m waiting for a better entry point before adding other positions. Intel is now a value play so I am holding it. 
 
Avoid GE and Merck. Their 120-day moving averages are falling.
*I rank the Dow 30 similarly to the ETF ranking system. For more details, see NTSM Page at…
 
FRIDAY MARKET INTERNALS (NYSE DATA)
Market Internals improved to Positive on the market. (Market Internals are based on a package of internals and all must be positive to create a positive indication.
Market Internals are a decent trend-following analysis of current market action, but should not be used alone for short term trading. They are usually right, but they are often late.  They are most useful when they diverge from the Index.  In 2014, using these internals alone would have made a 9% return vs. 13% for the S&P 500 (in on Positive, out on Negative – no shorting). 
 
LONG TERM INDICATOR                                                        
Friday, Price indicator was positive; Sentiment was negative; Volume & VIX indicators were neutral.  With VIX recently below 10 for a couple of days each month from May thru December 2017, and now January 2018, VIX may be prone to incorrect signals. Usually, a rising VIX is a bad market sign; now it may move up, but that might just signal normalization of VIX, i.e., VIX and the Index may both rise. As an indicator, VIX is out of the picture for a while. VIX below 10 last occurred about 4-months before the year 2007 crash and also several months before the 2001 crash. 6-months with VIX below 10 is unprecedented in the last 20-years.
MY INVESTED STOCK POSITION:
TSP (RETIREMENT ACCOUNT – GOV EMPLOYEES) ALLOCATION
I increased stock allocation to 50% stocks in the S&P 500 Index fund (C-Fund) 24 March 2017 in my long-term accounts, based on short-term indicators. The remainder is 50% G-Fund (Government securities). This is a conservative retiree allocation, but I consider it fully invested for my situation.

Thursday, January 4, 2018

ADP Employment … Jobless Claims … Crude Inventories … Stock Market Analysis … ETF Trading … Dow 30 Ranking

ADP EMPLOYMENT (USA Today)
“Payroll processor ADP said Thursday the private sector added 250,000 jobs in December, possibly heralding a third straight month of strong gains in the government’s closely watched employment survey.” Story at…
 
JOBLESS CLAIMS (NASDAQ.com)
“The report said initial jobless claims edged up to 250,000, an increase of 3,000 from the previous week's revised level of 247,000…’The bottom line is that claims remain at an unusually low level, providing more evidence of labor market strength’….” Story at…
 
CRUDE INVENTORIES (oilPrice.com)
“The American Petroleum Institute (API) reported a draw of 4.992 million barrels of United States crude oil inventories for the week ending December 29, marking five large draws in as many weeks.” Story at…
 
MARKET REPORT / ANALYSIS         
-Thursday the S&P 500 was up about 0.4% to 2724.
-VIX was down about 1% to 9.22.
-The yield on the 10-year Treasury rose slightly to 2.454%.
 
Some topping indicators remain stretched and today Bollinger Bands signaled “overbought”, a sell signal for this indicator. I like to use this with RSI which is not yet overbought.  The S&P 500 is 9.5% above its 200-day moving average. (Sell signal would be in the 10-15% range.)
 
The simplest topping indicator is to count the number of days that are up in a given time period. Looking at the last 20-days only 12-days have been up and that is a benign number that is not warning of a top.
 
My sum of 17 Indicators improved from +0 to +5 today. On a 10-day basis, values dipped a little. A “+” number means that most indicators are bullish.
 
I am neutral short-term; longer term I am a bull, but I recommend caution with the Fed raising rates and shrinking its balance sheet. Historically, we are due for a correction in 2018 due to the Presidential election cycle.
 
TODAY’S RANKING OF  15 ETFs (Ranked Daily)

The top ranked ETF receives 100%. The rest are then ranked based on their momentum relative to the leading ETF.  While momentum isn’t stock performance per se, momentum is closely related to stock performance. For example, over the 4-months from Oct thru mid-February 2016, the number 1 ranked Financials (XLF) outperformed the S&P 500 by nearly 20%.
*For additional background on the ETF ranking system see NTSM Page at…
Energy (XLE) was #1. The markets are due for some reversion so perhaps I’ll get a better buying opportunity later.  I’ll wait before adding any positions. (I hold XLK, DVY and SPY. DVY is a dividend play. SPY is a good core holding.)
 
Under my system in 2017, Technology (XLK) was ranked in the top 3 Momentum Plays for 52% of all trading days in 2017 (if I counted correctly.) XLK was up 35% on the year. Its weighted Average PE is 23.7.
 
TODAY’S RANKING OF THE DOW 30 STOCKS (Ranked Daily)

The top ranked stock receives 100%. The rest are then ranked based on their momentum relative to the leading stock. 
 
Caterpillar remained #1.
I hold Intel – I’m waiting for a better entry point before adding other positions.  Intel slipped to #6 based on Intel’s perceived problems. Intel was down more than 3% Wednesday on reports that its chips contained serious security flaws and others did not. Intel made the following statement later Wednesday:
Intel is committed to product and customer security and is working closely with many other technology companies, including AMD, ARM Holdings and several operating system vendors, to develop an industry-wide approach to resolve this issue promptly and constructively. Intel and other vendors had planned to disclose this issue next week when more software and firmware updates will be available.
From Intel’s statement this appears to be a much wider problem that is not confined only to Intel. They further stated that there was no material impact on Intel's business.
 
Avoid GE and Merck. Their 120-day moving averages are falling.
*I rank the Dow 30 similarly to the ETF ranking system. For more details, see NTSM Page at…
 
THURSDAY MARKET INTERNALS (NYSE DATA)
Market Internals remained Neutral on the market. (Market Internals are based on a package of internals and all must be positive to create a positive indication.)
Market Internals are a decent trend-following analysis of current market action, but should not be used alone for short term trading. They are usually right, but they are often late.  They are most useful when they diverge from the Index.  In 2014, using these internals alone would have made a 9% return vs. 13% for the S&P 500 (in on Positive, out on Negative – no shorting). 
 
LONG TERM INDICATOR                                                        
Thursday, Price indicator was positive; Sentiment was negative; Volume & VIX indicators were neutral.  With VIX recently below 10 for a couple of days each month from May thru December 2017, and now January 2018, VIX may be prone to incorrect signals. Usually, a rising VIX is a bad market sign; now it may move up, but that might just signal normalization of VIX, i.e., VIX and the Index may both rise. As an indicator, VIX is out of the picture for a while. VIX below 10 last occurred about 4-months before the year 2007 crash and also several months before the 2001 crash. 6-months with VIX below 10 is unprecedented in the last 20-years.
MY INVESTED STOCK POSITION:
TSP (RETIREMENT ACCOUNT – GOV EMPLOYEES) ALLOCATION
I increased stock allocation to 50% stocks in the S&P 500 Index fund (C-Fund) 24 March 2017 in my long-term accounts, based on short-term indicators. The remainder is 50% G-Fund (Government securities). This is a conservative retiree allocation, but I consider it fully invested for my situation.

Wednesday, January 3, 2018

ISM Index … Construction Spending … FOMC Minutes … Auto Sales... Regression to Ttrend … Stock Market Analysis … ETF Trading … Dow 30 Ranking

ISM INDEX (Investors Business Daily)
“The Institute for Supply Management's manufacturing survey index out Wednesday rose to 59.7 from November's 58.2, as the factory sector's run of strong growth showed no sign of letting up.” Story at…
 
CONSTRUCTION SPENDING (USA Today)
“U.S. builders spent 0.8% more on construction projects in November, the fourth consecutive monthly gain…The increase brought total construction spending for the month to a seasonally-adjusted annual rate of $1.26 trillion, an all-time high.
 
FOMC MINUTES (Reuters)
“Most participants reiterated their support for continuing a gradual approach to raising the target range, noting that this approach helped to balance risks to the outlook for economic activity and inflation,” the Fed said in the minutes.” Story at…
 
AUTO SALES (USA Today)
“The industry fell short of 2016's record 17.6 million vehicles sold, as well as 2015's previous record of 17.5 million. The industry is cooling off as Americans are keeping high-quality, recently purchased vehicles longer.” Story at…
 
REGRESSION TO TREND CONTINUES TO WARN OF TROUBLE (Advisor Perspectives)
Chart from…
My cmt: I added a trend line in red to the lower “Variance from Trend” graph at the bottom of the above chart. It seems to suggest we may get above 150% variance before a significant downturn.
 
Just my guess, but I think we could see a correction anytime, assuming indicators don’t go up forever.
 
MARKET REPORT / ANALYSIS         
-Wednesday the S&P 500 was up about 0.6% to 2713.
-VIX was down about 6% to 9.15.
-The yield on the 10-year Treasury slipped to 2.4454%.
 
Topping indicators remain stretched: The S&P 500 is 9.2% above its 200-day moving average. (Sell signal would be in the 10-15% range.) RSI and Bollinger Bands are also stretched. None of the topping indicators are extreme enough to give sell signals; except for Breadth vs. S&P 500 which was negative around Christmas. It has since gone neutral.
 
Again, today was statistically significant. That just means that the price-volume move up exceeded statistical parameters that I track. The stats show that about 60% of the time a statistically significant move up will be followed by a down day the next day. I think the move needs to be greater than 1% to give a good signal.
 
My sum of 17 Indicators declined from +6 to +0 today. On a 10-day basis, values dipped too. A “+” number means that most indicators are bullish. At 0, indicators were neutral at today’s close.
 
I suspect if we see a >1% up-day, it is likely to signal a short-term top if a few other topping indicators (RSI, Bollinger Bands or % above 200-dMA) join in with sell signals.
 
I am neutral short-term; longer term I am a bull, but I recommend caution with the Fed raising rates and shrinking its balance sheet. This party could end sometime in 2018; further, historically we are due for a correction in 2018 due to the Presidential election cycle.
 
TODAY’S RANKING OF  15 ETFs (Ranked Daily)
The top ranked ETF receives 100%. The rest are then ranked based on their momentum relative to the leading ETF.  While momentum isn’t stock performance per se, momentum is closely related to stock performance. For example, over the 4-months from Oct thru mid-February 2016, the number 1 ranked Financials (XLF) outperformed the S&P 500 by nearly 20%.
*For additional background on the ETF ranking system see NTSM Page at…
Energy (XLE) was #1. The markets are due for some reversion so perhaps I’ll get a better buying opportunity later.  I’ll wait before adding any positions. (I hold XLK, DVY and SPY. DVY is a dividend play. SPY is a good core holding.)
 
Under my system in 2017, Technology (XLK) was ranked in the top 3 Momentum Plays for 52% of all trading days in 2017 (if I counted correctly.) XLK was up 35% on the year. Its weighted Average PE is 23.7.
 
TODAY’S RANKING OF THE DOW 30 STOCKS (Ranked Daily)
The top ranked stock receives 100%. The rest are then ranked based on their momentum relative to the leading stock. 
 
Caterpillar remained #1. (I hold Intel – I’m waiting for a better entry point before adding other positions.  At this point, Intel is a value play.)
Avoid GE and Merck. Their 120-day moving averages are falling.
*I rank the Dow 30 similarly to the ETF ranking system. For more details, see NTSM Page at…
 
WEDNESDAY MARKET INTERNALS (NYSE DATA)
Market Internals remained Neutral on the market. (Market Internals are based on a package of internals and all must be positive to create a positive indication. Internals deteriorated today on a 10-day basis. (Translation: Internals are worse than they were 10-days ago.)
Market Internals are a decent trend-following analysis of current market action, but should not be used alone for short term trading. They are usually right, but they are often late.  They are most useful when they diverge from the Index.  In 2014, using these internals alone would have made a 9% return vs. 13% for the S&P 500 (in on Positive, out on Negative – no shorting). 
 
LONG TERM INDICATOR                                                        
Wednesday, Price indicator was positive; Sentiment was negative; Volume & VIX indicators were neutral.  With VIX recently below 10 for a couple of days each month from May thru December 2017, and now January 2018, VIX may be prone to incorrect signals. Usually, a rising VIX is a bad market sign; now it may move up, but that might just signal normalization of VIX, i.e., VIX and the Index may both rise. As an indicator, VIX is out of the picture for a while. VIX below 10 last occurred about 4-months before the year 2007 crash and also several months before the 2001 crash. 6-months with VIX below 10 is unprecedented in the last 20-years.
MY INVESTED STOCK POSITION:
TSP (RETIREMENT ACCOUNT – GOV EMPLOYEES) ALLOCATION
I increased stock allocation to 50% stocks in the S&P 500 Index fund (C-Fund) 24 March 2017 in my long-term accounts, based on short-term indicators. The remainder is 50% G-Fund (Government securities). This is a conservative retiree allocation, but I consider it fully invested for my situation.
Tuesday, January 2, 2018

Stock Market Analysis … ETF Trading … Dow 30 Ranking

MARKET REPORT / ANALYSIS         
-Tuesday the S&P 500 was up about 0.8% to 2696.
-VIX was down about 12% to 9.77.
-The yield on the 10-year Treasury was little changed at 2.463%.
 
Utilities are underperforming the S&P 500 by an extreme amount – this is a negative sign, but it is not a great timing indicator since it could be months before we get a drop. The last time the spread was this negative it marked a top followed by a small drop.  The time before that (in Aug of 2016) there was a 5% drop. In Feb 2016 it marked a top followed by a 13% drop. In March of 2015 there was another signal equal to the one we see now and the markets were range bound for 6-months before an 11% correction took hold. So three of the four signals in recent years have been timely; in 2015 it was not. This indicator is not in my summary of 17-indicators, but perhaps it should be.
 
There are other topping indicators that are also stretched: The S&P 500 is 8.5% above its 200-day moving average. RSI and Bollinger Bands are also stretched. None of these three indicators are extreme enough to give sell signals - yet.
 
Today was statistically significant. That just means that the price-volume move up exceeded statistical parameters that I track. The stats show that about 60% of the time a statistically significant move up will be followed by a down day the next day.
 
My sum of 17 Indicators improved from +4 to +6. On a 10-day basis, values moved up again. A “+” number means that most indicators are bullish – perhaps too bullish. Volume picked up a little to about 75% of the norm for the month.
 
In the near term I am mildly bullish; longer term I am a bull, but I recommend caution with the Fed raising rates and shrinking its balance sheet. This party could end sometime in 2018; further, historically we are due for a correction in 2018 due to the Presidential election cycle.
 
TODAY’S RANKING OF  15 ETFs (Ranked Daily)
The top ranked ETF receives 100%. The rest are then ranked based on their momentum relative to the leading ETF.  While momentum isn’t stock performance per se, momentum is closely related to stock performance. For example, over the 4-months from Oct thru mid-February 2016, the number 1 ranked Financials (XLF) outperformed the S&P 500 by nearly 20%.
*For additional background on the ETF ranking system see NTSM Page at…
Energy (XLE) was #1. The markets are due for some reversion so perhaps I’ll get a better buying opportunity later.  I’ll wait before adding any positions. (I hold XLK, DVY and SPY. DVY is a dividend play. SPY is a good core holding.)
 
Under my system in 2017, Technology (XLK) was ranked in the top 3 Momentum Plays for 52% of all trading days in the year (if I counted correctly.) XLK is up 35% year to date. Its weighted Average PE is 23.7.
 
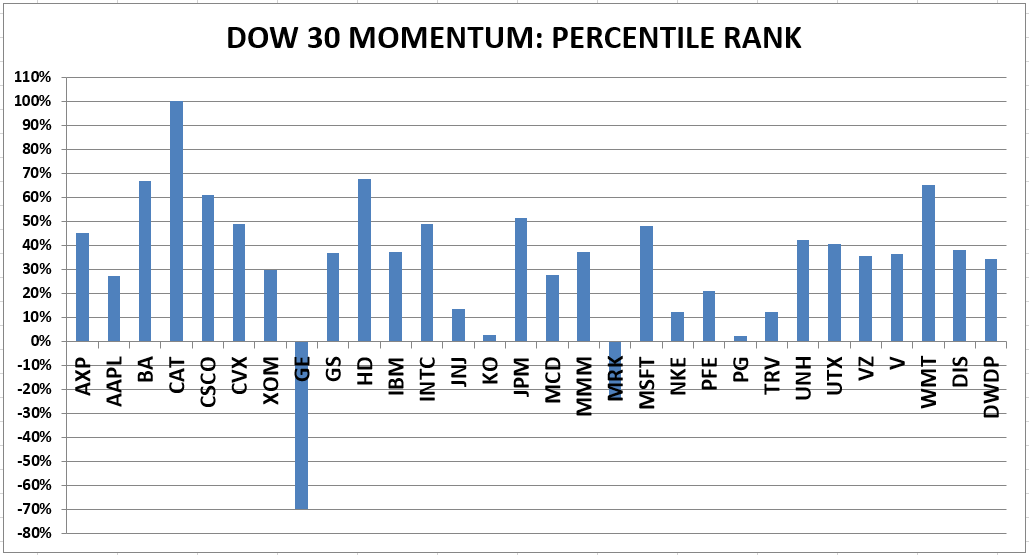
TODAY’S RANKING OF THE DOW 30 STOCKS (Ranked Daily)

The top ranked stock receives 100%. The rest are then ranked based on their momentum relative to the leading stock. 
 
Caterpillar remained #1. (I hold Intel – I’m waiting for a better entry point before adding other positions.)
Avoid GE and Merck. Their 120-day moving averages are falling.
*I rank the Dow 30 similarly to the ETF ranking system. For more details, see NTSM Page at…
 
TUESDAY MARKET INTERNALS (NYSE DATA)
Market Internals remained Neutral on the market. (Market Internals are based on a package of internals and all must be positive to create a positive indication.
Market Internals are a decent trend-following analysis of current market action, but should not be used alone for short term trading. They are usually right, but they are often late.  They are most useful when they diverge from the Index.  In 2014, using these internals alone would have made a 9% return vs. 13% for the S&P 500 (in on Positive, out on Negative – no shorting). 
 
LONG TERM INDICATOR                                                        
Tuesday, Price indicator was positive; Sentiment was negative; Volume & VIX indicators were neutral.  With VIX recently below 10 for a couple of days in May, June, July, August, September, October, November and December, VIX may be prone to incorrect signals. Usually, a rising VIX is a bad market sign; now it may move up, but that might just signal normalization of VIX, i.e., VIX and the Index may both rise. As an indicator, VIX is out of the picture for a while. VIX below 10 last occurred about 4-months before the year 2007 crash and also several months before the 2001 crash.
MY INVESTED STOCK POSITION:
TSP (RETIREMENT ACCOUNT – GOV EMPLOYEES) ALLOCATION
I increased stock allocation to 50% stocks in the S&P 500 Index fund (C-Fund) 24 March 2017 in my long-term accounts, based on short-term indicators. The remainder is 50% G-Fund (Government securities). This is a conservative retiree allocation, but I consider it fully invested for my situation.