Thursday, April 8, 2021

Jobless Claims … Pullback in Stocks Coming ... Coronavirus (Covid-19) … Stock Market Analysis … ETF Trading … Dow 30 Ranking

“Trade what you see; not what you think.” – The Old Fool, Richard McCranie, trader extraordinaire.


“The big money is not in the buying and selling. But in the waiting.” - Charlie Munger, Vice Chairman, Berkshire Hathaway


“In my decades of investing experience, I have not seen such mindless and uninformed speculation as I have witnessed recently. Indeed, in nominal dollar terms...it is far in excess of the dot.com boom.” – Doug Cass.

JOBLESS CLAIMS (APNews)

“The number of Americans applying for unemployment benefits rose last week to 744,000, signaling that many employers are still cutting jobs even as more people are vaccinated against COVID-19, consumers gain confidence and the government distributes aid throughout the economy.” Story at...

https://apnews.com/article/jobless-claims-unemployment-health-coronavirus-pandemic-layoffs-d609c0c7d9fa04a0a395c4fea53e2899


WHY A PULLBACK MAY BE FAST APPROACHING (MarketWatch)

“As growth peaks over the next three months, we expect discretionary investors to pare their positioning from extremely elevated levels, and see retail investors as unlikely to buy the dip. Using the historical experience as a guide argues for a near -6% pullback if growth flattens out near the peak, a bigger -8.4% pullback on an inverted-V in growth,” said strategists led by Binky Chadha. From there, though, equities may rally back...” Story at...

https://www.msn.com/en-us/money/markets/why-a-pullback-for-stocks-might-be-fast-approaching-according-to-deutsche-bank/ar-BB1fo6o9?ocid=msedgdhp


CORONAVIRUS (NTSM)

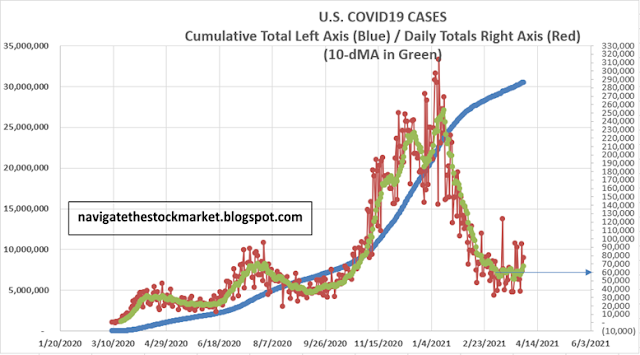
Here’s the latest from the COVID19 Johns Hopkins website as of 5:00pm Thursday. US total case numbers are on the left axis; daily numbers are on the right side of the graph with the 10-dMA of daily numbers in Green.


MARKET REPORT / ANALYSIS

-Thursday the S&P 500 rose about 0.4% to 4097.

-VIX dipped about 1% to 16.95.

-The yield on the 10-year Treasury fell to 1.629%.


Bollinger Bands are very close to overbought today and so is RSI. They are not overbought yet. The S&P 500 is 14.7% above its 200-dM. We seem to be nearing a short-term top. It doesn’t feel like a major top. I worry about late summer or fall as a possible rally end.


We are not at the upper trend line yet.  S&P 500 could reach the 4150 - 4200 zone if we continue to see good internals.


The daily sum of 20 Indicators remained +10 (a positive number is bullish; negatives are bearish); the 10-day smoothed sum that smooths the daily fluctuations improved from +18 to +36 (These numbers sometimes change after I post the blog based on data that comes in late.) Most of these indicators are short-term and many are trend following.


The Long Term NTSM indicator ensemble remained BUY. Price, VIX & Volume are bullish; Sentiment is neutral.


I remain Bullish, but I will pay attention and consider cutting stock allocation back to 50% if we see too many negative signs.


MOMENTUM ANALYSIS:

TODAY’S RANKING OF 15 ETFs (Ranked Daily)

The top ranked ETF receives 100%. The rest are then ranked based on their momentum relative to the leading

ETF.

*For additional background on the ETF ranking system see NTSM Page at…

http://navigatethestockmarket.blogspot.com/p/exchange-traded-funds-etf-ranking.html


TODAY’S RANKING OF THE DOW 30 STOCKS (Ranked Daily)

Here’s the revised DOW 30 and its momentum analysis. The top ranked stock receives 100%. The rest are then ranked based on their momentum relative to the leading stock.

For more details, see NTSM Page at…

https://navigatethestockmarket.blogspot.com/p/a-system-for-trading-dow-30-stocks-my_8.html


THURSDAY MARKET INTERNALS (NYSE DATA)

Market Internals remained BULLISH on the market.


Market Internals are a decent trend-following analysis of current market action, but should not be used alone for short term trading. They are usually right, but they are often late.  They are most useful when they diverge from the Index. 


Using the Short-term indicator in 2018 in SPY would have made a 5% gain instead of a 6% loss for buy-and-hold. The methodology was Buy on a POSITIVE indication and Sell on a NEGATIVE indication and stay out until the next POSITIVE indication. The back-test included 13-buys and 13-sells, or a trade every 2-weeks on average.  

As of 9 March, my stock-allocation is about 60% invested in stocks. You may wish to have a higher or lower % invested in stocks depending on your risk tolerance. 50% is a conservative position that I consider fully invested for most retirees.


As a retiree, 50% in the stock market is about fully invested for me – it is a cautious and conservative number. If I feel very confident, I might go to 60%; if a correction is deep enough, and I can call a bottom, 80% would not be out of the question.


The markets have not retested the lows on recent corrections and that left me under-invested on the bounces. I will need to put less reliance on retests in the future.

Wednesday, April 7, 2021

FOMC Minutes ... EIA Crude Inventories ... The Case for Libel Reform … Coronavirus (Covid-19) … Stock Market Analysis … ETF Trading … Dow 30 Ranking

“Trade what you see; not what you think.” – The Old Fool, Richard McCranie, trader extraordinaire.


“The big money is not in the buying and selling. But in the waiting.” - Charlie Munger, Vice Chairman, Berkshire Hathaway


“In my decades of investing experience, I have not seen such mindless and uninformed speculation as I have witnessed recently. Indeed, in nominal dollar terms...it is far in excess of the dot.com boom.” – Doug Cass.


FOMC MINUTES (CNBC)

“The meeting summary indicated that while officials saw the economy gaining substantially, they see much more progress needed before ultra-easy policy changes. Members said the $120 billion a month in bond purchases “were providing substantial support to the economy. Participants noted that it would likely be some time until substantial further progress toward the Committee’s maximum-employment and price-stability goals would be realized and that, consistent with the Committee’s outcome-based guidance, asset purchases would continue at least at the current pace until then.” Story at...

https://www.cnbc.com/2021/04/07/federal-reserve-minutes-from-march-meeting-.html


EIA CRUDE INVENTORIES (EIA)

“U.S. commercial crude oil inventories (excluding those in the Strategic Petroleum Reserve) decreased by 3.5 million barrels from the previous week. At 498.3 million barrels, U.S. crude oil inventories are about 3% above the five year average for this time of year.” Press release at...

https://ir.eia.gov/wpsr/wpsrsummary.pdf


THE PROGRESSIVE CASE FOR LIBEL REFORM (WSJ)

“Judge Laurence Silberman recently urged the Supreme Court to overturn New York Times v. Sullivan (1964), the landmark decision that severely curtails the ability of public officials and (under later precedents) public figures to secure damages for lies about them. Judge Silberman is a conservative, but progressives should join him in calling for a reconsideration of Sullivan. Reforming speech law may be our best chance to confront America’s escalating crisis of truth as algorithmically charged echo chambers exploit cognitive biases, and the sheer volume of digital content makes fact-checking impossible.” – Jeremy Lewin, 2nd Year Harvard Law student. Commentary at...

https://www.wsj.com/articles/the-progressive-case-for-libel-reform-11617638828


CORONAVIRUS (NTSM)

Here’s the latest from the COVID19 Johns Hopkins website as of 5:45pm Wednesday. US total case numbers are on the left axis; daily numbers are on the right side of the graph with the 10-dMA of daily numbers in Green.


MARKET REPORT / ANALYSIS

-Wednesday the S&P 500 rose about 0.2% to 4080.

-VIX dipped about 5% to 17.16.

-The yield on the 10-year Treasury rose to 1.674%.


Bollinger Bands are very close to overbought today; RSI is not, so for now, I’ll ignore the Bollinger Band warning. Top Indicators have improved and the only Top Indicator warning today is: The S&P 500 is 14.4% above its 200-dM.


The daily sum of 20 Indicators improved from +8 to +10 (a positive number is bullish; negatives are bearish); the 10-day smoothed sum that smooths the daily fluctuations improved from +2 to +18 (These numbers sometimes change after I post the blog based on data that comes in late.) Most of these indicators are short-term and many are trend following.


The Long Term NTSM indicator ensemble remained BUY. Price, VIX & Volume are bullish; Sentiment is neutral.


I remain Bullish, but I will pay attention and consider cutting stock allocation back to 50% if we see too many negative signs.


MOMENTUM ANALYSIS:

TODAY’S RANKING OF 15 ETFs (Ranked Daily)

The top ranked ETF receives 100%. The rest are then ranked based on their momentum relative to the leading

ETF.

*For additional background on the ETF ranking system see NTSM Page at…

http://navigatethestockmarket.blogspot.com/p/exchange-traded-funds-etf-ranking.html


TODAY’S RANKING OF THE DOW 30 STOCKS (Ranked Daily)

Here’s the revised DOW 30 and its momentum analysis. The top ranked stock receives 100%. The rest are then ranked based on their momentum relative to the leading stock.

For more details, see NTSM Page at…

https://navigatethestockmarket.blogspot.com/p/a-system-for-trading-dow-30-stocks-my_8.html


WEDNESDAY MARKET INTERNALS (NYSE DATA)

Market Internals remained BULLISH on the market.


Market Internals are a decent trend-following analysis of current market action, but should not be used alone for short term trading. They are usually right, but they are often late.  They are most useful when they diverge from the Index. 


Using the Short-term indicator in 2018 in SPY would have made a 5% gain instead of a 6% loss for buy-and-hold. The methodology was Buy on a POSITIVE indication and Sell on a NEGATIVE indication and stay out until the next POSITIVE indication. The back-test included 13-buys and 13-sells, or a trade every 2-weeks on average.   

As of 9 March, my stock-allocation is about 60% invested in stocks. You may wish to have a higher or lower % invested in stocks depending on your risk tolerance. 50% is a conservative position that I consider fully invested for most retirees.


As a retiree, 50% in the stock market is about fully invested for me – it is a cautious and conservative number. If I feel very confident, I might go to 60%; if a correction is deep enough, and I can call a bottom, 80% would not be out of the question.


The markets have not retested the lows on recent corrections and that left me under-invested on the bounces. I will need to put less reliance on retests in the future.

Tuesday, April 6, 2021

JOLTS Job Openings … Calling for a Major Top in the Stock Market ... Coronavirus (Covid-19) … Stock Market Analysis … ETF Trading … Dow 30 Ranking

“Trade what you see; not what you think.” – The Old Fool, Richard McCranie, trader extraordinaire.


“The big money is not in the buying and selling. But in the waiting.” - Charlie Munger, Vice Chairman, Berkshire Hathaway


“In my decades of investing experience, I have not seen such mindless and uninformed speculation as I have witnessed recently. Indeed, in nominal dollar terms...it is far in excess of the dot.com boom.” – Doug Cass.


“This isn’t a bull market or a bear market. It’s a know-nothing market. Bragging rights used to go to those investors who worked the hardest at learning the most. Now the glory often goes to those who know the least and don’t even care.” Jason Zweig.


JOLTS JOB OPENINGS (Reuters)

“U.S. job openings rose to a two-year high in February while hiring picked up as strengthening domestic demand amid increased COVID-19 vaccinations and additional pandemic aid from the government boost companies’ needs for more workers...Job openings, a measure of labor demand, increased 268,000 to 7.4 million as of the last day of February.” Story at... 

https://www.reuters.com/article/us-usa-economy/u-s-job-openings-jump-to-two-year-high-in-february-idUSKBN2BT1TY?il=0


CALLING A MAJOR TOP: APRIL-JUNE (McClellan Financial Publications)

“It is now officially April, and in past posts I have noted that the leading indication message from crude has called for a stock market top due in April 2021...Sometimes the turns come early, sometimes late...We therefore have to turn to shorter term indicators to polish this message to a more precise degree...a top sometime this summer is reasonable to expect, and that would not be too far off from crude oil’s message for a top ideally due in April.” Commentary at...

https://www.mcoscillator.com/learning_center/weekly_chart/clarifying_oils_10-year_message_for_stocks/


SIGNIFICANT STOCK MARKET CONSOLIDATION (Yahoo Finance)

"Very near term, we expect equities to continue to be well supported by the acceleration in macro growth, and see buying by systematic strategies and buybacks driving a grind higher. But we expect a significant consolidation (-6% to -10%) as growth peaks over the next three months," Chadha wrote in a new research note on Tuesday.” Story at...

https://finance.yahoo.com/news/a-significant-stock-market-consolidation-may-only-be-months-away-deutsche-bank-173851762.html


INVESTORS REMAIN EXUBERANT (RIA)

“We remain “bullish” on the markets currently as momentum is still in play. However, it is likely that by mid-summer we will see a decent correction as the “peak” in the economic and earnings data becomes visible.” Commentary at...

https://realinvestmentadvice.com/technically-speaking-despite-correction-investors-are-exuberant/


CORONAVIRUS (NTSM)

Here’s the latest from the COVID19 Johns Hopkins website as of 8:00pm Tuesday. US total case numbers are on the left axis; daily numbers are on the right side of the graph with the 10-dMA of daily numbers in Green.


MARKET REPORT / ANALYSIS

-Tuesday the S&P 500 dipped about 0.1% to 4074.

-VIX rose about 1% to 18.12.

-The yield on the 10-year Treasury rose to 1.665%.


Bollinger Bands were again overbought today; RSI is not, so for now, I’ll ignore the Bollinger Band warning. We do see an issue with Top Indicators.


A number of Pros calling for a stock market pullback in the near to mid-term (now, or out a few months). My system is starting to warn, too. There are currently 3 Top Indicators: (1) The S&P 500 is 14.3% above its 200-dM. The Index topped when this value hit 16% last September; (2) Bollinger Bands (3) Smart Money (late day action is overbought). This gives a -4 reading. -5 is the bear warning.


The daily sum of 20 Indicators improved from +7 to +8 (a positive number is bullish; negatives are bearish); the 10-day smoothed sum that smooths the daily fluctuations improved from -11 to +2 (These numbers sometimes change after I post the blog based on data that comes in late.) Most of these indicators are short-term and many are trend following.


The Long Term NTSM indicator ensemble remained BUY. Price & Volume are bullish; VIX & Sentiment are neutral.


I remain Bullish, but I am seeing more negative signs in top indicators, so I will pay attention and consider cutting stock allocation back to 50% if we see more negative signs.


MOMENTUM ANALYSIS:

TODAY’S RANKING OF 15 ETFs (Ranked Daily)

The top ranked ETF receives 100%. The rest are then ranked based on their momentum relative to the leading

ETF.

*For additional background on the ETF ranking system see NTSM Page at…

http://navigatethestockmarket.blogspot.com/p/exchange-traded-funds-etf-ranking.html


TODAY’S RANKING OF THE DOW 30 STOCKS (Ranked Daily)

Here’s the revised DOW 30 and its momentum analysis. The top ranked stock receives 100%. The rest are then ranked based on their momentum relative to the leading stock.

For more details, see NTSM Page at…

https://navigatethestockmarket.blogspot.com/p/a-system-for-trading-dow-30-stocks-my_8.html


TUESDAY MARKET INTERNALS (NYSE DATA)

Market Internals improved to BULLISH on the market.


Market Internals are a decent trend-following analysis of current market action, but should not be used alone for short term trading. They are usually right, but they are often late.  They are most useful when they diverge from the Index. 


Using the Short-term indicator in 2018 in SPY would have made a 5% gain instead of a 6% loss for buy-and-hold. The methodology was Buy on a POSITIVE indication and Sell on a NEGATIVE indication and stay out until the next POSITIVE indication. The back-test included 13-buys and 13-sells, or a trade every 2-weeks on average.  


As of 9 March, my stock-allocation is about 60% invested in stocks. You may wish to have a higher or lower % invested in stocks depending on your risk tolerance. 50% is a conservative position that I consider fully invested for most retirees.


As a retiree, 50% in the stock market is about fully invested for me – it is a cautious and conservative number. If I feel very confident, I might go to 60%; if a correction is deep enough, and I can call a bottom, 80% would not be out of the question.


The markets have not retested the lows on recent corrections and that left me under-invested on the bounces. I will need to put less reliance on retests in the future.


Monday, April 5, 2021

Factory Orders ... ISM Non-Manufacturing … Markit Services PMI ... Coronavirus (Covid-19) … Stock Market Analysis … ETF Trading … Dow 30 Ranking

“Trade what you see; not what you think.” – The Old Fool, Richard McCranie, trader extraordinaire.


“The big money is not in the buying and selling. But in the waiting.” - Charlie Munger, Vice Chairman, Berkshire Hathaway


“In my decades of investing experience, I have not seen such mindless and uninformed speculation as I have witnessed recently. Indeed, in nominal dollar terms...it is far in excess of the dot.com boom.” – Doug Cass.

FACTORY ORDERS (Reuters)

"New orders for U.S.-made goods fell in February, likely weighed down by unseasonably cold weather, though manufacturing remains strong as the economic recovery regains steam amid an improving public health situation and massive fiscal stimulus... The Commerce Department said on Monday that factory orders dropped 0.8%...” Story at...

https://www.reuters.com/article/usa-economy-manufacturing/u-s-factory-orders-decline-in-february-idUSL1N2LY0UN


ISM NON-MANUFACTURING (ISM via PrNewswire)

"The Services PMI® registered an all-time high of 63.7 percent, 8.4 percentage points higher than the February reading of 55.3 percent. The previous high was in October 2018, when the Services PMI® registered 60.9 percent. The March reading indicates the 10th straight month of growth for the services sector, which has expanded for all but two of the last 134 months." Press release at...

https://www.prnewswire.com/news-releases/services-pmi-at-63-7-march-2021-services-ism-report-on-business-301261804.html


MARKIT SERVICES PMI (Advisor Perspectives)

“The March US Services Purchasing Managers' Index conducted by Markit came in at 59.7 percent, down 0.1 from the final February estimate of 59.8... Commenting on the latest survey results, Chris Williamson, Chief Business Economist at IHS Markit, said: "The recent surge in service sector growth shows no sign of abating, with another impressive performance in March rounding off a quarter in which the PMI surveys indicate that the economy grew at an annualized rate of approximately 5%.”  Commentary and analysis at...

https://www.advisorperspectives.com/dshort/updates/2021/04/05/march-markit-services-pmi-fastest-rise-in-business-activity-since-july-2014-as-new-order-growth-reaches-six-year-high


AMERICANS WILL SPEND RECENT STIMULUS CHECK (Raymond James)

“The cover story for 2021 has been the better and quicker than expected economic recovery, but aggressive fiscal stimulus and accommodative monetary policy have been two key features in support of economic growth. Congress’ passage of a $1.9 trillion Rescue deal with potential plans for an infrastructure package later this year, combined with the Federal Reserve’s (Fed) reassurance that interest rates will be on hold through 2023 have contributed to consensus 2021 GDP estimates rising from 4.0% to 5.1% since the beginning of the year...”

Commentary at...

https://www.raymondjames.com/commentary-and-insights/larry-adam/2021/03/26/weekly-investment-strategy


CORONAVIRUS (NTSM)

Here’s the latest from the COVID19 Johns Hopkins website as of 8:15pm Monday. US total case numbers are on the left axis; daily numbers are on the right side of the graph with the 10-dMA of daily numbers in Green.


MARKET REPORT / ANALYSIS

-Monday the S&P 500 rose about 1.4% to 4078.

-VIX rose about 3% to 17.91.

-The yield on the 10-year Treasury dipped to 1.696%.


The S&P 500 made another new-high today and the % of new-highs on the NYSE was well above average which is good. Breadth remained good with the % of issues advancing on the NYSE now over 54% for the last 10-days.


If the S&P 500 is going straight up to 4100, I expect to see the Index go higher still.


Bollinger Bands were overbought today; RSI is a long way from overbought so, for now, I’ll ignore the Bollinger Band warning.


Today was a statistically significant up-day. That just means that the price-volume move exceeded my statistical parameters. Statistics show that a statistically-significant, up-day is followed by a down-day about 60% of the time.  Statistically-significant, up-days almost always coincide with tops, but not all statistically-significant, up-days occur at tops. It doesn’t look like the Bull is over yet.


The daily sum of 20 Indicators dipped from +8 to +7 (a positive number is bullish; negatives are bearish); the 10-day smoothed sum that smooths the daily fluctuations improved from -19 to -11 (These numbers sometimes change after I post the blog based on data that comes in late.) Most of these indicators are short-term and many are trend following.


The Long Term NTSM indicator ensemble remained BUY. Price, Volume & VIX are bullish; Sentiment is neutral.


I remain Bullish.


MOMENTUM ANALYSIS:

TODAY’S RANKING OF 15 ETFs (Ranked Daily)

The top ranked ETF receives 100%. The rest are then ranked based on their momentum relative to the leading

ETF.

*For additional background on the ETF ranking system see NTSM Page at…

http://navigatethestockmarket.blogspot.com/p/exchange-traded-funds-etf-ranking.html


TODAY’S RANKING OF THE DOW 30 STOCKS (Ranked Daily)

Here’s the revised DOW 30 and its momentum analysis. The top ranked stock receives 100%. The rest are then ranked based on their momentum relative to the leading stock.

For more details, see NTSM Page at…

https://navigatethestockmarket.blogspot.com/p/a-system-for-trading-dow-30-stocks-my_8.html


MONDAY MARKET INTERNALS (NYSE DATA)

Market Internals remained NEUTRAL on the market.


Market Internals are a decent trend-following analysis of current market action, but should not be used alone for short term trading. They are usually right, but they are often late.  They are most useful when they diverge from the Index. 


Using the Short-term indicator in 2018 in SPY would have made a 5% gain instead of a 6% loss for buy-and-hold. The methodology was Buy on a POSITIVE indication and Sell on a NEGATIVE indication and stay out until the next POSITIVE indication. The back-test included 13-buys and 13-sells, or a trade every 2-weeks on average.  


As of 9 March, my stock-allocation is about 60% invested in stocks. You may wish to have a higher or lower % invested in stocks depending on your risk tolerance. 50% is a conservative position that I consider fully invested for most retirees.


As a retiree, 50% in the stock market is about fully invested for me – it is a cautious and conservative number. If I feel very confident, I might go to 60%; if a correction is deep enough, and I can call a bottom, 80% would not be out of the question.


The markets have not retested the lows on recent corrections and that left me under-invested on the bounces. I will need to put less reliance on retests in the future.

Friday, April 2, 2021

Unemployment Report ... Manufacturing Suggests Inflation is Building Rapidly ... Bulls Run on Liquidity

Markets are closed for Good Friday. Happy Easter; have a kosher and joyous Passover.


UNEMPLOYMENT REPORT (YahooFinance)

“The U.S. economy brought back more jobs than expected in March, presaging even faster employment growth in the coming months as more Americans become vaccinated and jobs across industries return... Change in non-farm payrolls: +916,000 vs. +660,000 expected and a revised +468,000 in February.” Story at...  

https://finance.yahoo.com/news/march-jobs-report-labor-market-pandemic-unemployment-payrolls-181729856.html


MANUFACTURING SUGGESTS INFLATION IS BUILDING RAPIDLY (CNBC)

“For many economists, the [ISM Manufacturing] survey simply reinforced a message that other data points have shown lately, namely that inflationary pressures continue to build and perhaps not on simply a transitory basis as Federal Reserve officials have indicated.

The last time the ISM manufacturing reading was that high was just before a year when gross domestic product grew at a 7.2% pace and inflation was at 3.8%.” Story at...

https://www.cnbc.com/2021/04/01/manufacturing-boom-brings-more-signs-that-inflation-is-building-rapidly.html


BULLS RUN AS LIQUIDITY FLOODS MARKET (RIA)

“With markets still in the “seasonally strong” period of the year, lots of liquidity, and plenty of exuberance, this is not a time to be “bearish” on markets. We are using recent weaknesses to add to positions we took profits in recently, such as energy and financials. We will also add to beaten-up “growth” names that have strong earnings trajectories and strong fundamentals...

Focusing on risk...is also essential to capital preservation and investment success over time. In other words, “buy now,” just don’t forget to “sell” later.” Commentary at...

https://realinvestmentadvice.com/technically-speaking-bulls-run-as-liquidity-floods-market/


Thursday, April 1, 2021

Jobless Claims ... ISM Manufacturing … Construction Spending ... 10-Trillion (More) For Climate & Infrastructure ... Coronavirus (Covid-19) … Stock Market Analysis … ETF Trading … Dow 30 Ranking

“Trade what you see; not what you think.” – The Old Fool, Richard McCranie, trader extraordinaire.


“The big money is not in the buying and selling. But in the waiting.” - Charlie Munger, Vice Chairman, Berkshire Hathaway


JOBLESS CLAIMS (YahooFinance)

“New weekly jobless claims unexpectedly increased last week, even as a broadening vaccination program and the return of some high-contact service jobs took place...Initial jobless claims, week ended March 27: 719,000 vs. 675,000 expected and a revised 658,000 during the prior week...” Story at...

https://finance.yahoo.com/news/weekly-jobless-claims-week-ended-march-27-2021-pandemic-175704861.html


ISM MANUFACTURING (ISM via PRnewswire)

"The March Manufacturing PMI® registered 64.7 percent, an increase of 3.9 percentage points from the February reading of 60.8 percent. This figure indicates expansion in the overall economy for the 10th month in a row...The manufacturing economy continued its recovery in March. However, Survey Committee Members reported that their companies and suppliers continue to struggle to meet increasing rates of demand due to coronavirus (COVID-19) impacts limiting availability of parts and materials.” Press release at...

https://www.prnewswire.com/news-releases/manufacturing-pmi-at-64-7-march-2021-manufacturing-ism-report-on-business-301260206.html


CONSTRUCTION SPENDING (baynews9)

“U.S. construction spending fell in February after several months of steady gains, likely because of unseasonably cold weather and winter storms in the south. The Commerce Department said Thursday that spending on building projects slipped 0.8% in February, after a 1.2% gain in January.” Story at...

https://www.baynews9.com/fl/tampa/ap-top-news/2021/04/01/construction-spending-dips-08-in-february-amid-bad-weather


10 TRILLION FOR CLIMATE AND INFRASTRUCTURE (Mish Talk)

“On Monday, Sen. Edward J. Markey (D-Mass.) and Rep. Debbie Dingell (D-Mich.) unveiled a climate and infrastructure plan that called for $10 trillion in spending over the next decade.” – April Fools! Not the day; these politicians. This is real. 

“The saving grace of capitalism is failure. Good ideas are rewarded, bad ideas fail. We don't have failure, we have bank bailouts, student loan bailouts, housing bailouts, and so many moral hazard market interventions by the Fed and Congress I cannot even name all the facilities or tools. And without failure, you don't have capitalism.” – Mish Shedlock. Commentary at...

https://www.thestreet.com/mishtalk/economics/prepare-for-3-things-big-government-more-big-government-even-bigger-big-government

My worry is that the spending won’t be covered by revenues.  Even Biden’s proposed increase in Corporate taxes is short on revenue; it will raise a trillion dollars over 10 years, but his 2-trillion infrastructure spending would be spent in a much shorter time. More $ to the National Debt that is already at WWII levels.


CORONAVIRUS (NTSM)

Here’s the latest from the COVID19 Johns Hopkins website as of 5:45pm Thursday. US total case numbers are on the left axis; daily numbers are on the right side of the graph with the 10-dMA of daily numbers in Green. The trend is heading up, so we can see what CDC was worried about. Let’s hope it levels off.


MARKET REPORT / ANALYSIS

-Thursday the S&P 500 rose about 1.2% to 4020.

-VIX dipped about 11% to 17.33.

-The yield on the 10-year Treasury dipped to 1.676%.


The S&P 500 made another new-high today and the % of new-highs on the NYSE looks about average which is good. Breadth improved with the % of issues advancing on the NYSE now at 53.8% over the last 10-days.


The daily sum of 20 Indicators improved from +1 to +8 (a positive number is bullish; negatives are bearish); the 10-day smoothed sum that smooths the daily fluctuations improved from -26 to -19 (These numbers sometimes change after I post the blog based on data that comes in late.) Most of these indicators are short-term and many are trend following.


The Long Term NTSM indicator ensemble remained BUY. Price, Volume & VIX are bullish; Sentiment is neutral.


I remain Bullish.


MOMENTUM ANALYSIS:

TODAY’S RANKING OF 15 ETFs (Ranked Daily)

The top ranked ETF receives 100%. The rest are then ranked based on their momentum relative to the leading

ETF.

*For additional background on the ETF ranking system see NTSM Page at…

http://navigatethestockmarket.blogspot.com/p/exchange-traded-funds-etf-ranking.html


TODAY’S RANKING OF THE DOW 30 STOCKS (Ranked Daily)

Here’s the revised DOW 30 and its momentum analysis. The top ranked stock receives 100%. The rest are then ranked based on their momentum relative to the leading stock.

For more details, see NTSM Page at…

https://navigatethestockmarket.blogspot.com/p/a-system-for-trading-dow-30-stocks-my_8.html


THURSDAY MARKET INTERNALS (NYSE DATA)

Market Internals remained NEUTRAL on the market.


Market Internals are a decent trend-following analysis of current market action, but should not be used alone for short term trading. They are usually right, but they are often late.  They are most useful when they diverge from the Index. 


Using the Short-term indicator in 2018 in SPY would have made a 5% gain instead of a 6% loss for buy-and-hold. The methodology was Buy on a POSITIVE indication and Sell on a NEGATIVE indication and stay out until the next POSITIVE indication. The back-test included 13-buys and 13-sells, or a trade every 2-weeks on average.  


As of 9 March, my stock-allocation is about 60% invested in stocks. You may wish to have a higher or lower % invested in stocks depending on your risk tolerance. 50% is a conservative position that I consider fully invested for most retirees.


As a retiree, 50% in the stock market is about fully invested for me – it is a cautious and conservative number. If I feel very confident, I might go to 60%; if a correction is deep enough, and I can call a bottom, 80% would not be out of the question.


The markets have not retested the lows on recent corrections and that left me under-invested on the bounces. I will need to put less reliance on retests in the future.