Thursday, July 8, 2021

Jobless Claims ... Crude Inventories ... What Wall Street Thinks of Plunging Bond Yields … Coronavirus (Covid-19) … Stock Market Analysis … ETF Trading … Dow 30 Ranking

“Trade what you see; not what you think.” – The Old Fool, Richard McCranie, trader extraordinaire.


“The big money is not in the buying and selling. But in the waiting.” - Charlie Munger, Vice Chairman, Berkshire Hathaway


“People always ask me what is going on in the markets. It is simple. Greatest Speculative Bubble of All Time in All Things. By two orders of magnitude.” – Michael “Big Short” Burry.


“I never imagined that I would see the day that the Chairman of the House Judiciary Committee would step forward to call for raw [Supreme] court packing. It is a sign of our current political environment where rage overwhelms reason.” - Professor Jonathan Turley, honorary Doctorate of Law from John Marshall Law School for his contributions to civil liberties and the public interest.


Baseball fans will understand this joke...


JOBLESS CLAIMS (Fox Business)

“The number of Americans filing for first-time unemployment benefits last week unexpectedly rose off the lowest levels since the outbreak of the COVID-19 pandemic. Data released Thursday by the Labor Department showed 373,000 Americans filed for first-time jobless benefits in the week ended July 3...” Story at...

https://www.foxbusiness.com/economy/jobless-claims-unexpectedly-rise-off-pandemic-lows


EIA CRUDE INVENTORIES (EIA)

“U.S. commercial crude oil inventories (excluding those in the Strategic Petroleum Reserve) decreased by 6.9 million barrels from the previous week. At 445.5 million barrels, U.S. crude oil inventories are about 7% below the five year average for this time of year.” Press release at...

https://ir.eia.gov/wpsr/wpsrsummary.pdf


WHAT WALL STREET THINKS ABOUT THE SHOCKING PLUNGE IN BOND YIELDS (ZeroHedge)

“...firms either have to push up wages to satisfy demand, driving a potential inflationary spiral, or hold back on expectation that conditions will normalize, further depressing economic output and sparking even more deflationary fears. As Authers [Bloomberg reporter] correctly concludes, "either outcome leads to an economic mess that persists well into next year at least." It is this mess that the bond market is currently trying to sift through and make some sense of what the economy would look like on the other side...” Commentary at...

https://www.zerohedge.com/markets/heres-what-wall-street-thinks-behind-collapse-treasury-yields


CORONAVIRUS (NTSM)

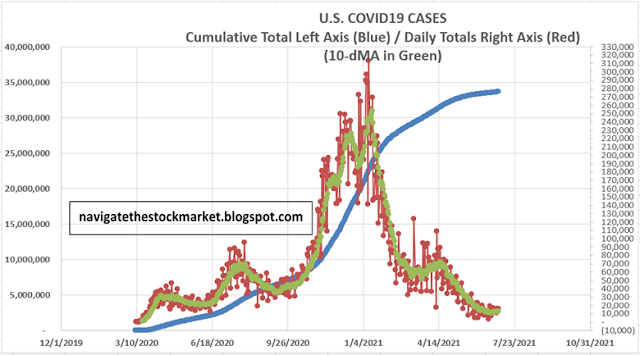
Here’s the latest from the COVID19 Johns Hopkins website as of 5:30 PM Thursday. US total case numbers are on the left axis; daily numbers are on the right side of the graph with the 10-dMA of daily numbers in Green.


Daily case numbers keep rising. Does this justify a major correction? Probably not.


MARKET REPORT / ANALYSIS

-Thursday the S&P 500 fell about 0.9% to 4321.

-VIX jumped about 17% to 19.00.

-The yield on the 10-year Treasury slipped to 1.298%.


Wednesday, the S&P 500 made a new all-time high today while 6.5% of issues on the NYSE made new-52-week highs. That’s about average for 52-week-highs when the Index makes a new high – that’s a good sign that the advance is reasonably broad.  If we were to have a pullback, it suggests that the drop would be less than 10%.


The daily sum of 20 Indicators dipped from -2 to -6 (a positive number is bullish; negatives are bearish); the 10-day smoothed sum that smooths the daily fluctuations improved from +9 to +10. (These numbers sometimes change after I post the blog based on data that comes in late.) Most of these indicators are short-term and many are trend following.


My Short-Term indicator ensemble flipped to Bearish today. Updating yesterday’s comment:

Up volume has been falling over the last several sessions. The 10-dMA of up-volume has slipped to 45% today, indicating that less than half of the volume has been up over the last 2 weeks. Only 49% of issues on the NYSE have been up over the last 2 weeks.


These stats suggest that we may see some trouble in the markets. It’s not a done deal though, today was a statistically significant down-day. That just means that the price-volume move exceeded my statistical parameters. Data shows that a statistically-significant, down-day is followed by an up-day about 60% of the time.


The Long Term NTSM indicator ensemble remained HOLD. Volume is bullish; Price, VIX & Sentiment are neutral.  


There are currently no top-indicators warning of a top.


I’m cautiously bullish, but a down day tomorrow would be a little worrisome. The 50-dMA is 2.4% below today’s close. I don’t expect the Index  to drop that far, but it could happen. I’d be surprised if the Index fell below the 50-day, but I have been wrong before.


MOMENTUM ANALYSIS:

TODAY’S RANKING OF 15 ETFs (Ranked Daily)

The top ranked ETF receives 100%. The rest are then ranked based on their momentum relative to the leading

ETF.

*For additional background on the ETF ranking system see NTSM Page at…

http://navigatethestockmarket.blogspot.com/p/exchange-traded-funds-etf-ranking.html


TODAY’S RANKING OF THE DOW 30 STOCKS (Ranked Daily)

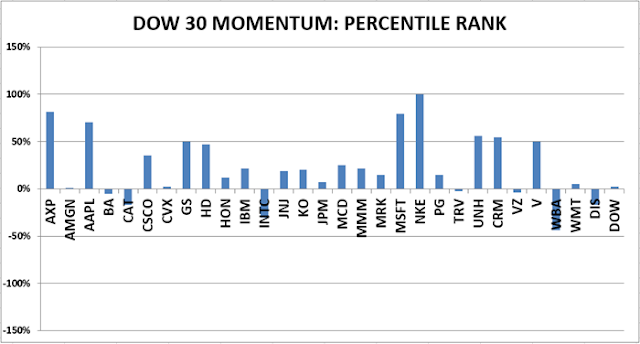
Here’s the revised DOW 30 and its momentum analysis. The top ranked stock receives 100%. The rest are then ranked based on their momentum relative to the leading stock.
For more details, see NTSM Page at…

https://navigatethestockmarket.blogspot.com/p/a-system-for-trading-dow-30-stocks-my_8.html


THURSDAY MARKET INTERNALS (NYSE DATA)

Market Internals slipped to BEARISH on the market.


Market Internals are a decent trend-following analysis of current market action, but should not be used alone for short term trading. They are usually right, but they are often late.  They are most useful when they diverge from the Index. 


Using the Short-term indicator in 2018 in SPY would have made a 5% gain instead of a 6% loss for buy-and-hold. The methodology was Buy on a POSITIVE indication and Sell on a NEGATIVE indication and stay out until the next POSITIVE indication. The back-test included 13-buys and 13-sells, or a trade every 2-weeks on average.  

As of 25 May, my stock-allocation is about 50% invested in stocks. I am not super bullish and I am watching the markets closely. For now, 50% is a reasonable allocation for me.


You may wish to have a higher or lower % invested in stocks depending on your risk tolerance. 50% is a conservative position that I consider fully invested for most retirees. As a retiree, 50% in the stock market is about fully invested for me – it is a cautious and conservative number. If I feel very confident, I might go to 60%; if a correction is deep enough, and I can call a bottom, 80% would not be out of the question.

Wednesday, July 7, 2021

FOMC Minutes ... JOLTS Job Openings … Coronavirus (Covid-19) … Stock Market Analysis … ETF Trading … Dow 30 Ranking

“Trade what you see; not what you think.” – The Old Fool, Richard McCranie, trader extraordinaire.


“The big money is not in the buying and selling. But in the waiting.” - Charlie Munger, Vice Chairman, Berkshire Hathaway


“People always ask me what is going on in the markets. It is simple. Greatest Speculative Bubble of All Time in All Things. By two orders of magnitude.” – Michael “Big Short” Burry.


“I never imagined that I would see the day that the Chairman of the House Judiciary Committee would step forward to call for raw [Supreme] court packing. It is a sign of our current political environment where rage overwhelms reason.” - Professor Jonathan Turley, honorary Doctorate of Law from John Marshall Law School for his contributions to civil liberties and the public interest.


FOMC MINUTES (CNBC)

“Federal Reserve officials talked tapering at their most recent meeting, but few seemed in a rush to get the process going, according to minutes released Wednesday... the prevailing mindset was that there should be no rush and markets must be well prepared for any shifts.” Story at...

https://www.cnbc.com/2021/07/07/federal-reserve-releases-minutes-of-its-june-15-16-meeting.html


JOLTS JOB OPENINGS (Reuters)

“U.S. workers can afford to be pickier. The number of job openings rose to just above 9.2 million in May and there is now a position available for every unemployed person, according to U.S. Labor Department data released on Wednesday read more . The vacancies-to-jobless ratio has recovered to pre-pandemic levels...” Story at...

https://www.reuters.com/breakingviews/us-job-vacancy-numbers-are-jolt-employers-2021-07-07/


CORONAVIRUS (NTSM)

Here’s the latest from the COVID19 Johns Hopkins website as of 8:15 PM Wednesday. US total case numbers are on the left axis; daily numbers are on the right side of the graph with the 10-dMA of daily numbers in Green.


MARKET REPORT / ANALYSIS

-Wednesday the S&P 500 rose about 0.3% to 4358.

-VIX declined about 1% to 16.20.

-The yield on the 10-year Treasury slipped to 1.311%.


Up volume has been falling over the last several sessions. The 10-dMA of up-volume has slipped to 49% today, indicating that less than half of the volume has been up over the last 2 weeks. This  needs to turn around or we’ll see some trouble in the markets.  


The McClellan Oscillator is negative. My analysis of breadth (Breadth MACD) is also bearish, but its methodology is not that much different than the McClellan Oscillator. Both of these indicators look at the issues advancing on the NYSE and compare moving averages.  


Bottom line: There are some bearish signs, but not enough to worry yet.


The daily sum of 20 Indicators dipped from +3 to -2 (a positive number is bullish; negatives are bearish); the 10-day smoothed sum that smooths the daily fluctuations improved from +2 to +9. (These numbers sometimes change after I post the blog based on data that comes in late.) Most of these indicators are short-term and many are trend following.


The Long Term NTSM indicator ensemble remained HOLD. Volume is bullish; Price, VIX & Sentiment are neutral.  


There is currently only 1 top-indicator warning of a top; the Index is stretched too far ahead of its 200-dMA.


I’m cautiously bullish.


MOMENTUM ANALYSIS:

TODAY’S RANKING OF 15 ETFs (Ranked Daily)

The top ranked ETF receives 100%. The rest are then ranked based on their momentum relative to the leading

ETF.

*For additional background on the ETF ranking system see NTSM Page at…

http://navigatethestockmarket.blogspot.com/p/exchange-traded-funds-etf-ranking.html


TODAY’S RANKING OF THE DOW 30 STOCKS (Ranked Daily)

Here’s the revised DOW 30 and its momentum analysis. The top ranked stock receives 100%. The rest are then ranked based on their momentum relative to the leading stock.

For more details, see NTSM Page at…

https://navigatethestockmarket.blogspot.com/p/a-system-for-trading-dow-30-stocks-my_8.html


WEDNESDAY MARKET INTERNALS (NYSE DATA)

Market Internals remained NEUTRAL on the market.


Market Internals are a decent trend-following analysis of current market action, but should not be used alone for short term trading. They are usually right, but they are often late.  They are most useful when they diverge from the Index. 


Using the Short-term indicator in 2018 in SPY would have made a 5% gain instead of a 6% loss for buy-and-hold. The methodology was Buy on a POSITIVE indication and Sell on a NEGATIVE indication and stay out until the next POSITIVE indication. The back-test included 13-buys and 13-sells, or a trade every 2-weeks on average.  


As of 25 May, my stock-allocation is about 50% invested in stocks. I am not super bullish and I am watching the markets closely. For now, 50% is a reasonable allocation for me.


You may wish to have a higher or lower % invested in stocks depending on your risk tolerance. 50% is a conservative position that I consider fully invested for most retirees. As a retiree, 50% in the stock market is about fully invested for me – it is a cautious and conservative number. If I feel very confident, I might go to 60%; if a correction is deep enough, and I can call a bottom, 80% would not be out of the question.

Taking Profits

I Sold XLF (Financial ETF) and bought XLK (Technology ETF). It looks like there is rotation going on.  Falling yields are hurting the Financials.  That may not be long lived.  I’ll watch and may buy back XLF later, depending on momentum analysis. Now, there is a  move to technology so I’ll follow the crowd.

Tuesday, July 6, 2021

IHS Markit Services ... ISM Non-Manufacturing PMI ... 100 Times Leverage on Crypto ... Trump Really Did Lose Michigan … Coronavirus (Covid-19) … Stock Market Analysis … ETF Trading … Dow 30 Ranking

“Trade what you see; not what you think.” – The Old Fool, Richard McCranie, trader extraordinaire.


“The big money is not in the buying and selling. But in the waiting.” - Charlie Munger, Vice Chairman, Berkshire Hathaway


“People always ask me what is going on in the markets. It is simple. Greatest Speculative Bubble of All Time in All Things. By two orders of magnitude.” – Michael “Big Short” Burry.


“I never imagined that I would see the day that the Chairman of the House Judiciary Committee would step forward to call for raw [Supreme] court packing. It is a sign of our current political environment where rage overwhelms reason.” - Professor Jonathan Turley, honorary Doctorate of Law from John Marshall Law School for his contributions to civil liberties and the public interest.


IHS MARKIT SERVICES PMI (Markit Economics)

“June PMI™ data indicated a further marked upturn in business activity across the U.S. service sector, supported by a substantial rise in client demand. Business confidence in the outlook also improved to the second-highest in seven years.” Press release at...

https://www.markiteconomics.com/Public/Home/PressRelease/cf907366306e4d8aa6b726a97d885634


ISM NON-MANUFACTURING INDEX (Reuters)

“The Institute for Supply Management said on Tuesday its non-manufacturing activity index fell to 60.1 last month from 64.0 in May, which was the highest reading in the series’ history...The economy has been hit by shortages of labor and raw materials as it reopens after more than a year of disruptions caused by the COVID-19 pandemic.” Story at...

https://www.reuters.com/article/us-usa-economy-services/us-service-sector-activity-cools-in-june-employment-measure-contracts-ism-survey-idUSKCN2EC1JS


WITNESS BOMBSHELL AT HOUSE HEARING – 100 TIMES LEVERAGE ON CRYPTO (Wall Street on Parade)

“If hedge funds get farther into crypto, they don’t care about direction. They’ll go long, they’ll go short. They can use leverage. There are lots of cryptocurrency exchanges like FTX and Binance and many others that allow people to use insane amounts of leverage – 100 times to 1…So what happens if a huge number of hedge funds have prime broker relationships with too-big-to-fail banks [and] all happen to be in similar crypto positions, whether it’s long or short and there’s massive volatility in the market. They may have to sell some of their other assets. It may lead to margin calls in their non-crypto assets which could lead to forced liquidations and sort of redound to the banks themselves in the form of counterparty risk.” - Alexis Goldstein, Wall Street Veteran and Director of Financial Policy at the Open Markets Institute... Not to put too fine a point on it but counterparty risk is what led to the financial contagion that crashed Wall Street in 2008.” Story at...

https://wallstreetonparade.com/2021/07/witness-drops-bombshell-at-house-hearing-hedge-funds-are-getting-100-times-leverage-on-crypto/


YES, TRUMP REALLY DID LOSE MICHIGAN (WSJ)

Donald Trump says fraud is the only reason he lost the 2020 election. Some even think Mr. Trump will be reinstated once the truth comes out. Anyone who finds this narrative at all appealing should take 30 minutes to read the investigative report posted last week by Michigan Republicans.” Editorial commentary at...

https://www.wsj.com/articles/yes-trump-really-did-lose-michigan-11625265004

Read the Michigan GOP report here...

https://misenategopcdn.s3.us-east-1.amazonaws.com/99/doccuments/20210623/SMPO_2020ElectionReport_2.pdf

Bottom line from the report: “This Committee found no evidence of widespread or systematic fraud in Michigan’s prosecution of the 2020 election.” - Senator Edward McBroom – Chair; Senator Lana Theis – Majority Vice Chair; Senator Jeff Irwin – Minority Vice Chair; Senator John Bizon.


CORONAVIRUS (NTSM)

Here’s the latest from the COVID19 Johns Hopkins website as of 7:30 PM Tuesday. US total case numbers are on the left axis; daily numbers are on the right side of the graph with the 10-dMA of daily numbers in Green.


MARKET REPORT / ANALYSIS

-Tuesday the S&P 500 dipped about 0.2% to 4344.

-VIX increased about 9% to 15.07.

-The yield on the 10-year Treasury slipped to 1.351%.


The daily sum of 20 Indicators dipped from +5 to +3 (a positive number is bullish; negatives are bearish); the 10-day smoothed sum that smooths the daily fluctuations improved from -10 to +2. (These numbers sometimes change after I post the blog based on data that comes in late.) Most of these indicators are short-term and many are trend following.


The Long Term NTSM indicator ensemble remained HOLD. Volume is bullish; Price, VIX & Sentiment are neutral.  


There is currently only 1 top-indicator warning of a top; the Index is stretched too far ahead of its 200-dMA, but just barely.


I didn’t make any changes yet, but I’ll add Technology (XLK-ETF) and possibly American Express (AXP). I think Financials (XLF-ETF) are a sell. They have dropped out of the top 3 ETFs. Nike is showing strong momentum, but that’s partly related to a big move they had on their earnings announcement.  Hard to say if that momo will continue.


I’m waiting to be sure Tuesday's weakness isn’t the start of a more serious pullback.


MOMENTUM ANALYSIS:

TODAY’S RANKING OF 15 ETFs (Ranked Daily)

The top ranked ETF receives 100%. The rest are then ranked based on their momentum relative to the leading

ETF.


*For additional background on the ETF ranking system see NTSM Page at…

http://navigatethestockmarket.blogspot.com/p/exchange-traded-funds-etf-ranking.html

TODAY’S RANKING OF THE DOW 30 STOCKS (Ranked Daily)

Here’s the revised DOW 30 and its momentum analysis. The top ranked stock receives 100%. The rest are then ranked based on their momentum relative to the leading stock.

For more details, see NTSM Page at…

https://navigatethestockmarket.blogspot.com/p/a-system-for-trading-dow-30-stocks-my_8.html


TUESDAY MARKET INTERNALS (NYSE DATA)

Market Internals slipped to NEUTRAL on the market.


Market Internals are a decent trend-following analysis of current market action, but should not be used alone for short term trading. They are usually right, but they are often late.  They are most useful when they diverge from the Index.  


Using the Short-term indicator in 2018 in SPY would have made a 5% gain instead of a 6% loss for buy-and-hold. The methodology was Buy on a POSITIVE indication and Sell on a NEGATIVE indication and stay out until the next POSITIVE indication. The back-test included 13-buys and 13-sells, or a trade every 2-weeks on average.  

As of 25 May, my stock-allocation is about 50% invested in stocks. I am not super bullish and I am watching the markets closely. For now, 50% is a reasonable allocation for me.


You may wish to have a higher or lower % invested in stocks depending on your risk tolerance. 50% is a conservative position that I consider fully invested for most retirees. As a retiree, 50% in the stock market is about fully invested for me – it is a cautious and conservative number. If I feel very confident, I might go to 60%; if a correction is deep enough, and I can call a bottom, 80% would not be out of the question.

Friday, July 2, 2021

Payroll Report ... Unemployment Rate ... Average Hourly Earnings ... Factory Orders … Not at a Top ... Coronavirus (Covid-19) … Stock Market Analysis … ETF Trading … Dow 30 Ranking

“Trade what you see; not what you think.” – The Old Fool, Richard McCranie, trader extraordinaire.


“The big money is not in the buying and selling. But in the waiting.” - Charlie Munger, Vice Chairman, Berkshire Hathaway


“People always ask me what is going on in the markets. It is simple. Greatest Speculative Bubble of All Time in All Things. By two orders of magnitude.” – Michael “Big Short” Burry.


“I never imagined that I would see the day that the Chairman of the House Judiciary Committee would step forward to call for raw [Supreme] court packing. It is a sign of our current political environment where rage overwhelms reason.” - Professor Jonathan Turley, honorary Doctorate of Law from John Marshall Law School for his contributions to civil liberties and the public interest.


PAYROLL REPORT / UNEMPLOYMENT RATE / AVG HOURLY EARNINGS (Yahoo Finance)

“The U.S. Labor Department released its June jobs report Friday morning at 8:30 a.m. ET...

Change in non-farm payrolls: 850,000 vs. 720,000 expected; Unemployment rate: 5.9%; Average hourly earnings, month-over-month: 0.3%...” Story at...

https://finance.yahoo.com/news/june-2021-jobs-report-non-farm-payrolls-unemployment-labor-184624849-183926242.html


FACTORY ORDERS (Briefing.com)

“Factory orders for manufactured goods increased 1.7% m/m in May (Briefing.com consensus 1.7%) after decreasing an upwardly revised 0.1% (from -0.6%) in April.” Story at...

https://www.briefing.com/calendars/economic/display-article?ArticleId=ER20210702100000FactoryOrders&FileName=facord.htm


VIX OPEN INTEREST FALLING – NOT A FEATURE AT TOPS (McClellan Financial Publicatons)

“...having VIX open interest below the 200MA is useful for ruling out the possibility that prices are now at a major top.  It is a missing topping condition.  So we [now] have some assurance that there should still be a lot more for prices to run higher.  At the point when we see hedge funds getting excited again about trading the VIX futures, and see open interest numbers rising up to well above the 200MA, then we can worry about a meaningful top for stock prices.” Commentary at...

https://www.mcoscillator.com/learning_center/weekly_chart/vix_open_interest_is_falling_which_is_not_a_feature_of_price_tops/


CORONAVIRUS (NTSM)

Here’s the latest from the COVID19 Johns Hopkins website as of 10:30 PM Friday. US total case numbers are on the left axis; daily numbers are on the right side of the graph with the 10-dMA of daily numbers in Green.


MARKET REPORT / ANALYSIS

-Friday the S&P 500 rose about 0.8% to 4352.

-VIX slipped about 2% to 15.07.

-The yield on the 10-year Treasury slipped to 1.437%.


Have a happy and safe Fourth of July Holiday – Markets are closed Monday.

https://www.youtube.com/watch?v=-f5WRrUJu-8

For guitar players out there, this piece is included in Guy Van Duser’s, Mel Bay book, “Stride Guitar.”


Here’s Friday’s run-down of some important indicators. These tend to be both long-term and short-term, so they are somewhat different than the 20 that I report on daily.


BULL SIGNS

-The 10-dMA of issues advancing on the NYSE (Breadth) is above 50%

-The 50-dMA % of issues advancing on the NYSE (Breadth) is above 50%.

-The 100-dMA of the % of issues advancing on the NYSE (Breadth) is above 50%.

-The 5-10-20 Timer System is BUY; the 5-dEMA and 10-dEMA are both above the 20-dEMA. 

-MACD of the percentage of issues advancing on the NYSE (breadth) made a bearish crossover 16 June, but has improved and is now a whisker away from a bullish crossover..

-Short-term new-high/new-low data is higher.

-Statistically, the S&P 500 gave a panic-signal, 18 June, but the signal has expired.

-The Smart Money (late-day action) is improving. (This indicator is based on the Smart Money Indicator developed by Don Hayes).

-MACD of S&P 500 price made a bullish crossover today, 25 June.

-My Money Trend indicator is headed up.

-The smoothed advancing volume on the NYSE is rising.

-The S&P 500 is out-performing the Utilities ETF (XLU), and trending higher - bullish.

-69% of the 15-ETFs that I track have been up over the last 10-days.


NEUTRAL

-Breadth on the NYSE compared to the S&P 500 index is neutral.

-We had 2 Distribution Days recently, but not enough to send a signal.

-RSI – neutral

-VIX is falling, but not fast enough to send a signal - neutral.

-Non-crash Sentiment indicator remains neutral, but it is very bullish and that means the signal is leaning bearish.

-There have been 13 up-days over the last 20 days. Neutral

-The Fosback High-Low Logic Index is neutral.

-There have been 3 Statistically-Significant days in the last 15-days. Neutral.

-The market remains fairly broad; 6.2% of all issues traded on the NYSE made new, 52-week highs when the S&P 500 made a new all-time-high 11 June. (There is no bullish signal for this indicator.) This is slightly below average, but it still indicates decent breadth.

-4 June, the 52-week, New-high/new-low ratio improved by 0.4 standard deviations, somewhat bullish, but it has expired.

-Long-term new-high/new-low data is flat.

-The size of up-moves has been larger than the size of down-moves over the last month, but not enough to give a signal.


BEAR SIGNS

-Bollinger Bands are overbought (a bearish sign).

-The S&P 500 is 13.2% above its 200-dMA (Sell point is 12%.). This value was 15.9% above the 200-dMA when the 10% correction occurred in Sep 2020.has

-McClellan Oscillator is mildly bearish.

-Slope of the 40-dMA of New-highs is falling. This is one of my favorite trend indicators so this is worrisome.

-There have been 9 up-days over the last 10-days. The last time this happened was at the top of a 10% correction back in September of 2020. This indicator is usually right, but not always.

-Cyclical Industrials (XLI-ETF) are under-performing the S&P 500 - bearish.

-Overbought/Oversold Index (Advance/Decline Ratio) is overbought.


On Friday, 21 February, 2 days after the top of the Coronavirus pullback, there were 10 bear-signs and 1 bull-sign. Now there are 7 bear-signs and 13 bull-signs. Last week, there were 8 bear-signs and 11 bull-signs. Indicators keep improving.


The daily sum of 20 Indicators improved from +3 to +5 (a positive number is bullish; negatives are bearish); the 10-day smoothed sum that smooths the daily fluctuations improved from -27 to -10. (These numbers sometimes change after I post the blog based on data that comes in late.) Most of these indicators are short-term and many are trend following.


The Long Term NTSM indicator ensemble remained HOLD. Volume is bullish; Price, VIX & Sentiment are neutral.  


There are currently only 2 top-indicators warning of a top; the Index is stretched too far ahead of its 200-dMA, but just barely; and Bollinger Bands are “overbought”, an indication that the S&P 500 is more than 2 std deviations above the norm. If RSI also turns overbought, we’ll need to consider the possibility of a top.


There have been 7 up-days in a row; 9 out of the last 10 days have been up-days while 13 out of the last 20 have been up. That’s elevated, and bordering on bearish. As I said yesterday, and was wrong, but I’ll say it again, expect a down-day Tuesday.


As noted yesterday, I’m getting more bullish.  It appears that the long malaise, consisting of a flat Index going back to early May, is ending. In short, it looks like the Index is breaking out to the upside.


I’ll probably add Technology (XLK-ETF) and American Express (AXP) to replace issues I sold this week. I think Financials (XLF-ETF) are a sell too.


MOMENTUM ANALYSIS:

TODAY’S RANKING OF 15 ETFs (Ranked Daily)

The top ranked ETF receives 100%. The rest are then ranked based on their momentum relative to the leading

ETF.

*For additional background on the ETF ranking system see NTSM Page at…

http://navigatethestockmarket.blogspot.com/p/exchange-traded-funds-etf-ranking.html


TODAY’S RANKING OF THE DOW 30 STOCKS (Ranked Daily)

Here’s the revised DOW 30 and its momentum analysis. The top ranked stock receives 100%. The rest are then ranked based on their momentum relative to the leading stock.

For more details, see NTSM Page at…

https://navigatethestockmarket.blogspot.com/p/a-system-for-trading-dow-30-stocks-my_8.html


FRIDAY MARKET INTERNALS (NYSE DATA)

Market Internals remained BULLISH on the market.


Market Internals are a decent trend-following analysis of current market action, but should not be used alone for short term trading. They are usually right, but they are often late.  They are most useful when they diverge from the Index. 


Using the Short-term indicator in 2018 in SPY would have made a 5% gain instead of a 6% loss for buy-and-hold. The methodology was Buy on a POSITIVE indication and Sell on a NEGATIVE indication and stay out until the next POSITIVE indication. The back-test included 13-buys and 13-sells, or a trade every 2-weeks on average.  


As of 25 May, my stock-allocation is about 45-50% invested in stocks. I am not super bullish and I am watching the markets closely. For now, 50% is a reasonable allocation for me.


You may wish to have a higher or lower % invested in stocks depending on your risk tolerance. 50% is a conservative position that I consider fully invested for most retirees. As a retiree, 50% in the stock market is about fully invested for me – it is a cautious and conservative number. If I feel very confident, I might go to 60%; if a correction is deep enough, and I can call a bottom, 80% would not be out of the question.

Taking Profits

I took profits in Goldman Sachs (GS) today. It has been showing weakness recently and the chart looks a little like a head-and-shoulders pattern is still in place. The financials (XLF) have been showing less momentum too.  I can always buy it back later if it regains strength.


I Sold the XLB-Materials ETF yesterday – my first loss of the year. Materials were an inflation trade and the market apparently agrees with the FED; inflation is expected to be transitory.

Thursday, July 1, 2021

Jobless Claims ... ISM Manufacturing ... Construction Spending … Coronavirus (Covid-19) … Stock Market Analysis … ETF Trading … Dow 30 Ranking

“Trade what you see; not what you think.” – The Old Fool, Richard McCranie, trader extraordinaire.


“The big money is not in the buying and selling. But in the waiting.” - Charlie Munger, Vice Chairman, Berkshire Hathaway


“People always ask me what is going on in the markets. It is simple. Greatest Speculative Bubble of All Time in All Things. By two orders of magnitude.” – Michael “Big Short” Burry.


“I never imagined that I would see the day that the Chairman of the House Judiciary Committee would step forward to call for raw [Supreme] court packing. It is a sign of our current political environment where rage overwhelms reason.” - Professor Jonathan Turley, honorary Doctorate of Law from John Marshall Law School for his contributions to civil liberties and the public interest.


JOBLESS CLAIMS (CNBC)

“Initial filings for unemployment insurance fell sharply last week, indicating continued improvement in the U.S. jobs market, the Labor Department reported Thursday. First-time jobless claims totaled 364,000 for the week ended June 26...” Story at...

https://www.cnbc.com/2021/07/01/us-weekly-jobless-claims.html


ISM MANUFACTURING (ISM)

“The June Manufacturing PMI® registered 60.6 percent, a decrease of 0.6 percentage point from the May reading of 61.2 percent. This figure indicates expansion in the overall economy for the 13th month in a row after contraction in April 2020.”  Press release at...

https://www.ismworld.org/supply-management-news-and-reports/reports/ism-report-on-business/pmi/june/


CONSTRUCTION SPENDING (YahooFinance)

“U.S. construction spending unexpectedly fell in May as gains in private homebuilding were offset by persistent weakness in outlays on nonresidential structures and public projects. The Commerce Department said on Thursday that construction spending dropped 0.3%...” Story at... 

https://finance.yahoo.com/news/construction-spending-unexpectedly-falls-may-144442628.html


WARNINGS FROM BEHIND THE CURTAIN (RIA)

“Currently, we are seeing every box checked. Irrational exuberance from investors, easy credit with investors taking out personal loans to buy stocks, and risky stocks outperforming. The level of exuberance currently matches previous major market peaks, the only missing ingredient is a catalyst to start the reversal. The biggest problem is that investors are crowded into a theatre with a single exit. When the selling starts, the exit will become very narrow, very fast.” Commentary at...

https://realinvestmentadvice.com/technically-speaking-warnings-from-behind-the-curtain/


CORONAVIRUS (NTSM)

Here’s the latest from the COVID19 Johns Hopkins website as of 7:00 PM Thursday. US total case numbers are on the left axis; daily numbers are on the right side of the graph with the 10-dMA of daily numbers in Green.


MARKET REPORT / ANALYSIS

-Thursday the S&P 500 rose about 0.5% to 43320.

-VIX slipped about 2% to 15.48.

-The yield on the 10-year Treasury slipped to 1.455%.


6.6% of issues on the NYSE made new-highs today and that’s about average when the Index makes a new-high.  That’s a good sign since it indicates a relatively broad advance at the new-high. That’s confirmed by the 54% of issues advancing on the NYSE over the last 10 days.


The daily sum of 20 Indicators slipped from +4 to +3 (a positive number is bullish; negatives are bearish); the 10-day smoothed sum that smooths the daily fluctuations improved from -36 to -27. (These numbers sometimes change after I post the blog based on data that comes in late.) Most of these indicators are short-term and many are trend following.


The Long Term NTSM indicator ensemble remained HOLD. Price, Volume, VIX & Sentiment are neutral.  


There are currently only 2 top-indicators warning of a top; the Index is stretched too far ahead of its 200-dMA, but just barely; and Bollinger Bands flashed “overbought”, an indication that the S&P 500 is more than 2 std deviations above the norm. If RSI also turns overbought we’ll need to consider the possibility of a top.


There have been 6 up-days in a row; 8 out of the last 10 days have been up-days while 13 out of the last 20 have been up. That’s elevated, and bordering on bearish. Expect a down-day tomorrow.


I’m getting more bullish.  It appears that the long malaise, consisting of a flat Index going back to early May, is ending. In short, it looks like the Index is breaking out.


MOMENTUM ANALYSIS:

TODAY’S RANKING OF 15 ETFs (Ranked Daily)

The top ranked ETF receives 100%. The rest are then ranked based on their momentum relative to the leading ETF.

*For additional background on the ETF ranking system see NTSM Page at…

http://navigatethestockmarket.blogspot.com/p/exchange-traded-funds-etf-ranking.html


TODAY’S RANKING OF THE DOW 30 STOCKS (Ranked Daily)

Here’s the revised DOW 30 and its momentum analysis. The top ranked stock receives 100%. The rest are then ranked based on their momentum relative to the leading stock.

For more details, see NTSM Page at…

https://navigatethestockmarket.blogspot.com/p/a-system-for-trading-dow-30-stocks-my_8.html


THURSDAY MARKET INTERNALS (NYSE DATA)

Market Internals remained BULLISH on the market. 


Market Internals are a decent trend-following analysis of current market action, but should not be used alone for short term trading. They are usually right, but they are often late.  They are most useful when they diverge from the Index. 


Using the Short-term indicator in 2018 in SPY would have made a 5% gain instead of a 6% loss for buy-and-hold. The methodology was Buy on a POSITIVE indication and Sell on a NEGATIVE indication and stay out until the next POSITIVE indication. The back-test included 13-buys and 13-sells, or a trade every 2-weeks on average.  

As of 25 May, my stock-allocation is about 50% invested in stocks.


You may wish to have a higher or lower % invested in stocks depending on your risk tolerance. 50% is a conservative position that I consider fully invested for most retirees. As a retiree, 50% in the stock market is about fully invested for me – it is a cautious and conservative number. If I feel very confident, I might go to 60%; if a correction is deep enough, and I can call a bottom, 80% would not be out of the question.