Friday, August 6, 2021

Payroll Report ... Unemployment Rate … Coronavirus (Covid-19) … Stock Market Analysis … ETF Trading … Dow 30 Ranking

“Trade what you see; not what you think.” – The Old Fool, Richard McCranie, trader extraordinaire.


“People always ask me what is going on in the markets. It is simple. Greatest Speculative Bubble of All Time in All Things. By two orders of magnitude.” – Michael “Big Short” Burry.


"If I was Darth Vader and I wanted to destroy the US economy, I would do aggressive spending in the middle of an already hot economy...This is the biggest bubble I've seen in my career." - Stanley Druckenmiller, billionaire investor.


“Inflation is not going to be transitory; I’ve been pretty certain in my mind about three prior calls. This is the fourth one.” - Mohamed El-Erian, Chief economic adviser at Allianz SE

PAYROLL REPORT / UNEMPLOYMENT RATE / AVG HOURLY EARNINGS (CNBC)

“Hiring rose in July at its fastest pace in nearly a year despite fears over Covid-19′s delta variant and as companies struggled with a tight labor supply, the Labor Department reported Friday. Nonfarm payrolls increased by 943,000 for the month while the unemployment rate dropped to 5.4%...

...Average hourly earnings also increased more than expected, rising 0.4% for the month and are up 4% from the same period a year ago...” Story at...

https://www.cnbc.com/2021/08/06/jobs-report-july-.html


WE ARE FAILING AT COVID AT EXACTLY THE WRONG TIME (USA Today)


“Dr. Scott Gottlieb, former chief of the Food and Drug Administration, says it's possible that data only captures a fraction of people who have the virus. ‘I wouldn't be surprised if, on the whole, we're infecting up to a million people a day right now, and we're just picking up maybe a 10th of that,’ he told CNBC...

...Delta is substantially more contagious than previous variants...

...Even in the case of an outbreak like the one in Massachusetts, vaccinations prevented hospitalizations. About three-fourths of people infected in the outbreak were fully vaccinated against the coronavirus, none of whom died, and only a few were hospitalized.” Story at...  

https://www.usatoday.com/story/opinion/2021/08/06/covid-delta-vaccines-mask-wearing-pandemic/5455150001/


TEXAS REPUBLICAN LEADER DIES OF COVID19 FIVE-DAYS AFTER ANTI VAX POST (msn.news)

“A Texas Republican leader who was hospitalized with COVID-19 died Wednesday, just days after he shared a post on social media questioning the effectiveness of the coronavirus vaccine...Apley had also previously vocalized his opposition to vaccinations and mask mandates, and in May shared a flyer for a mask burning event.” Story at...

Texas Republican leader dies of COVID-19 five days after anti-vaccination post (msn.com)

My cmt: He was 45 years old.  I feel bad for his family, but this is just another example of Darwinism at work – the herd is being culled of idiots.


CORONAVIRUS (NTSM)

My daughter is an ER nurse in Richmond, Virginia. She says Covid numbers are thru the roof.  The ICU is full and she has ICU patients in the ER waiting for a bed.  The ER is full, too. Patients are unvaccinated or immune-compromised. They’re also younger.


She admitted a baby to the Hospital recently.  The older brother brought the virus home from summer school and infected the entire family. Anti-maskers are missing the fact that Delta Covid is a LOT more contagious. That is causing problems in states that did well before.


For example, Florida did well in the first Covid wave because the virus impacted older people more.  The old took it seriously. They quarantined; wore masks; and followed CDC guidance.  Younger people can’t quarantine as easily, since they must work, but they also aren’t as compliant with CDC guidance and are less likely to get vaccinated. In addition, they have dropped their guard under the assumption that Covid was gone.  The Delta variant has proved them wrong. A younger cohort is now arriving at the hospital. Along with the rest of the nation, Florida numbers are very high.


Here’s the latest from the COVID19 Johns Hopkins website as of 5:00 PM Friday. U.S. total case numbers are on the left axis; daily numbers are on the right side of the graph in Red with the 10-dMA of daily numbers in Green.


MARKET REPORT / ANALYSIS

-Friday the S&P 500 rose about 0.2% to 4437.

-VIX dipped about 7% to 16.15.

-The yield on the 10-year Treasury rose to 1.303%.


The markets still look bullish.


Here’s Friday’s run-down of some important indicators. These tend to be both long-term and short-term, so they are somewhat different than the 20 that I report on daily.


BULL SIGNS

-The 10-dMA of issues advancing on the NYSE (Breadth) is above 50%.

-The 50-dMA % of issues advancing on the NYSE (Breadth) is above 50%.

-The 100-dMA of the % of issues advancing on the NYSE (Breadth) is above 50%.

-The smoothed advancing volume on the NYSE is rising.

-The 5-10-20 Timer System is BUY; the 5-dEMA and 10-dEMA are both above the 20-dEMA. 

-MACD of S&P 500 price made a bullish crossover, 6 August.

-MACD of the percentage of issues advancing on the NYSE (breadth) made a bullish crossover 26 July.

-Short-term new-high/new-low data is rising.

-McClellan Oscillator.

-The S&P 500 is out-performing the Utilities ETF (XLU), not as much as I’d like, but I’ll leave it in the bull category for now.


NEUTRAL

-Distribution Days.

-Bollinger Bands

-RSI.

-Statistically, the S&P 500 gave a panic-signal, 18 June, but the signal has expired.

-Non-crash Sentiment indicator remains neutral, but it is very bullish and that means the signal is leaning bearish.

-5.2% of all issues traded on the NYSE made new, 52-week highs when the S&P 500 made a new all-time-high today, 6 August. (There is no bullish signal for this indicator.) This is below average, but not low enough to send a bear signal – something to watch.

-The Fosback High-Low Logic Index is neutral.

-There have been 12 up-days over the last 20 days. Neutral

-There have been 6 up-days over the last 10-days.

-The size of up-moves has been smaller than the size of down-moves over the last month, but not enough to give a signal. This indicator is improving.

-VIX.

-Overbought/Oversold Index (Advance/Decline Ratio).

-29 July, the 52-week, New-high/new-low ratio improved by 0.4 standard deviations, somewhat bullish, but neutral.

-The S&P 500 is 11.9% above its 200-dMA (Bear indicator is 12%.). This value was 15.9% above the 200-dMA when the 10% correction occurred in Sep 2020.

-There have been 3 Statistically-Significant days in the last 15-days. This can be a bull or bear signal. 3 is neutral. 

-The Smart Money (late-day action). (This indicator is based on the Smart Money Indicator developed by Don Hayes).

-56% of the 15-ETFs that I track have been up over the last 10-days, but this stat has been trending lower so I’ll call it neutral.


BEAR SIGNS

-My Money Trend indicator.

-Long-term new-high/new-low data is falling.

-Breadth on the NYSE compared to the S&P 500 index is bearish.

-Slope of the 40-dMA of New-highs is falling. This is one of my favorite trend indicators.

-Cyclical Industrials (XLI-ETF) are under-performing the S&P 500 - bearish. This one looks like it is turning around, but I’ll leave it bearish for now.


On Friday, 21 February, 2 days after the top of the Coronavirus pullback, there were 10 bear-signs and 1 bull-sign. Now there are 5 bear-signs and 10 bull-signs. Last week, there were 5 bear-signs and 11 bull-signs.


Today’s Friday count is about the same as last Friday, but it is a significant improvement compared to 2 weeks ago. This is a bullish indication overall.


The daily sum of 20 Indicators improved from -4 to -1 (a positive number is bullish; negatives are bearish); the 10-day smoothed sum that smooths the daily fluctuations improved from -38 to -34. (These numbers sometimes change after I post the blog based on data that comes in late.) Most of these indicators are short-term and many are trend following.


The Long Term NTSM indicator remained HOLD. Volume, VIX, Price & Sentiment are neutral.


I remain cautiously bullish.


MOMENTUM ANALYSIS:

TODAY’S RANKING OF 15 ETFs (Ranked Daily)

The top ranked ETF receives 100%. The rest are then ranked based on their momentum relative to the leading

ETF.


*For additional background on the ETF ranking system see NTSM Page at…

http://navigatethestockmarket.blogspot.com/p/exchange-traded-funds-etf-ranking.html


TODAY’S RANKING OF THE DOW 30 STOCKS (Ranked Daily)

Here’s the revised DOW 30 and its momentum analysis. The top ranked stock receives 100%. The rest are then ranked based on their momentum relative to the leading stock.

For more details, see NTSM Page at…

https://navigatethestockmarket.blogspot.com/p/a-system-for-trading-dow-30-stocks-my_8.html


FRIDAY MARKET INTERNALS (NYSE DATA)

Market Internals improved to BULLISH on the market.


Market Internals are a decent trend-following analysis of current market action, but should not be used alone for short term trading. They are usually right, but they are often late.  They are most useful when they diverge from the Index. 


Using the Short-term indicator in 2018 in SPY would have made a 5% gain instead of a 6% loss for buy-and-hold. The methodology was Buy on a POSITIVE indication and Sell on a NEGATIVE indication and stay out until the next POSITIVE indication. The back-test included 13-buys and 13-sells, or a trade every 2-weeks on average.  


My stock-allocation is about 50% invested in stocks. I am not super bullish (or bearish) and I am watching the markets closely.


You may wish to have a higher or lower % invested in stocks depending on your risk tolerance. 50% is a conservative position that I consider fully invested for most retirees. As a retiree, 50% in the stock market is about fully invested for me – it is a cautious and conservative number. If I feel very confident, I might go to 60%; if a correction is deep enough, and I can call a bottom, 80% would not be out of the question.

Thursday, August 5, 2021

Jobless Claims … Taxes Too High ... Coronavirus (Covid-19) … Stock Market Analysis … ETF Trading … Dow 30 Ranking

“Trade what you see; not what you think.” – The Old Fool, Richard McCranie, trader extraordinaire.


“People always ask me what is going on in the markets. It is simple. Greatest Speculative Bubble of All Time in All Things. By two orders of magnitude.” – Michael “Big Short” Burry.


"If I was Darth Vader and I wanted to destroy the US economy, I would do aggressive spending in the middle of an already hot economy...This is the biggest bubble I've seen in my career." - Stanley Druckenmiller, billionaire investor.


“Inflation is not going to be transitory; I’ve been pretty certain in my mind about three prior calls. This is the fourth one.” - Mohamed El-Erian, Chief economic adviser at Allianz SE

JOBLESS CLAIMS (WSJ)

“U.S. jobless claims fell slightly to 385,000 last week, as worker filings for new unemployment benefits settled this summer at a level that is nearly double the pre-pandemic average" Story at...

https://www.wsj.com/articles/weekly-jobless-claims-08-05-2021-11628113581


TAXES TOO DARNED HIGH – RETARDING THE ECONOMY (McClellan Financial Publications)

“Low taxes are a big stimulus to economic activity.  Everyone knows that.  Curiously, not everyone understands that high taxes are a giant restriction on the economy.  This week’s chart helps to offer evidence of that latter point.  We have several decades of history to show us that jacking up tax collections to too high of a portion of GDP is a big restriction on the economy, so much so that it tends to snuff out economic activity.  18% appears to be the magic number, since every time that total tax receipts as a percentage of GDP has gone above that number, it has resulted in a recession... How this is going to play out for the months ahead is something that remains to be seen.  But it is not good news for the stock market bulls.” - Tom McClellan, Editor, The McClellan Market Report. Commentary at...

https://www.mcoscillator.com/learning_center/weekly_chart/taxes_too_darned_high_retarding_the_economy/

My cmt: Perhaps, but if the Gov’t is going to spend, we need taxes to pay for the expenditures.  Seems logical, but no one ever accused Politicians of being logical.


AUGUST HAS NOT BEEN KIND TO THE BULLS (Heritage Capital, 2 Aug)

“In January I forecast that stocks would peak by Labor Day and then see their largest decline since at least October. Given that Labor Day is only a month away, I am sticking by a peak this month with weakness into September and on. However, I do not see any confirmation just yet and I do not believe the bulls have exhausted themselves. That could be coming this month. August is going to be a very interesting, telling and important month.” – Paul Schatz, President Heritage Capital. Commentary at...

https://investfortomorrow.com/blog/august-has-not-been-kind-to-the-bulls/


CORONAVIRUS (NTSM)

Here’s the latest from the COVID19 Johns Hopkins website as of 5:30 PM Thursday. U.S. total case numbers are on the left axis; daily numbers are on the right side of the graph in Red with the 10-dMA of daily numbers in Green.


MARKET REPORT / ANALYSIS

-Thursday the S&P 500 rose about 0.6% to 4429.

-VIX dipped about 4% to 17.28.

-The yield on the 10-year Treasury rose to 1.224%.


The daily sum of 20 Indicators improved from -9 to -5 (a positive number is bullish; negatives are bearish); the 10-day smoothed sum that smooths the daily fluctuations declined from -40 to -43. (These numbers sometimes change after I post the blog based on data that comes in late.) Most of these indicators are short-term and many are trend following.


The Long Term NTSM indicator remained HOLD. Volume, VIX, Price & Sentiment are neutral.


I remain cautiously bullish.


MOMENTUM ANALYSIS:

TODAY’S RANKING OF 15 ETFs (Ranked Daily)

The top ranked ETF receives 100%. The rest are then ranked based on their momentum relative to the leading

ETF.

*For additional background on the ETF ranking system see NTSM Page at…

http://navigatethestockmarket.blogspot.com/p/exchange-traded-funds-etf-ranking.html


TODAY’S RANKING OF THE DOW 30 STOCKS (Ranked Daily)

Here’s the revised DOW 30 and its momentum analysis. The top ranked stock receives 100%. The rest are then ranked based on their momentum relative to the leading stock.

For more details, see NTSM Page at…

https://navigatethestockmarket.blogspot.com/p/a-system-for-trading-dow-30-stocks-my_8.html


THURSDAY MARKET INTERNALS (NYSE DATA)

Market Internals remained NEUTRAL on the market.


Market Internals are a decent trend-following analysis of current market action, but should not be used alone for short term trading. They are usually right, but they are often late.  They are most useful when they diverge from the Index. 


Using the Short-term indicator in 2018 in SPY would have made a 5% gain instead of a 6% loss for buy-and-hold. The methodology was Buy on a POSITIVE indication and Sell on a NEGATIVE indication and stay out until the next POSITIVE indication. The back-test included 13-buys and 13-sells, or a trade every 2-weeks on average.  

My stock-allocation is about 50% invested in stocks. I am not super bullish (or bearish) and I am watching the markets closely.


You may wish to have a higher or lower % invested in stocks depending on your risk tolerance. 50% is a conservative position that I consider fully invested for most retirees. As a retiree, 50% in the stock market is about fully invested for me – it is a cautious and conservative number. If I feel very confident, I might go to 60%; if a correction is deep enough, and I can call a bottom, 80% would not be out of the question.

Wednesday, August 4, 2021

ADP Employment ... ISM Non-Manufacturing ... EIA Crude Inventories … Coronavirus (Covid-19) … Stock Market Analysis … ETF Trading … Dow 30 Ranking

“Trade what you see; not what you think.” – The Old Fool, Richard McCranie, trader extraordinaire.


“People always ask me what is going on in the markets. It is simple. Greatest Speculative Bubble of All Time in All Things. By two orders of magnitude.” – Michael “Big Short” Burry.


"If I was Darth Vader and I wanted to destroy the US economy, I would do aggressive spending in the middle of an already hot economy...This is the biggest bubble I've seen in my career." - Stanley Druckenmiller, billionaire investor.


“Inflation is not going to be transitory; I’ve been pretty certain in my mind about three prior calls. This is the fourth one.” - Mohamed El-Erian, Chief economic adviser at Allianz SE


ADP EMPLOYMENT CHANGE (CNBC)

“Job creation at private companies tumbled in July as fears mounted over the spreading Covid-19 delta variant, payroll processing firm ADP reported Wednesday. Employers added 330,000 positions for the month, a sharp deceleration from the downwardly revised 680,000 in June.” Story at...

https://www.cnbc.com/2021/08/04/private-companies-added-330000-jobs-in-july-according-to-adp-far-short-of-the-653000-estimate.html


ISM NON-MANUFACTURING INDEX (Reuters)

“A measure of U.S. services industry activity jumped to a record high in July, boosted by the shift in spending to services from goods, but businesses continued to pay higher prices for inputs because of supply constraints.” Story at...

https://www.reuters.com/world/us/us-private-payrolls-growth-slows-july-adp-2021-08-04/


EIA CRUDE INVENTORIES (EIA)

“U.S. commercial crude oil inventories (excluding those in the Strategic Petroleum Reserve) increased by 3.6 million barrels from the previous week. At 439.2 million barrels, U.S. crude oil inventories are about 6% below the five year average for this time of year.” Story at...

https://ir.eia.gov/wpsr/wpsrsummary.pdf


LAWYERS SANCTIONED OVER “FANTASTICAL” SUIT ALLEGING US ELECTION WAS STOLEN (msn.com)

“A U.S. judge on Wednesday sanctioned two lawyers who brought a lawsuit alleging the 2020 presidential election was stolen from Donald Trump and his supporters, calling their case "one enormous conspiracy theory."... [The Judge] Neureiter ordered the two lawyers, Gary D. Fielder and Ernest John Walker, to pay the legal fees incurred by people and entities they sued, including Facebook Inc and voting machine company Dominion Voting Systems Inc.” Story at...

Lawyers sanctioned over 'fantastical' suit alleging 2020 U.S. election was stolen (msn.com)

My cmt: Once again, independent review shows that Trump’s “stolen election” wasn’t stolen. The Trump lawsuits have been shown to be completely without merit, so much so, that (once again) the lawyers bringing the suits have been sanctioned.

“The judge also noted that Trump Attorney General William Barr said as early as Dec. 1 that the FBI had investigated and found no evidence of fraud on a scale that would have affected Biden’s victory.” From...

https://www.coloradopolitics.com/denver/denver-judge-questions-facts-in-dismissed-election-lawsuit-involving-dominion-facebook/article_c67642d2-e5ee-11eb-957c-9b1ead2b18d7.html.


INFRASTRUCTURE BILL MANDATES DRUNK-DRIVER DETECTOR FOR NEW CARS (ZeroHedge)

“The $1 trillion infrastructure bill - a bipartisan 2,702-page bill that has been locked in negotiations for months between Democrats and Republicans will mandate all new vehicles must have the technology to detect drunk drivers and alert systems to check backseats before turning off the vehicle. A final vote is likely before next Monday.” Story at... 

https://www.zerohedge.com/political/infrastructure-bill-mandates-new-cars-detect-drunk-driver

My cmt: I wonder if this technology is proven and will be error free? I am very skeptical; Politicians do stupid stuff all the time. Your pupils are dilated from the eye-doctor’s drops? Tough luck – the car won’t let you drive! I’m making this up, but the systems do measure eye movements. I am sure that there will be failures that will be very frustrating for those involved.


CORONAVIRUS (NTSM)

Here’s the latest from the COVID19 Johns Hopkins website as of 5:00 PM Wednesday. U.S. total case numbers are on the left axis; daily numbers are on the right side of the graph in Red with the 10-dMA of daily numbers in Green.


MARKET REPORT / ANALYSIS

-Wednesday the S&P 500 dipped about 0.5% to 4403.

-VIX dipped about 0.4% to 17.97.

-The yield on the 10-year Treasury rose to 1.184%.


The daily sum of 20 Indicators declined from -5 to -9 (a positive number is bullish; negatives are bearish); the 10-day smoothed sum that smooths the daily fluctuations declined from -35 to -40. (These numbers sometimes change after I post the blog based on data that comes in late.) Most of these indicators are short-term and many are trend following.


The Long Term NTSM indicator remained HOLD. Volume, VIX, Price & Sentiment are neutral.


I am cautiously bullish. I’ll get concerned if this down-move becomes a trend.


MOMENTUM ANALYSIS:

TODAY’S RANKING OF 15 ETFs (Ranked Daily)

The top ranked ETF receives 100%. The rest are then ranked based on their momentum relative to the leading

ETF.


*For additional background on the ETF ranking system see NTSM Page at…

http://navigatethestockmarket.blogspot.com/p/exchange-traded-funds-etf-ranking.html


TODAY’S RANKING OF THE DOW 30 STOCKS (Ranked Daily)

Here’s the revised DOW 30 and its momentum analysis. The top ranked stock receives 100%. The rest are then ranked based on their momentum relative to the leading stock.

For more details, see NTSM Page at…

https://navigatethestockmarket.blogspot.com/p/a-system-for-trading-dow-30-stocks-my_8.html


WEDNESDAY MARKET INTERNALS (NYSE DATA)

Market Internals remained NEUTRAL on the market.


Market Internals are a decent trend-following analysis of current market action, but should not be used alone for short term trading. They are usually right, but they are often late.  They are most useful when they diverge from the Index. 


Using the Short-term indicator in 2018 in SPY would have made a 5% gain instead of a 6% loss for buy-and-hold. The methodology was Buy on a POSITIVE indication and Sell on a NEGATIVE indication and stay out until the next POSITIVE indication. The back-test included 13-buys and 13-sells, or a trade every 2-weeks on average.  

My stock-allocation is about 50% invested in stocks. I am not super bullish (or bearish) and I am watching the markets closely.


You may wish to have a higher or lower % invested in stocks depending on your risk tolerance. 50% is a conservative position that I consider fully invested for most retirees. As a retiree, 50% in the stock market is about fully invested for me – it is a cautious and conservative number. If I feel very confident, I might go to 60%; if a correction is deep enough, and I can call a bottom, 80% would not be out of the question.

Tuesday, August 3, 2021

Factory Orders ... Evidence of Chinese Covid Lab Leak Increases … Coronavirus (Covid-19) … Stock Market Analysis … ETF Trading … Dow 30 Ranking

“Trade what you see; not what you think.” – The Old Fool, Richard McCranie, trader extraordinaire.


“People always ask me what is going on in the markets. It is simple. Greatest Speculative Bubble of All Time in All Things. By two orders of magnitude.” – Michael “Big Short” Burry.


"If I was Darth Vader and I wanted to destroy the US economy, I would do aggressive spending in the middle of an already hot economy...This is the biggest bubble I've seen in my career." - Stanley Druckenmiller, billionaire investor.


“Inflation is not going to be transitory; I’ve been pretty certain in my mind about three prior calls. This is the fourth one.” - Mohamed El-Erian, Chief economic adviser at Allianz SE


FACTORY ORDERS (Reuters)

“New orders for U.S.-made goods increased more than expected in June, while business spending on equipment was solid, pointing to sustained strength in manufacturing even as spending is shifting away from goods to services. The Commerce Department said on Tuesday that factory orders rose 1.5% in June...” Story at...

https://www.reuters.com/article/usa-economy-manufacturing/u-s-factory-orders-beat-expectations-in-june-business-spending-on-equipment-solid-idUSL1N2P91RL


CRESTMONT PE (Advisor Perspectives)

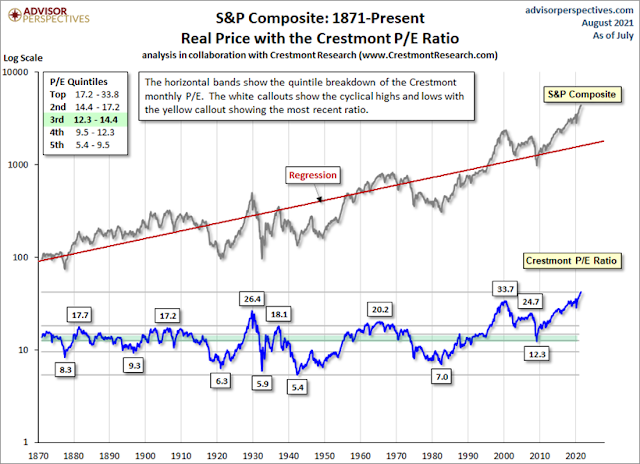
“The Crestmont P/E of 42.2 is 188% above its average (arithmetic mean) and at the 100th percentile of this fourteen-plus-decade series. We've highlighted a couple more level-driven periods in this chart: the current rally, which started in early 2014, and the two months in 1929 with P/E above the 25 level. Note the current period is within the same neighborhood as both the tech bubble and the 1929 periods, all with P/E above 25 and is certainly in the zone of "irrational exuberance". Commentary at...

https://www.advisorperspectives.com/dshort/updates/2021/08/02/crestmont-market-valuation-update-july-2021

My cmt: PE is not an indicator to use for timing the market. It can remain irrationally high for years. Since there are now fewer stocks and more investors, the demand exceeds the supply. Higher stock prices, and thus PEs, are to be expected. How high is too high? Apparently, the markets are not there yet.


JOHN RADCLIFF – CHINA COVID COVERUP (FOX News)

“I had access to all of the U.S. government’s most sensitive intelligence related to the pandemic. My informed opinion is that the lab leak theory isn’t just a "possibility," at the very least it is more like a probability, if not very close to a certainty.” - John Ratcliffe, former Director of National Intelligence. From... 

https://www.foxnews.com/opinion/china-olympics-2022-covid-cover-up-games-john-ratcliffe


BOMBSHELL COVID REPORT (MSN.com)

“The minority staff of the House Foreign Affairs Committee released a bombshell report this morning, concluding for the first time that “the preponderance of the evidence suggests SARS-CoV-2 was accidentally released from a Wuhan Institute of Virology (WIV) laboratory sometime prior to September 12, 2019." Story at...

Following bombshell COVID-19 report, will Democrats force Daszak to testify? (msn.com)


CORONAVIRUS (NTSM)

Here’s the latest from the COVID19 Johns Hopkins website as of 7:00 PM Tuesday. US total case numbers are on the left axis; daily numbers are on the right side of the graph with the 10-dMA of daily numbers in Green.


MARKET REPORT / ANALYSIS

-Tuesday the S&P 500 rose about 0.8% to 4423.

-VIX dropped about 7% to 18.04.

-The yield on the 10-year Treasury slipped to 1.175%.


5.0% of all issues traded on the NYSE made new, 52-week highs when the S&P 500 made a new all-time-high today, 3 August. This is below average, but not low enough to send a bear signal – something to watch.


Today was a statistically significant up-day. That just means that the price-volume move exceeded my statistical parameters. Statistics show that a statistically-significant, up-day is followed by a down-day about 60% of the time.  Statistically-significant, up-days almost always coincide with tops, but not all statistically-significant, up-days occur at tops. Today could be a top, but there are only 3 top indicators warning and that is not a strong top signal.


The daily sum of 20 Indicators declined from -1 to -5 (a positive number is bullish; negatives are bearish); the 10-day smoothed sum that smooths the daily fluctuations improved from -40 to -35. (These numbers sometimes change after I post the blog based on data that comes in late.) Most of these indicators are short-term and many are trend following.


The Short-term, market-internals ensemble indicator declined to NEUTRAL.


The Long Term NTSM indicator remained HOLD. Volume, VIX, Price & Sentiment are neutral.


I am cautiously bullish.


MOMENTUM ANALYSIS:

TODAY’S RANKING OF 15 ETFs (Ranked Daily)

The top ranked ETF receives 100%. The rest are then ranked based on their momentum relative to the leading

ETF.

*For additional background on the ETF ranking system see NTSM Page at…

http://navigatethestockmarket.blogspot.com/p/exchange-traded-funds-etf-ranking.html


TODAY’S RANKING OF THE DOW 30 STOCKS (Ranked Daily)

Here’s the revised DOW 30 and its momentum analysis. The top ranked stock receives 100%. The rest are then ranked based on their momentum relative to the leading stock.

For more details, see NTSM Page at…

https://navigatethestockmarket.blogspot.com/p/a-system-for-trading-dow-30-stocks-my_8.html


TUESDAY MARKET INTERNALS (NYSE DATA)

Market Internals slipped to NEUTRAL on the market.


Market Internals are a decent trend-following analysis of current market action, but should not be used alone for short term trading. They are usually right, but they are often late.  They are most useful when they diverge from the Index. 


Using the Short-term indicator in 2018 in SPY would have made a 5% gain instead of a 6% loss for buy-and-hold. The methodology was Buy on a POSITIVE indication and Sell on a NEGATIVE indication and stay out until the next POSITIVE indication. The back-test included 13-buys and 13-sells, or a trade every 2-weeks on average.  


My stock-allocation is about 50% invested in stocks. I am not super bullish (or bearish) and I am watching the markets closely.


You may wish to have a higher or lower % invested in stocks depending on your risk tolerance. 50% is a conservative position that I consider fully invested for most retirees. As a retiree, 50% in the stock market is about fully invested for me – it is a cautious and conservative number. If I feel very confident, I might go to 60%; if a correction is deep enough, and I can call a bottom, 80% would not be out of the question.


Monday, August 2, 2021

Earnings ... ISM Manufacturing ... Construction Spending … Never Waste Bad Weather ... Coronavirus (Covid-19) … Stock Market Analysis … ETF Trading … Dow 30 Ranking

“Trade what you see; not what you think.” – The Old Fool, Richard McCranie, trader extraordinaire.


“People always ask me what is going on in the markets. It is simple. Greatest Speculative Bubble of All Time in All Things. By two orders of magnitude.” – Michael “Big Short” Burry.


"If I was Darth Vader and I wanted to destroy the US economy, I would do aggressive spending in the middle of an already hot economy...This is the biggest bubble I've seen in my career." - Stanley Druckenmiller, billionaire investor.


“Inflation is not going to be transitory; I’ve been pretty certain in my mind about three prior calls. This is the fourth one.” - Mohamed El-Erian, Chief economic adviser at Allianz SE


EARNINGS (FACTSET)

“At this point in time, more S&P 500 companies are beating EPS estimates for the second quarter than average, and beating EPS estimates by a wider margin than average. As a result, the index is reporting higher earnings for the second quarter today relative to the end of last week and relative to the end of the quarter. The index is currently reporting the highest year-over-year growth in earnings since Q4 2009. Analysts also expect double-digit earnings growth for the second half of 2021.” Analysis at...

https://insight.factset.com/sp-500-earnings-season-update-july-30-2021


ISM MANUFACTURING (Reuters)

“U.S. manufacturing continued to grow in July, though the pace slowed for the second straight month as spending rotates back to services from goods and shortages of raw materials persist. The Institute for Supply Management (ISM) said on Monday its index of national factory activity fell to 59.5 last month...” Story at...

https://www.reuters.com/article/usa-economy-manufacturing/u-s-manufacturing-sector-growth-slowing-ism-idUSN9N2M1029


CONSTRUCTION SPENDING (KFGO)

“U.S. construction spending rose by 0.1% in June, the Commerce Department said on Monday, as an increase in private projects was offset by a fall in public sector building.

https://kfgo.com/2021/08/02/u-s-construction-spending-inches-higher-in-june/


TO ADVANCE THE CLIMATE AGENDA – NEVER WASTE BAD WEATHER (Real Clear Energy)

“Climate alarmists, of course, expect the public to believe that the drought is caused by global warming. But the natural history of the West over the past 1,100 years shows that megadroughts lasting as long as 200 years are the norm rather than the exception. And since the federal and state governments kicked out the loggers and stopped managing public lands 40 years ago, these wildfires may come back every year until there is nothing left in the West to burn...

...According to the most recent NASA satellite data, the average global temperature for June 2021 was slightly below the 30-average. But don’t expect climate and weather reality to dampen the alarm repeated over and over every day in the media. President Biden and Democrats plan to pass a $3.5 trillion “stimulus” bill in the fall. About $2 trillion of the spending is earmarked for climate.”

https://www.realclearenergy.org/articles/2021/07/29/to_advance_the_climate_agenda_never_waste_bad_weather_787707.html

My cmt: Oh, by the way...they are having record cold in Brazil, including snow that some had not seen on more than 60 years.


CORONAVIRUS (NTSM)

Here’s the latest from the COVID19 Johns Hopkins website as of 7:00 PM Monday. US total case numbers are on the left axis; daily numbers are on the right side of the graph with the 10-dMA of daily numbers in Green.


Monday was another day with more than 100,000 new cases. China has some serious lockdowns underway.  My guess is that the US will not have another lockdown.


MARKET REPORT / ANALYSIS

-Monday the S&P 500 dropped about 0.2% to 4387.

-VIX rose about 7% to 8.46.

-The yield on the 10-year Treasury slipped to 1.178%.


While a chart over the last 3 months shows the S&P 500 near its upper trend line, a longer-term chart is much more optimistic. The longer-term chart, say back to November 2020, shows that the Index has a lot of room to run higher. Whether it will, remains to be seen. It is very likely, but we could always see a correction first.


One worrisome sign is that sentiment is very high. I measure Sentiment as %-Bulls (Bulls/{bulls+bears}) based on the amounts invested in Rydex/Guggenheim mutual funds. It is currently at 96%-bulls (as of Wednesday’s close) on a 5-day average. On a standard deviation basis this close to levels seen during the dot.com crash. This isn’t by itself a great indicator since sentiment can remain elevated for some time, but it is a level that is close to a point that has preceded pullbacks of varying degrees – from small pullbacks of a couple % to major crashes.  I’d need to see a slightly higher sentiment and more negative signs to take action, but it is a cautionary indication.


Today, we had extremely high, unchanged-volume.  In theory this in an indication that investors are confused and it can signal a reversal. I’ve tried to develop an indicator based on this without much success.  Sometimes it’s true; sometimes not.


The daily sum of 20 Indicators improved from -1 to +1 (a positive number is bullish; negatives are bearish); the 10-day smoothed sum that smooths the daily fluctuations improved from -55 to -40. (These numbers sometimes change after I post the blog based on data that comes in late.) Most of these indicators are short-term and many are trend following.


The Short-term, market-internals ensemble indicator remained POSITIVE/BULLISH.


The Long Term NTSM indicator remained HOLD. Volume is bullish; VIX, Price & Sentiment are neutral.


I am cautiously bullish.


MOMENTUM ANALYSIS:

TODAY’S RANKING OF 15 ETFs (Ranked Daily)

The top ranked ETF receives 100%. The rest are then ranked based on their momentum relative to the leading

ETF.


*For additional background on the ETF ranking system see NTSM Page at…

http://navigatethestockmarket.blogspot.com/p/exchange-traded-funds-etf-ranking.html

TODAY’S RANKING OF THE DOW 30 STOCKS (Ranked Daily)

Here’s the revised DOW 30 and its momentum analysis. The top ranked stock receives 100%. The rest are then ranked based on their momentum relative to the leading stock.

For more details, see NTSM Page at…

https://navigatethestockmarket.blogspot.com/p/a-system-for-trading-dow-30-stocks-my_8.html

MONDAY MARKET INTERNALS (NYSE DATA)

Market Internals remained POSITIVE on the market.


Market Internals are a decent trend-following analysis of current market action, but should not be used alone for short term trading. They are usually right, but they are often late.  They are most useful when they diverge from the Index. 


Using the Short-term indicator in 2018 in SPY would have made a 5% gain instead of a 6% loss for buy-and-hold. The methodology was Buy on a POSITIVE indication and Sell on a NEGATIVE indication and stay out until the next POSITIVE indication. The back-test included 13-buys and 13-sells, or a trade every 2-weeks on average.  


My stock-allocation is about 50% invested in stocks. I am not super bullish (or bearish) and I am watching the markets closely.


You may wish to have a higher or lower % invested in stocks depending on your risk tolerance. 50% is a conservative position that I consider fully invested for most retirees. As a retiree, 50% in the stock market is about fully invested for me – it is a cautious and conservative number. If I feel very confident, I might go to 60%; if a correction is deep enough, and I can call a bottom, 80% would not be out of the question.