Tuesday, May 24, 2022

Best DOW Stocks ... Best ETFs … Stock Market Analysis ... New Home Sales ... IHS Markit Composite

“Trade what you see; not what you think.” – The Old Fool, Richard McCranie, trader extraordinaire.


“Faced with a combination of record speculative extremes and deteriorating speculative conditions, investors may want to remember that the best time to panic is before everyone else does.” – John Hussman, Phd.


NEW HOME SALES (money.yahoo)

“New home sales dropped for the fourth straight month in April, offering up another sign that the housing market is starting to slow. The volume of new singlefamily home sale fell...16.6% from the March rate and 26.9% lower than the rate a year ago.” Story at...

https://money.yahoo.com/new-home-sales-plunge-cooling-housing-market-154050122.html


IHS MARKIT COMPOSITE PMI (S&P Global Intelligence)

“Latest ‘flash’ PMI™ data from S&P Global indicated a slower expansion in business activity across the US private sector during May. Manufacturers and service providers signaled softer upturns in output amid elevated inflationary pressures, a further deterioration in supplier delivery times and weaker demand growth. The headline Flash US PMI Composite Output Index registered 53.8 in May, down from 56.0 in April...” Press release at...

https://www.markiteconomics.com/Public/Home/PressRelease/b669b93cb25f4270952e1d9a03be464e


 A BIG BEARISH WORRY (NTSM)


If investors were confident, they wouldn’t be buying Utilities like they have been recently. The red line below zero means XLU is outperforming the S&P 500. The falling line indicates it is getting worse.


MARKET REPORT / ANALYSIS

-Tuesday the S&P 500 FELL about 0.8% to 3941.

-VIX rose about 3% to 29.45.

-The yield on the 10-year Treasury rose to 2.763% as of this post.


PULLBACK DATA:

-Drop from Top: 17.8% as of today. 18.7% max. (Avg.= 13% for non-crash pullbacks)

-Days from Top to Bottom: 98-days. (Avg= 30 days top to bottom for corrections <10%; 60 days top to bottom for larger, non-crash pullbacks)

The S&P 500 is 11.7% BELOW its 200-dMA & 8.2% BELOW its 50-dMA.

*I won’t call the correction over until the S&P 500 makes a new-high; however, we hope to be able to call the bottom when we see it...and... we did call the market a trading “Buy” one day after the recent trading bottom on 12 May... 


MY TRADING POSITIONS:

QQQ*

UWM*

XLE

DOW

*Sell when the markets are overbought or if the bounce makes it to the 50-dMA.


TODAY’S COMMENT:

I would have preferred a positive day today, but there were some bright spots. Tuesday’s close was above Thursday’s intra-day low and was well above last week’s closes on Wednesday, Thursday and Friday; MACD made a bullish crossover today; My Money Trend indicator is headed in a bullish direction; RSI is overbought; Sentiment remained bullish and my late-day-action indicator is overbought. These triggered my “Bottom Indicator”, although this is an alarm rather than a clear “Buy” signal.


All-in-all, I am not going to panic over my trades, yet...still waiting for that rally.


Today, the daily sum of 20 Indicators improved from +10 to +11 (a positive number is bullish; negatives are bearish); the 10-day smoothed sum that smooths the daily fluctuations improved from +30 to +40. (The trend direction is more important than the actual number for the 10-day value.) These numbers sometimes change after I post the blog based on data that comes in late. Most of these 20 indicators are short-term so they tend to bounce around a lot.


LONG-TERM INDICATOR: The Long Term NTSM indicator was HOLD: VIX is bearish; SENTIMENT was bullish; VOLUME and PRICE are hold.  44 days out of the last 100 have been up-days; that leans bullish.


I am cautiously Bullish in the short-term and Bearish longer-term. I expect a rally in the 7-9% range. 4300 is as good a target as any: it would be a 50% retracement and it is also currently the 50-dMA.


BEST ETFs - MOMENTUM ANALYSIS:

TODAY’S RANKING OF 15 ETFs (Ranked Daily)

The top ranked ETF receives 100%. The rest are then ranked based on their momentum relative to the leading ETF.

*For additional background on the ETF ranking system see NTSM Page at…

http://navigatethestockmarket.blogspot.com/p/exchange-traded-funds-etf-ranking.html


BEST DOW STOCKS - TODAY’S MOMENTUM RANKING OF THE DOW 30 STOCKS (Ranked Daily)

Here’s the revised DOW 30 and its momentum analysis. The top ranked stock receives 100%. The rest are then ranked based on their momentum relative to the leading stock.

For more details, see NTSM Page at…

https://navigatethestockmarket.blogspot.com/p/a-system-for-trading-dow-30-stocks-my_8.html


TUESDAY MARKET INTERNALS (NYSE DATA)

My basket of Market Internals remained BUY.


Market Internals are a decent trend-following analysis of current market action, but should not be used alone for short term trading. They are usually right, but they are often late.  They are most useful when they diverge from the Index. 


My stock-allocation in the portfolio is now roughly 45% invested in stocks, but some percentage includes trading-positions that I will exit if a rally fails to materialize. This is slightly below my “normal” fully invested stock-allocation of 50%.


I trade about 15-20% of the total portfolio using the momentum-based analysis I provide here. If I can see a definitive bottom, I’ll add a lot more stocks to the portfolio using an S&P 500 ETF.


You may wish to have a higher or lower % invested in stocks depending on your risk tolerance. 50% is a conservative position that I consider fully invested for most retirees.


As a general rule, some suggest that the % of portfolio invested in the stock market should be one’s age subtracted from 100.  So, a 30-year-old person would have 70% of the portfolio in stocks, stock mutual funds and/or stock ETFs.  That’s ok, but for older investors, I usually don’t recommend keeping less than 50% invested in stocks (as a fully invested position) since most people need some growth in the portfolio to keep up with inflation.

Monday, May 23, 2022

Best DOW Stocks ... Best ETFs … Stock Market Analysis ... Rally Time

“Trade what you see; not what you think.” – The Old Fool, Richard McCranie, trader extraordinaire.


“Faced with a combination of record speculative extremes and deteriorating speculative conditions, investors may want to remember that the best time to panic is before everyone else does.” – John Hussman, Phd.


ALLIGATOR JAWS (The Felder Report)

“...when you look at the historical weighting within the S&P 500 Index, energy still comprises a smaller portion than it did 20 years ago...looking at the chart above, does it appear that energy has become overextended? Or is it more likely popular sectors like tech still have some give back ahead of them?” Commentary at...

https://thefelderreport.com/2022/05/18/an-epic-set-of-alligator-jaws-part-deux/


MARKET REPORT / ANALYSIS

-Monday the S&P 500 rose about 1.9% to 3974.

-VIX slipped about 3% to 28.48.

-The yield on the 10-year Treasury rose to 2.854%.


PULLBACK DATA:

-Drop from Top: 17.2% as of today. 18.7% max. (Avg.= 13% for non-crash pullbacks)

-Days from Top to Bottom: 97-days. (Avg= 30 days top to bottom for corrections <10%; 60 days top to bottom for larger, non-crash pullbacks)

The S&P 500 is 11% BELOW its 200-dMA & 7.5% BELOW its 50-dMA.

*I won’t call the correction over until the S&P 500 makes a new-high; however, we hope to be able to call the bottom when we see it...and... we did call the market a trading “Buy” one day after the recent trading bottom on 12 May... 


MY TRADING POSITIONS:

QQQ*

UWM*

XLE

DOW

*Sell when the markets are overbought or if the bounce makes it to the 50-dMA. As always, there is no guarantee that markets will get anywhere near that high.


TODAY’S COMMENT:

Demark Indicators and the Demark counts are a proprietary system for market timing available to subscribers of Demark Analytics at....

https://demark.com/about


 On Thursday of last week, a Demark count pattern of 9 followed by 13 was completed. That has often signaled selling exhaustion and a reversal to the upside in the markets. It was accurate at bottoms in 2011, 2016, 2018, and in the coronavirus bottom in 2020, but that may be overly optimistic. In previous cases there were policy pivots by the Fed or European Central Banks that were made at those bottoms. This time the Fed is not going to pivot to a bullish position – they are committed to continuing rate hikes and balance sheet reductions.


For more detail, listen to market commentary by Chris Ciavacco at...

https://www.youtube.com/watch?v=6ITErIBqOzc

Chris just says keep an open mind to any move. Markets are at critical levels.


My opinion is that with Sentiment, volume-clues, improvements in New-high/new-low data, all suggesting a counter-trend rally, it would not be a surprise to see a rally “lasting several weeks to several months.”  As Chris warns, markets may also fail, so Mondays’ action is critical.


Monday, we got the follow thru we had hoped for. Today was the first day since 13 April that the 10-day moving average of advancing issues was more than 50%. In plain English, more than half of the issues on the NYSE have been up in the last 10-days. My Volume indicator, a variant of On-Balance-Volume, also bounced up into the neutral zone. It had been bearish for a month. Sentiment has been so bearish that it is bullish, though I expect it to switch to neutral tonight. Breadth MACD also made a bullish crossover. So far so good.


Four days ago, all 30 Dow stocks were down; Thursday, 20% were up; Friday, 53% were up. Today, 90% were up. So far so good! - Lot’s of green shoots.


Today, the daily sum of 20 Indicators improved from -1 to +10 (a positive number is bullish; negatives are bearish); the 10-day smoothed sum that smooths the daily fluctuations improved from +18 to +30. (The trend direction is more important than the actual number for the 10-day value.) These numbers sometimes change after I post the blog based on data that comes in late. Most of these 20 indicators are short-term so they tend to bounce around a lot.


LONG-TERM INDICATOR: The Long Term NTSM indicator was HOLD: VIX is bearish; SENTIMENT was bullish; VOLUME and PRICE are hold.  44 days out of the last 100 have been up-days; that leans bullish.


I am cautiously Bullish in the short-term and Bearish longer-term. I expect a rally in the 7-9% range. 4300 is as good a target as any: it would be a 50% retracement and it is also currently the 50-dMA.


BEST ETFs - MOMENTUM ANALYSIS:

TODAY’S RANKING OF 15 ETFs (Ranked Daily)

The top ranked ETF receives 100%. The rest are then ranked based on their momentum relative to the leading ETF.

*For additional background on the ETF ranking system see NTSM Page at…

http://navigatethestockmarket.blogspot.com/p/exchange-traded-funds-etf-ranking.html


BEST DOW STOCKS - TODAY’S MOMENTUM RANKING OF THE DOW 30 STOCKS (Ranked Daily)

Here’s the revised DOW 30 and its momentum analysis. The top ranked stock receives 100%. The rest are then ranked based on their momentum relative to the leading stock.

For more details, see NTSM Page at…

https://navigatethestockmarket.blogspot.com/p/a-system-for-trading-dow-30-stocks-my_8.html


MONDAY MARKET INTERNALS (NYSE DATA)

My basket of Market Internals improved to BUY.


Market Internals are a decent trend-following analysis of current market action, but should not be used alone for short term trading. They are usually right, but they are often late.  They are most useful when they diverge from the Index. 


My stock-allocation in the portfolio is now roughly 45% invested in stocks, but some percentage includes trading-positions that I will exit if the rally fails. This is slightly below my “normal” fully invested stock-allocation of 50%.


I trade about 15-20% of the total portfolio using the momentum-based analysis I provide here. If I can see a definitive bottom, I’ll add a lot more stocks to the portfolio using an S&P 500 ETF.


You may wish to have a higher or lower % invested in stocks depending on your risk tolerance. 50% is a conservative position that I consider fully invested for most retirees.


As a general rule, some suggest that the % of portfolio invested in the stock market should be one’s age subtracted from 100.  So, a 30-year-old person would have 70% of the portfolio in stocks, stock mutual funds and/or stock ETFs.  That’s ok, but for older investors, I usually don’t recommend keeping less than 50% invested in stocks (as a fully invested position) since most people need some growth in the portfolio to keep up with inflation.

Friday, May 20, 2022

Best DOW Stocks ... Best ETFs … Stock Market Analysis ...

“Trade what you see; not what you think.” – The Old Fool, Richard McCranie, trader extraordinaire.


“Faced with a combination of record speculative extremes and deteriorating speculative conditions, investors may want to remember that the best time to panic is before everyone else does.” – John Hussman, Phd.

From...

https://michaelpramirez.com/index.html


CASS TRANSPORTATION REPORT (CASS Information Systems)

“U.S. freight volumes fell in April from March and the year-ago period. And with more difficult comparisons in the next few months as global supply chain disruptions are set to intensify, more softness is on the horizon. The shipments component of the Cass Freight Index fell 0.5% y/y, following a 0.6% y/y increase in March. The shipments component of the Cass Freight Index fell 2.6% from March, and this was 0.9% below the normal seasonal pattern.

...The prospect of freight recession is now considerable, as substitution from goods back to services spending picks up pace, and as inflation slows overall spending, particularly via higher fuel prices and by pressing up interest rates.” Report at...

https://www.cassinfo.com/freight-audit-payment/cass-transportation-indexes/april-2022


NASTY DECLINE [WEDNESDAY] BUT NOT THE END OF THE WORLD (Heritage Capital)

“Oftentimes, we after an initial low, we see prices surge and then immediately come back to revisit those prices within a few a days or so...If I am wrong then the stock market should unravel right away and accelerate lower. In that case I will obviously reassess.” – Paul Schatz, President Heritage Capital. Commentary at...

https://investfortomorrow.com/blog/nasty-decline-but-not-the-end-of-the-world/

The markets haven’t unraveled so I’d guess that Mr. Schatz remains in agreement with me – a rally is likely.


MARKET REPORT / ANALYSIS

-Friday the S&P 500 was unchanged at 3901. (It was down until mid-day and then rallied nearly 100 pts all afternoon.)

-VIX rose about 0.1% to 29.43.

-The yield on the 10-year Treasury slipped to 2.785%.


PULLBACK DATA:

-Drop from Top: 18.7% as of today. 18.7% max. (Avg.= 13% for non-crash pullbacks)

-Days from Top to Bottom: 96-days. (Avg= 30 days top to bottom for corrections <10%; 60 days top to bottom for larger, non-crash pullbacks)

The S&P 500 is 12.7% BELOW its 200-dMA & 9.3% BELOW its 50-dMA.

*I won’t call the correction over until the S&P 500 makes a new-high; however, we hope to be able to call the bottom when we see it...and... we did call the market a trading “Buy” one day after the recent trading bottom on 12 May...  

...I still think we are at or very near a trading bottom,, but Monday will be the deciding day.


MY TRADING POSITIONS:

QQQ*

UWM*

XLE

DOW

*Sell when the markets are overbought. The was a decent recovery in the afternoon Friday – we need to see follow-thru Monday. I’ll be out of these if the S&P 500 doesn’t have a good day Monday.


TODAY’S COMMENT:

I measure Sentiment as %-Bulls (Bulls/{bulls+bears}) based on the amounts invested in selected Rydex/Guggenheim mutual funds. My Sentiment indicator was Bullish at the close Thursday.  (I won’t get today’s numbers until late tonight.) This indicator was also bullish 2 months ago and the S&P 500 responded with a 5% rally before resuming its fall.


Today, there was high unchanged volume. Many believe that this indicator suggests investor confusion at market turning points. Recent history shows this indicator has indicated a reversal of some kind, either now, or near future. My problem is that it is frequently a false signal. At this point if the indicator is sending a decent signal, the direction of reversal would be up.


Three days ago, all 30 Dow stocks were down; yesterday, 20% were up; today, 53% were up. This trend needs to continue!


On Fridays, I summarize a number of indicators to get a weekly feel for trend. Overall, the end-of-week summary remained well to the Bear side (15-bear and 6-bull). These indicators tend to be both long-term and short-term, so they are different than the 20 that I report on daily. Details follow:


BULL SIGNS

-Non-crash Sentiment indicator.

-McClellan Oscillator is positive.

-The S&P 500 is 12.7% below its 200-dMA. (Bull indicator is 12% below the 200-day.)

-The 5-dEMA of the Fosback Hi-Low Logic Index is bullish.

-The 52-week, New-high/new-low ratio improved by 3.5 standard deviations on 13 May. It is still in effect.

- Buying Pressure minus Selling Pressure turned up 20 May, but just barely.


NEUTRAL

-There were 90% down-volume days 5 May and 9 May followed by a 90%-upside, volume-reversal last Friday. That was very bullish, but there was a 90% down-volume day Wednesday and that cancels the prior bullish signal.

-Friday a week ago was a Bullish Outside Reversal Day - expired.

-Short-term new-high/new-low data is flat.

-The Smart Money (late-day action) is flat. (This indicator is based on the Smart Money Indicator developed by Don Hayes).

-Issues advancing on the NYSE (Breadth) compared to the S&P 500 was neutral.

-Bollinger Bands.

-Overbought/Oversold Index (Advance/Decline Ratio).  

-RSI.

-There have been 4 Distribution Days since the last Follow-Thru Day on 4 May.

-There was a Hindenburg Omen signal 8 April – it was canceled when the McClellan Oscillator turned bullish.

-There have been 10 up-days over the last 20 sessions – neutral.

-There have been 4 up-days over the last 10 sessions – neutral.

-The size of up-moves has been smaller than the size of down-moves over the last month, but not enough to send a signal.

-The Calm-before-the-Storm/Panic Indicator.

-2.8% of all issues traded on the NYSE made new, 52-week highs when the S&P 500 made a new all-time-high, 3 January. (There is no bullish signal for this indicator.) This indicated that the advance was too narrow and a correction was likely to be >10%. – It proved correct, but is now Expired

-Cyclical Industrials (XLI-ETF) are out-performing the S&P 500, but the trend is down – I’ll put this the neutral category.

-There have been 4 Statistically-Significant days (big moves in price-volume) in the last 15-days.


BEAR SIGNS

-The 10-dMA % of issues advancing on the NYSE (Breadth) is below 50%.

-The 50-dMA % of issues advancing on the NYSE (Breadth) is below 50%.

-The 100-dMA % of issues advancing on the NYSE (Breadth) is below 50%

-The 50-dMA % of issues advancing on the NYSE (Breadth) has been below 50% for more than 100 consecutive days. (3 days in a row is my “correction-now” signal)

-MACD of the percentage of issues advancing on the NYSE (breadth) made a bearish crossover 20 May. It was bullish earlier this week.

-MACD of S&P 500 price made a bearish crossover 7 April.

-Long-term new-high/new-low data is falling.

-My Money Trend indicator is falling.

-The smoothed advancing volume on the NYSE is falling.

-Slope of the 40-dMA of New-highs is falling. This is one of my favorite trend indicators.

-VIX has been rising sharply.

-The 5-10-20 Timer System is SELL; the 5-dEMA and 10-dEMA are both BELOW the 20-dEMA.

-The graph of the 100-day Count (the 100-day sum of up-days) was 44, up from 43 yesterday, but the chart trend is sharply down.

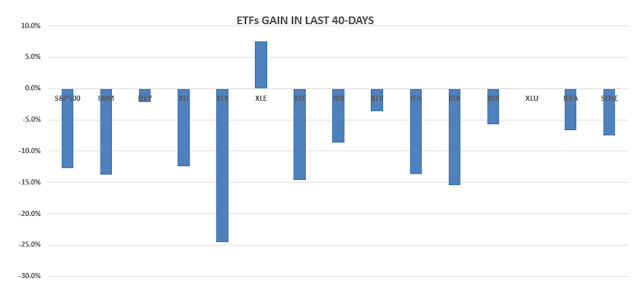
-The S&P 500 is under-performing the Utilities ETF (XLU) over the last 40 sessions.

-47% of the 15-ETFs that I track have been up over the last 10-days.


On Friday, 21 February, 2 days after the top before the Coronavirus pullback, there were 10 bear-signs and 1 bull-sign. Now there are 15 bear-signs and 6-Bull. Last week, there were 12 bear-signs and 9 bull-signs.


Today, the daily sum of 20 Indicators dropped from -3 to +2 (a positive number is bullish; negatives are bearish); the 10-day smoothed sum that smooths the daily fluctuations declined from +19 to +21. (The trend direction is more important than the actual number for the 10-day value.) These numbers sometimes change after I post the blog based on data that comes in late. Most of these 20 indicators are short-term so they tend to bounce around a lot.


LONG-TERM INDICATOR: The Long Term NTSM indicator was SELL: VOLUME and VIX are bearish; SENTIMENT & PRICE are hold.  44 days out of the last 100 have been up-days; that leans bullish. If the sentiment data I get tonight is bullish, then the indicator will be HOLD. In any event, I will be a seller of my trading positions (UWM, QQQ) on Monday unless there is some bullish action Monday.


I am cautiously Bullish in the short-term and Bearish longer-term. I expect a rally in the 7-9% range Am I right? I haven’t been yet. Today’s action was bullish since the Indices moved up all afternoon. If markets follow thru to the upside on Monday – good. If not, I’ll turn bearish.


BEST ETFs - MOMENTUM ANALYSIS:

TODAY’S RANKING OF 15 ETFs (Ranked Daily)

The top ranked ETF receives 100%. The rest are then ranked based on their momentum relative to the leading ETF.

*For additional background on the ETF ranking system see NTSM Page at…

http://navigatethestockmarket.blogspot.com/p/exchange-traded-funds-etf-ranking.html


BEST DOW STOCKS - TODAY’S MOMENTUM RANKING OF THE DOW 30 STOCKS (Ranked Daily)

Here’s the revised DOW 30 and its momentum analysis. The top ranked stock receives 100%. The rest are then ranked based on their momentum relative to the leading stock.

For more details, see NTSM Page at…

https://navigatethestockmarket.blogspot.com/p/a-system-for-trading-dow-30-stocks-my_8.html


FRIDAY MARKET INTERNALS (NYSE DATA)

My basket of Market Internals remained HOLD.


Market Internals are a decent trend-following analysis of current market action, but should not be used alone for short term trading. They are usually right, but they are often late.  They are most useful when they diverge from the Index. 


My stock-allocation in the portfolio is now roughly 45% invested in stocks, but some percentage includes trading-positions. This is slightly below my “normal” fully invested stock-allocation of 50%.


I trade about 15-20% of the total portfolio using the momentum-based analysis I provide here. If I can see a definitive bottom, I’ll add a lot more stocks to the portfolio using an S&P 500 ETF.


You may wish to have a higher or lower % invested in stocks depending on your risk tolerance. 50% is a conservative position that I consider fully invested for most retirees.


As a general rule, some suggest that the % of portfolio invested in the stock market should be one’s age subtracted from 100.  So, a 30-year-old person would have 70% of the portfolio in stocks, stock mutual funds and/or stock ETFs.  That’s ok, but for older investors, I usually don’t recommend keeping less than 50% invested in stocks (as a fully invested position) since most people need some growth in the portfolio to keep up with inflation.


Thursday, May 19, 2022

Best DOW Stocks ... Best ETFs … Stock Market Analysis ... Jobless Claims ... Philadelphia FED Index ... Leading Economic Index

“Trade what you see; not what you think.” – The Old Fool, Richard McCranie, trader extraordinaire.


“Faced with a combination of record speculative extremes and deteriorating speculative conditions, investors may want to remember that the best time to panic is before everyone else does.” – John Hussman, Phd.


“Trade what you see; not what you think.” – The Old Fool, Richard McCranie, trader extraordinaire.


“Faced with a combination of record speculative extremes and deteriorating speculative conditions, investors may want to remember that the best time to panic is before everyone else does.” – John Hussman, Phd.


JOBLESS CLAIMS (CNBC)

“New claims for U.S. unemployment benefits unexpectedly rose last week, but the labor market remains tight amid worker shortages, with the number of Americans on jobless rolls at its lowest since 1969 in early May.

Initial claims for state unemployment benefits increased 21,000 to a seasonally adjusted 218,000 for the week ended May 14...” Story at...

https://www.cnbc.com/2022/05/19/us-weekly-jobless-claims-rise-continuing-claims-lowest-since-1969.html


PHILADELPHIA FED INDEX (Philadelphia FED)

“The diffusion index for current activity fell 15 points to 2.6 in May, its lowest reading in two years... Responses to the May Manufacturing Business Outlook Survey suggest continued overall expansion for the region’s manufacturing sector. Although the indicator for current activity fell, the new orders and shipments indexes rose. The firms continued to indicate overall increases in employment and widespread increases in prices paid and received. The survey’s future indexes suggest muted optimism for growth over the next six months.” Press release at...

https://www.philadelphiafed.org/surveys-and-data/regional-economic-analysis/mbos-2022-05


LEADING ECONOMIC INDEX (Conference Board via prnewswire.com)

“The Conference Board Leading Economic Index® (LEI) for the U.S. decreased by 0.3 percent in April to 119.2 (2016 = 100), following a 0.1 percent increase in March. The LEI is now up 0.9 percent over the six-month period from October 2021 to April 2022. "The US LEI declined in April largely due to weak consumer expectations and a drop in residential building permits," said Ataman Ozyildirim, Senior Director of Economic Research at The Conference Board. "Overall, the US LEI was essentially flat in recent months which is in line with a moderate growth outlook in the near-term.” Press release at... 

https://www.prnewswire.com/news-releases/the-conference-board-leading-economic-index-lei-for-the-us-fell-in-april-301551273.html


MARKET REPORT / ANALYSIS

-Thursday the S&P 500 dropped about 0.6% to 3901.

-VIX fell about 5% to 29.35. (The Options Crowd suspects the markets are overdue for a rally?)

-The yield on the 10-year Treasury slipped to 2.893%, compared to this time yesterday.


PULLBACK DATA:

-Drop from Top: 18.7% as of today. 18.7% max. (Avg.= 13% for non-crash pullbacks)

-Days from Top to Bottom: 95-days. (Avg= 30 days top to bottom for corrections <10%; 60 days top to bottom for larger, non-crash pullbacks)

The S&P 500 is 12.7% BELOW its 200-dMA & 9.5% BELOW its 50-dMA.

*I won’t call the correction over until the S&P 500 makes a new-high; however, we hope to be able to call the bottom when we see it...and... we did call the market a trading “Buy” one day after the recent trading bottom on 12 May...  


...I still think we are at or very near a trading bottom.


MY TRADING POSITIONS:

QQQ*

UWM*

XLE

DOW

*Sell when the markets are overbought.


TODAY’S COMMENT:

General Mills, a consumer staples company selling consumer foods in a number of categories, was down 2.1% today. Its PE is 17.7.  I suppose investors are now afraid that’s too expensive for safe haven. Is the money previously invested in consumer staples going back into the market or into cash? We can’t say, but the Russell 2000 was up today and Market Internals were good too.


Advancing issues outpaced decliners and almost 60% of the volume on the NYSE was advancing volume. New-lows improved a little compared to Wednesday and was about one-third of the new-lows at the low a week ago.  


This all suggests the markets are closer to a bottom and I think there is still a rally in the works.


Today, the daily sum of 20 Indicators dropped improved from -3 to +2 (a positive number is bullish; negatives are bearish); the 10-day smoothed sum that smooths the daily fluctuations declined improved from +19 to +21. (The trend direction is more important than the actual number for the 10-day value.) These numbers sometimes change after I post the blog based on data that comes in late. Most of these 20 indicators are short-term so they tend to bounce around a lot.


LONG-TERM INDICATOR: The Long Term NTSM indicator was HOLD: VOLUME and VIX are bearish; PRICE is hold; SENTIMENT is bullish.  43 days out of the last 100 have been up-days; that leans bullish. This indicator is nearly “sell”, but I don’t think this is the time to sell.


I am cautiously Bullish in the short-term and Bearish longer-term. I expect a rally in the 7-9% range, before the markets return to selling. Am I right? We’ll see. It looked like the markets were ready to rebound today, before they sold off late. Tomorrow may be telling.


BEST ETFs - MOMENTUM ANALYSIS:

TODAY’S RANKING OF 15 ETFs (Ranked Daily)

The top ranked ETF receives 100%. The rest are then ranked based on their momentum relative to the leading ETF.

*For additional background on the ETF ranking system see NTSM Page at…

http://navigatethestockmarket.blogspot.com/p/exchange-traded-funds-etf-ranking.html


BEST DOW STOCKS - TODAY’S MOMENTUM RANKING OF THE DOW 30 STOCKS (Ranked Daily)

Here’s the revised DOW 30 and its momentum analysis. The top ranked stock receives 100%. The rest are then ranked based on their momentum relative to the leading stock.

For more details, see NTSM Page at…

https://navigatethestockmarket.blogspot.com/p/a-system-for-trading-dow-30-stocks-my_8.html


THURSDAY MARKET INTERNALS (NYSE DATA)

My basket of Market Internals improved to HOLD.


Market Internals are a decent trend-following analysis of current market action, but should not be used alone for short term trading. They are usually right, but they are often late.  They are most useful when they diverge from the Index. 


My stock-allocation in the portfolio is now roughly 45% invested in stocks, but some percentage includes trading-positions. This is slightly below my “normal” fully invested stock-allocation of 50%.


I trade about 15-20% of the total portfolio using the momentum-based analysis I provide here. If I can see a definitive bottom, I’ll add a lot more stocks to the portfolio using an S&P 500 ETF.


You may wish to have a higher or lower % invested in stocks depending on your risk tolerance. 50% is a conservative position that I consider fully invested for most retirees.


As a general rule, some suggest that the % of portfolio invested in the stock market should be one’s age subtracted from 100.  So, a 30-year-old person would have 70% of the portfolio in stocks, stock mutual funds and/or stock ETFs.  That’s ok, but for older investors, I usually don’t recommend keeping less than 50% invested in stocks (as a fully invested position) since most people need some growth in the portfolio to keep up with inflation.