Friday, June 29, 2018

Personal Spending … PCE Prices … Chicago PMI … Consumer Sentiment … Stock Market Analysis… ETF Trading … Dow 30 Ranking

SPENDING (CNBC/Reuters)
“U.S. consumer spending increased more than expected in April. The data were a further sign that economic growth was regaining momentum early in the second quarter, while inflation continued to rise steadily.” Story at…

PCE PRICES (Reuters)
“U.S. consumer prices accelerated in the year to May, with a measure of underlying inflation hitting the Federal Reserve’s 2 percent target for the first time in six years.” Story at…
 
CHICAGO PMI (fxStreet)
“The MNI Chicago Business Barometer rose 1.4 points to 64.1 in June, up from 62.7 in May, hitting the highest level since January…” Story at…
 
CONSUMER SENTIMENT (Bloomberg)
“Consumer sentiment weakened in the latter part of June on concerns about the economic impact of a trade war, according to a University of Michigan survey on Friday that also showed a pickup in inflation expectations.” Story at…
 
MARKET REPORT / ANALYSIS         
-Friday the S&P 500 was up about 0.6% to 2716.
-VIX dipped about 5% to 16.09. 
-The yield on the 10-year Treasury rose to 2.860%.
 
What an ugly close today. The S&P 500 index dropped nearly 1% in the last hour or so and the closing Tick (sum of last trades of the day) was high at -420.
 
There was a silver lining in the data though. The 10-day closing Tick was minus 23.  Minus numbers are where bottoms are made since it really is indicative of too many bad days. As is often the case in stock market analysis, too much of a bad thing can be good.  In this case, 10-day, closing-tick in minus territory is somewhat bullish, especially given some of the other indicators.
 
My daily sum of 17 Indicators improved from -7 to -3, while the 10-day smoothed version dropped from -57 to -58. The 10-day version continues to slow its decline. The indicators are neutral at this point.
 
The Bollinger Band indicator was very close to oversold and RSI (14-d,SMA) was 30 and that is oversold. Combine those oversold signals with the Advance/Decline ratio that was oversold a few days ago and we have a decent bullish set-up.
 
The % of stocks advancing is improving faster than the S&P 500 and that’s a bullish sign too.
 
The charts need to confirm these bullish signs, but so far they haven’t, at least not convincingly. The S&P 500 remains at the 50-dMA today so we’ll have to wait longer to see where the market is headed. Indicators are beginning to suggest up, but the signal is not very strong – we’d like to have more confirmation. 
 
My longer-term indicator system remained neutral. I remain cautiously bullish.
 
MOMENTUM ANALYSIS:  
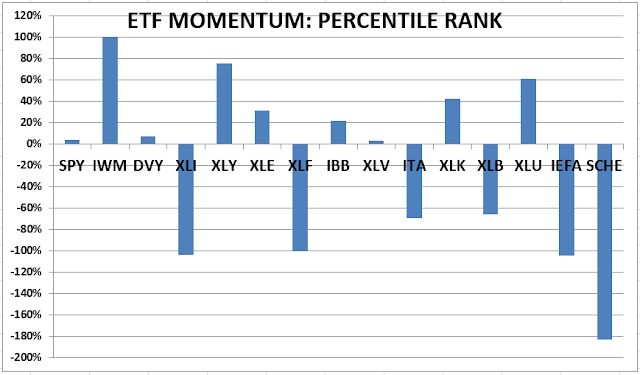
TODAY’S RANKING OF  15 ETFs (Ranked Daily)
The top ranked ETF receives 100%. The rest are then ranked based on their momentum relative to the leading ETF.  While momentum isn’t stock performance per se, momentum is closely related to stock performance. For example, over the 4-months from Oct thru mid-February 2016, the number 1 ranked Financials (XLF) outperformed the S&P 500 by nearly 20%. In 2017 Technology (XLK) was ranked in the top 3 Momentum Plays for 52% of all trading days in 2017 (if I counted correctly.) XLK was up 35% on the year while the S&P 500 was up 18%.
*For additional background on the ETF ranking system see NTSM Page at…
 
TODAY’S RANKING OF THE DOW 30 STOCKS (Ranked Daily)
The top ranked stock receives 100%. The rest are then ranked based on their momentum relative to the leading stock. (On 5 Apr 2018 I corrected a coding/graphing error that had consistently shown Nike incorrectly.)
*I rank the Dow 30 similarly to the ETF ranking system. For more details, see NTSM Page at…
 
I still have GE in my DOW 30 chart.  I’ll have to update my calculations to delete GE and add Walgreens Boots Alliance (WBA) since it has replaced GE in the DOW 30. WBA is best known for operating Walgreens drug stores.
 
FRIDAY MARKET INTERNALS (NYSE DATA)
Market Internals remained Neutral on the market.
Market Internals are a decent trend-following analysis of current market action but should not be used alone for short term trading. They are usually right, but they are often late.  They are most useful when they diverge from the Index.  In 2014, using these internals alone would have made a 9% return vs. 13% for the S&P 500 (in on Positive, out on Negative – no shorting). 
 

18 Apr 2018 I increased stock investments from 35% to 50% based on the Intermediate/Long-Term Indicator that turned positive on the 17th. (It has since turned Neutral.) For me, fully invested is a balanced 50% stock portfolio. 50% is my minimum unless I am in full defense mode.
 
On 10 May 2018 I added stock positions to increase Stock investments to 58% based on more evidence that the correction is over. This is high for me given that we are late in this cycle (and as a retiree), but it indicates my bullishness after the correction. I’ll sell these new positions quickly if the market turns down.
 
INTERMEDIATE / LONG-TERM INDICATOR
Intermediate/Long-Term Indicator: Friday, the VIX, Price, Sentiment & Volume indicators were neutral. Overall this is a NEUTRAL indication.

Thursday, June 28, 2018

GDP – 3rd Estimate … Jobless Claims … Stock Market Analysis… ETF Trading … Dow 30 Ranking

GDP (Bloomberg)
“The U.S. economy expanded in the first quarter at a slower pace than previously estimated, reflecting downward revisions to spending on services and to inventory investment, according to Commerce Department data released Thursday…. Gross domestic product increased at a 2% annualized rate (est. 2.2%), revised from previous est. of 2.2%.” Story at…
 
JOBLESS CLAIMS (Marketwatch)
“Initial jobless claims climbed by 9,000 to 227,000 in the week ended June 23.
That exceeded the 220,000 estimate of economists polled by MarketWatch, but claims are still near the lowest level in half a century.” Story at…
 
MARKET REPORT / ANALYSIS         
-Thursday the S&P 500 was up about 0.6% to 2716.
-VIX dipped about 6% to 16.85. 
-The yield on the 10-year Treasury rose to 2.84%.
 
My daily sum of 17 Indicators slipped from -5 to -7, while the 10-day smoothed version dropped from -51 to -57. The good news is that the 10-day version has slowed its decline. A number below zero shows most indicators are bearish.
 
I won’t go thru the indicators, but here are a few key ones:
The Bollinger Band indicator and RSI (14-d,SMA) were both very close to oversold, a bullish sign.
 
The % of stocks advancing is improving faster than the S&P 500 and that’s a bullish sign.
 
The S&P 500 closed on the 50-dMA today so we’ll have to wait longer to see where the market is headed. I’m guessing up, but I have been an optimist lately and only time will tell if I am right. We still have a lot of negative indicators.  
 
My longer-term indicator system remained neutral. I remain cautiously bullish.
 
MOMENTUM ANALYSIS:  
TODAY’S RANKING OF  15 ETFs (Ranked Daily)
The top ranked ETF receives 100%. The rest are then ranked based on their momentum relative to the leading ETF.  While momentum isn’t stock performance per se, momentum is closely related to stock performance. For example, over the 4-months from Oct thru mid-February 2016, the number 1 ranked Financials (XLF) outperformed the S&P 500 by nearly 20%. In 2017 Technology (XLK) was ranked in the top 3 Momentum Plays for 52% of all trading days in 2017 (if I counted correctly.) XLK was up 35% on the year while the S&P 500 was up 18%.
*For additional background on the ETF ranking system see NTSM Page at…
 
TODAY’S RANKING OF THE DOW 30 STOCKS (Ranked Daily)
The top ranked stock receives 100%. The rest are then ranked based on their momentum relative to the leading stock. (On 5 Apr 2018 I corrected a coding/graphing error that had consistently shown Nike incorrectly.)
*I rank the Dow 30 similarly to the ETF ranking system. For more details, see NTSM Page at…
 
I still have GE in my DOW 30 chart.  I’ll have to update my calculations to delete GE and add Walgreens Boots Alliance (WBA) since it has replaced GE in the DOW 30. WBA is best known for operating Walgreens drug stores.
 
THURSDAY MARKET INTERNALS (NYSE DATA)
Market Internals improved to Neutral on the market.
Market Internals are a decent trend-following analysis of current market action but should not be used alone for short term trading. They are usually right, but they are often late.  They are most useful when they diverge from the Index.  In 2014, using these internals alone would have made a 9% return vs. 13% for the S&P 500 (in on Positive, out on Negative – no shorting). 
 
18 Apr 2018 I increased stock investments from 35% to 50% based on the Intermediate/Long-Term Indicator that turned positive on the 17th. (It has since turned Neutral.) For me, fully invested is a balanced 50% stock portfolio. 50% is my minimum unless I am in full defense mode.
 
On 10 May 2018 I added stock positions to increase Stock investments to 58% based on more evidence that the correction is over. This is high for me given that we are late in this cycle (and as a retiree), but it indicates my bullishness after the correction. I’ll sell these new positions quickly if the market turns down.
 
INTERMEDIATE / LONG-TERM INDICATOR
Intermediate/Long-Term Indicator: Thursday, the VIX, Price, Sentiment & Volume indicators were neutral. Overall this is a NEUTRAL indication.

Wednesday, June 27, 2018

Durable Goods Orders … Home Sales … Crude Inventories … Stock Market Analysis… ETF Trading … Dow 30 Ranking

DURABLE ORDERS (Seattle Times)
“Orders for long-lasting U.S. factory goods declined for the second straight month in May, as demand for cars, metal products and aircraft fell. The Commerce Department said Wednesday durable goods orders — items meant to last at least three years, from washing machines to tractors — dropped 0.6 percent last month.” Story at…
 
PENDING HOME SALES (Reuters)
“Contracts to buy previously owned homes unexpectedly declined for the second straight month in May, mostly due to a shortage of properties for sale.” Story at…
 
CRUDE INVENTORIES (OIlPrice.com)
“A day after the American Petroleum Institute helped push crude prices even higher by estimating a 9.228-million-barrel draw in U.S. crude oil inventories, the EIA confirmed the draw, at 9.9 million barrels for the week to June 22.” Story at…
 
MONDAY MARKET COMMENTARY (Raymond James)
“According to the astute Lowry Research organization:
Since testing its March 9th high, the S&P 500 has continued to pull back modestly. The recent May high, around 2,730, offers the best nearby support on continued weakness with 2,700 as further support. This would be viewed as a buying opportunity in the context of the healthy Supply/Demand and breadth environment.” – Jeffrey Saut. Commentary at…
My cmt: we got to 2700 today – let’s hope Raymond James is right.
 
MARKET REPORT / ANALYSIS         
-Wednesday the S&P 500 was down about 0.9% to 2700.
-VIX rose about 13% to 17.91. 
-The yield on the 10-year Treasury slipped to 2.827%.
 
My daily sum of 17 Indicators improved from -7 to -5, while the 10-day smoothed version dropped from -49 to -51. The good news is that the 10-day version slowed its decline a lot. A number below zero shows most indicators are bearish.
 
My Money Trend indicator remains headed down and that’s bearish.
 
The Bollinger Band indicator was oversold today; RSI (14-d,SMA) slipped to 26 that’s oversold too.
 
Breadth, measured as the % of stocks on the NYSE that advanced over the last 10-days, slipped to 43.1%. Breadth vs. the S&P 500 is actually bullish. The S&P 500 is declining faster than the % of stocks advancing and that’s a bullish sign because it limits the likely fall in the Index and suggests a turn-around may not be too far off.
 
As previously noted, the spread between the Cyclical Industrials (XLI-ETF) and the S&P 500 has narrowed over the last few sessions and the spread continues to narrow and that’s a bullish sign.  (When investors are worried they sell cyclicals.) XLI is still underperforming the S&P 500 on every time frame I track, but it is improving (relative to the S&P 500) and that’s bullish. If it reverses down again I will get concerned.
 
The chart is now giving a warning sign. The S&P 500 dropped below the 50-dMA today and that also breaks the lower trend line. Two closes below the trend line is a warning and may indicate a trend break.  The book says it does, but with Bollinger Bands and RSI indicating oversold it seems likely that the drop may be limited. It is hard to say though, the Trump effect from all the tariff talk seems to be worrying the market; news always trumps technicals (no pun intended) and markets can remain oversold for extended periods.  
 
The Smart Money (late day action) is dropping, but not very sharply. It’s bearish. But not by much.
 
My longer-term indicator system remained neutral. I remain cautiously bullish. We’ll see – there’s no way to be too confident now and I am waiting to see what the Index does.
 
MOMENTUM ANALYSIS:  
TODAY’S RANKING OF  15 ETFs (Ranked Daily)
The top ranked ETF receives 100%. The rest are then ranked based on their momentum relative to the leading ETF.  While momentum isn’t stock performance per se, momentum is closely related to stock performance. For example, over the 4-months from Oct thru mid-February 2016, the number 1 ranked Financials (XLF) outperformed the S&P 500 by nearly 20%. In 2017 Technology (XLK) was ranked in the top 3 Momentum Plays for 52% of all trading days in 2017 (if I counted correctly.) XLK was up 35% on the year while the S&P 500 was up 18%.
*For additional background on the ETF ranking system see NTSM Page at…
 
TODAY’S RANKING OF THE DOW 30 STOCKS (Ranked Daily)

The top ranked stock receives 100%. The rest are then ranked based on their momentum relative to the leading stock. (On 5 Apr 2018 I corrected a coding/graphing error that had consistently shown Nike incorrectly.)
*I rank the Dow 30 similarly to the ETF ranking system. For more details, see NTSM Page at…
 
I still have GE in my DOW 30 chart.  I’ll have to update my calculations to delete GE and add Walgreens Boots Alliance (WBA) since it has replaced GE in the DOW 30. WBA is best known for operating Walgreens drug stores.
 
WEDNESDAY MARKET INTERNALS (NYSE DATA)
Market Internals declined to Negative on the market.
Market Internals are a decent trend-following analysis of current market action but should not be used alone for short term trading. They are usually right, but they are often late.  They are most useful when they diverge from the Index.  In 2014, using these internals alone would have made a 9% return vs. 13% for the S&P 500 (in on Positive, out on Negative – no shorting). 
 
18 Apr 2018 I increased stock investments from 35% to 50% based on the Intermediate/Long-Term Indicator that turned positive on the 17th. (It has since turned Neutral.) For me, fully invested is a balanced 50% stock portfolio. 50% is my minimum unless I am in full defense mode.
 
On 10 May 2018 I added stock positions to increase Stock investments to 58% based on more evidence that the correction is over. This is high for me given that we are late in this cycle (and as a retiree), but it indicates my bullishness after the correction. I’ll sell these new positions quickly if the market turns down.
 
INTERMEDIATE / LONG-TERM INDICATOR
Intermediate/Long-Term Indicator: Wednesday, the VIX, Price, Sentiment & Volume indicators were neutral. Overall this is a NEUTRAL indication.

Tuesday, June 26, 2018

Consumer Confidence … Chicago FED National Activity Index … Stock Market Analysis… ETF Trading … Dow 30 Ranking

CONSUMER CONFIDENCE (Conference Board)
“The Conference Board Consumer Confidence Index® decreased in June, following an increase in May. The Index now stands at 126.4 (1985=100), down from 128.8 in May…’Consumer confidence declined in June after improving in May,’ said Lynn Franco, Director of Economic Indicators at The Conference Board. ‘Consumers’ assessment of present-day conditions was relatively unchanged, suggesting that the level of economic growth remains strong. While expectations remain high by historical standards, the modest curtailment in optimism suggests that consumers do not foresee the economy gaining much momentum in the months ahead.’” Press release at…
 
CHICAGO FED NATIONAL ACTIVITY INDEX (Nasdaq.com)
“The Chicago Fed's National Activity Index (CFNAI) for May delivered a surprise for markets [Monday], dropping by a sharp 0.57 index points. The series declined from +0.42 in the previous month to -0.15 in May and subsequently brought its three-month moving average from +0.43 to +0.18. While forecasts suggested that growth in May could slow compared to that of April, the real figure released is a large deviation from consensus forecasts. Still, the index remains above contractionary levels, considered anything below -0.35.” Story at…
 
MARKET REPORT / ANALYSIS         
-Tuesday the S&P 500 was up about 0.2% to 2723.
-VIX dropped about 8% to 15.92. 
-The yield on the 10-year Treasury rose slightly to 2.886%.
 
My daily sum of 17 Indicators improved from -10 to -7, while the 10-day smoothed version dropped from -34 to -49. A number below zero shows most indicators are bearish.
 
My Money Trend indicator is headed down and that’s bearish.
 
The Bollinger Band indicator was almost in overbought territory today; RSI (14-d,SMA) slipped to 31 and 30 is the oversold limit. Perhaps we can say that’s close enough to be a bullish sign. It should give traders reason to buy.
 
Breadth, measured as the % of stocks on the NYSE that advanced over the last 10-days, fell to 43.6% and it cleared the “oversold” indication on the overbought/oversold ratio. With RSI and Bollinger Bands nearly confirming yesterday’s oversold indication in the overbought/oversold ratio we can be a bit more bullish.
 
The advancing volume picked up when measured on  10-day basis and that’s a good sign.
 
The spread between the Cyclical Industrials (XLI-ETF) and the S&P 500 has narrowed over the last few sessions and the spread continues to narrow and that’s a bullish sign.  (When investors are worried they sell cyclicals.) XLI is still underperforming the S&P 500 on every time frame I track, but it is improving (relative to the S&P 500) and that’s bullish. If it reverses down again I will get concerned.
 
The chart still looks ok. The S&P 500 dropped to the 50-dMA yesterday, as we suggested it might do last week, and bounced up from there. Let’s hope it continues up; I think a significant break of the trend line/50-dMA would be a bad sign.
 
Overall, I think we can feel a little more bullish today. My longer-term indicator system remained neutral. I remain cautiously bullish.
 
MOMENTUM ANALYSIS:  
TODAY’S RANKING OF  15 ETFs (Ranked Daily)
The top ranked ETF receives 100%. The rest are then ranked based on their momentum relative to the leading ETF.  While momentum isn’t stock performance per se, momentum is closely related to stock performance. For example, over the 4-months from Oct thru mid-February 2016, the number 1 ranked Financials (XLF) outperformed the S&P 500 by nearly 20%. In 2017 Technology (XLK) was ranked in the top 3 Momentum Plays for 52% of all trading days in 2017 (if I counted correctly.) XLK was up 35% on the year while the S&P 500 was up 18%.
*For additional background on the ETF ranking system see NTSM Page at…
 
TODAY’S RANKING OF THE DOW 30 STOCKS (Ranked Daily)
The top ranked stock receives 100%. The rest are then ranked based on their momentum relative to the leading stock. (On 5 Apr 2018 I corrected a coding/graphing error that had consistently shown Nike incorrectly.)
*I rank the Dow 30 similarly to the ETF ranking system. For more details, see NTSM Page at…
 
I still have GE in my DOW 30 chart.  I’ll have to update my calculations to delete GE and add Walgreens Boots Alliance (WBA) since it has replaced GE in the DOW 30. WBA is best known for operating Walgreens drug stores.
 
TUESDAY MARKET INTERNALS (NYSE DATA)
Market Internals improved to Neutral on the market.
Market Internals are a decent trend-following analysis of current market action but should not be used alone for short term trading. They are usually right, but they are often late.  They are most useful when they diverge from the Index.  In 2014, using these internals alone would have made a 9% return vs. 13% for the S&P 500 (in on Positive, out on Negative – no shorting). 
 
 
18 Apr 2018 I increased stock investments from 35% to 50% based on the Intermediate/Long-Term Indicator that turned positive on the 17th. (It has since turned Neutral.) For me, fully invested is a balanced 50% stock portfolio. 50% is my minimum unless I am in full defense mode.
 
On 10 May 2018 I added stock positions to increase Stock investments to 58% based on more evidence that the correction is over. This is high for me given that we are late in this cycle (and as a retiree), but it indicates my bullishness after the correction. I’ll sell these new positions quickly if the market turns down.
 
INTERMEDIATE / LONG-TERM INDICATOR
Intermediate/Long-Term Indicator: Tuesday, the VIX, Price, Sentiment & Volume indicators were neutral. Overall this is a NEUTRAL indication.

Monday, June 25, 2018

New Home Sales … Buffet Valuation Indicator … Stock Market Analysis… ETF Trading … Dow 30 Ranking

HOME SALES (Reuters)
“Sales of new U.S. single-family homes increased more than expected in May as transactions in the South surged to near an 11-year high and dampened prices, but the overall housing market remained constrained by a dearth of properties for sale.” Story at…
 
THE BUFFET VALUATION INDICATOR (Advisor Perspectives)
 

“…both the "Buffett Index" and the Wilshire 5000 variant suggest that today's market remains at lofty valuations — similar to the housing-bubble peak in 2007, although off its interim high in Q1 of 2015… While this indicator is a general gauge of market valuation, it's not useful for short-term market timing...” – Jill Mislinsky. Additional charts and commentary at…
 
MARKET REPORT / ANALYSIS         
-Monday the S&P 500 was down about 1.4% to 2717.
-VIX jumped about 26% to 17.34. 
-The yield on the 10-year Treasury slipped to 2.876%.
 
My daily sum of 17 Indicators dropped from -6 to -10, while the 10-day smoothed version dropped from -18 to -34. A number below zero shows most indicators are bearish.
 
My Money Trend indicator is bearish.
 
The Bollinger Band indicator dropped almost into overbought territory; RSI (14-d,SMA) dropped a lot too, but remained giving a neutral signal and is now 39.
 
Breadth, measured as the % of stocks on the NYSE that advanced over the last 10-days, fell to 42.5% and that is an “oversold” indication on the overbought/oversold ratio. (More stocks have been going down over the last 2-weeks than have been going up.) The oversold reading is bullish, but this indicator can be very early. Until it is confirmed by Bollinger Bands and RSI it is too early to act.
 
The spread between the Cyclical Industrials (XLI-ETF) and the S&P 500 has narrowed over the last few sessions and that’s a good sign.  (When investors are worried they sell cyclicals.) XLI is underperforming the S&P 500 on every time frame I track, but it may be changing direction and that would be bullish.
 
The S&P 500 dropped to the lower trend line. It was on a big day (statistically-significant in my system) and that often indicates a turn-around point. About 60% of the time we’d expect an up-day Tuesday. 
 
The chart still looks ok. The S&P 500 dropped to the 50-dMA as we suggested it might do last week. That’s OK, but further declines from here would break the lower trend line and would be a bearish sign.
 
Let’s see what happens tomorrow.
 
My longer-term indicator system remained neutral. I remain cautiously bullish.
 
MOMENTUM ANALYSIS:  
TODAY’S RANKING OF  15 ETFs (Ranked Daily)
The top ranked ETF receives 100%. The rest are then ranked based on their momentum relative to the leading ETF.  While momentum isn’t stock performance per se, momentum is closely related to stock performance. For example, over the 4-months from Oct thru mid-February 2016, the number 1 ranked Financials (XLF) outperformed the S&P 500 by nearly 20%. In 2017 Technology (XLK) was ranked in the top 3 Momentum Plays for 52% of all trading days in 2017 (if I counted correctly.) XLK was up 35% on the year while the S&P 500 was up 18%.
*For additional background on the ETF ranking system see NTSM Page at…
 
TODAY’S RANKING OF THE DOW 30 STOCKS (Ranked Daily)
The top ranked stock receives 100%. The rest are then ranked based on their momentum relative to the leading stock. (On 5 Apr 2018 I corrected a coding/graphing error that had consistently shown Nike incorrectly.)
*I rank the Dow 30 similarly to the ETF ranking system. For more details, see NTSM Page at…
 
We may be back in correction mode; momentum is a bad way to evaluate stocks in a correction. I am not saying we are in a correction, but it’s possible.
 
MONDAY MARKET INTERNALS (NYSE DATA)
Market Internals remained Negative on the market.
Market Internals are a decent trend-following analysis of current market action but should not be used alone for short term trading. They are usually right, but they are often late.  They are most useful when they diverge from the Index.  In 2014, using these internals alone would have made a 9% return vs. 13% for the S&P 500 (in on Positive, out on Negative – no shorting). 
 
 
18 Apr 2018 I increased stock investments from 35% to 50% based on the Intermediate/Long-Term Indicator that turned positive on the 17th. (It has since turned Neutral.) For me, fully invested is a balanced 50% stock portfolio. 50% is my minimum unless I am in full defense mode.
 
On 10 May 2018 I added stock positions to increase Stock investments to 58% based on more evidence that the correction is over. This is high for me given that we are late in this cycle (and as a retiree), but it indicates my bullishness after the correction. I’ll sell these new positions quickly if the market turns down.
 
INTERMEDIATE / LONG-TERM INDICATOR
Intermediate/Long-Term Indicator: Monday, the VIX indicator turned negative; Price, Sentiment & Volume indicators were neutral. Overall this is a NEUTRAL indication.