BEJING DEFIANT (CNBC)
“The United States and China appeared at a deadlock over
trade negotiations on Sunday as Washington demanded
promises of concrete changes to Chinese law and Beijing said it would not swallow any
“bitter fruit” that harmed its interests…the sticking point was Beijing’s
reluctance to put into law changes that had been agreed upon.” Story at…
My cmt: Apparently, the Chinese are willing to agree to
US copyright issues and technology exchange, but not to change their laws to
actually enforce them. This doesn’t seem like it will be easily resolved,
especially if they consider this “bitter fruit.”
STOCKS ARE VERY EXPENSIVE (Financial Sense)
“Stocks are very expensive in relation to corporate
earnings. Even if rapid economic and profits growth resumes after the next
recession, a secular decline in price-to-earnings ratios is likely to mute
stock performance. Prof. Robert Shiller’s cyclically-adjusted stock
price-to-earnings ratio, based on real earnings over the preceding 10 years to
iron out cyclical fluctuations, is now 46% above its long-term average of 16.9.
So it would take a considerable drop in stock prices and/or unrealistic growth
in corporate earnings to bring it back to its long-term norm.” Commentary at…
DON’T FEAR A 10% CORRECTION (CNBC)
“As long as lenders continue to want to extend credit and
spreads are low and lending is still reasonable, then I see no reason why we
couldn’t just get away with say a 10% correction or something – certainly less
than the bottom that we saw back at Christmas time,” the firm’s chief
investment officer said Thursday on CNBC’s “Futures Now. ” Commentary
at…
STOCK MARKET LOOKS LIKE LATE 2018 (MarketWatch)
“In the simplest terms, as long as the market remains
below 2,925 this week, the bears can take charge of this market. All they need
to do is break below the low struck Friday, and that will provide a bearish
structure to the downside…While it still takes a sustained follow-through below
2,785 to start a waterfall decline, a lower low early this coming week may
simply complete wave one down off the recent market highs, followed by a wave 2
retracement. However, if the bulls can
take us back over 2,925, they open the door again to push us higher toward
3,000…” - Avi Gilburt, founder of ElliottWaveTrader.net. Commentary at…
CHANGES TO THE RETIREMENT PROGRAMS INCLUDING TSP (Federal
Employee and Service Member 401k Program) (FedWeek)
“The House tax-writing committee has advanced a bill that
among other things would provide relief from the “minimum distribution” requirement
applying to retirement savings programs such as the TSP…Under HR-1994, passed
by the Ways and Means Committee and now ready for a full House vote, the
triggering age would be raised to 72, for individuals who attain age 70 ½ in
calendar year 2020 and after.” Story at…
My cmt: With similar bills floated in the House and
Senate it is likely that these bills will become law.
MARKET REPORT / ANALYSIS
-Monday the S&P 500 dropped about 2.4% to 2813.
-VIX jumped about 28% to 20.55.
-The yield on the 10-year Treasury dipped to 2.410%.
I saw a comment by a trader Friday who wrote that the Bad
News is already out and the market held up Friday - he was bullish. Needless to say, his bullish-call was not a
good one and it just shows that it is difficult to make predictions, especially
about the future (numerous attributions: Danish Proverb, Yogi Berra, Neils Bohr
and others). Trade news was bad Friday and it only got worse over the weekend. The
article I linked above, “Beijing Defiant,” pretty much says it all.
The Panic Indicator flashed sell again! I had to go back to April and May of 2010 to
find the last time this indicator flashed sell twice in the same correction
near a top. In that correction, the
S&P 500 dropped 16%. I suspect that it
probably flashed sell multiple times during the big crashes of 2001, 2007, etc.
It can also signal a bottom, because it identifies extremes. Today is not likely to be a bottom.
We crashed the 50-dMA and are now headed for the 200-dMA
at 2775.
Only 9% of volume was advancing. That’s bearish, but today
didn’t meet all of the Lowry Research tests for a high-volume, down-day. If it
had, it would have been a much more bearish sign.
My daily sum of 20 Indicators dropped from -4 to -9 (a
positive number is bullish; negatives are bearish) while the 10-day smoothed
version that negates the daily fluctuations dropped from -13 to -22. (These numbers
sometimes change after I post the blog based on data that comes in late.) Most
of these indicators are short-term. This is a bearish indication.
The 5-10-20 Timer system remains a sell signal today This
simply means that the 5-dEMA and the 10-dEMA have dropped below the 20-dEMA.
This is a decent indicator all by itself.
Two bottom indicators were activated today. Both RSI and
Bollinger Bands signaled oversold. It is not unusual for these indicators to
flash oversold early in a correction. They were both oversold 3-weeks into the Oct-Dec
2018 correction. That correction continued for another 6-weeks before it
ended. We’ll need to see more positive
indicators before we get bullish on this market. My main indicator though, will be to watch
for a retest of the low. We need for the market to make a low; improve and then
successfully retest the prior low.
So far, it does not appear that we have made a bottom. We
need to be careful with bottom indicators.
In small corrections of less than say 7%, indicators may not give a buy
signal that is strong enough to move with any confidence. We can have other
problems, too.
The recent 20% correction (fall of 2018) was a real
pain. We had a rare false buy-signal
about half way down that was followed by a bottom that was never retested. That’s
a first for “modern” corrections, courtesy of the Fed Flop.
The S&P 500 is now 4.5% below its all-time high. I
think we are headed lower, but perhaps not tomorrow. Today was today
was a statistically significant down-day. That just means that the price-volume
move exceeded my statistical parameters. Statistics show that a statistically
significant down-day is followed by an up-day about 60% of the time. There was
some limited late-day buying that reinforces a possible up-day tomorrow. Briefing.com
no longer reports closing Tick and I can’t get that data until later. It would
be nice to know if there was buying at the close.
I still have a very low % invested in stocks and I’m
looking for a buying point. I am going to wait for indicators to get bullish
before I move.
Since the long-term indicator is now negative/SELL. I
would cut back stock holdings tomorrow if I weren’t already conservatively
positioned.
TOP / BOTTOM INDICATOR SCALE OF 1 TO 10
Today’s Reading: +2
Most Recent Day with a value other than Zero: +2 on 13
May (RSI & Bollinger Bands were positive.)
(1) +10 Max Bullish / -10 Max Bearish)
(2) -4 or below is a Sell sign. +4 or better is a Buy
Sign.
NOTE: Topping
indicators are good at identifying a blow-off top with buyers in a frenzy. These indicators are not so good at
identifying a slow, rollover-top that can happen when buyers simply go on
strike.
MOMENTUM ANALYSIS:
TODAY’S RANKING OF
15 ETFs (Ranked Daily)
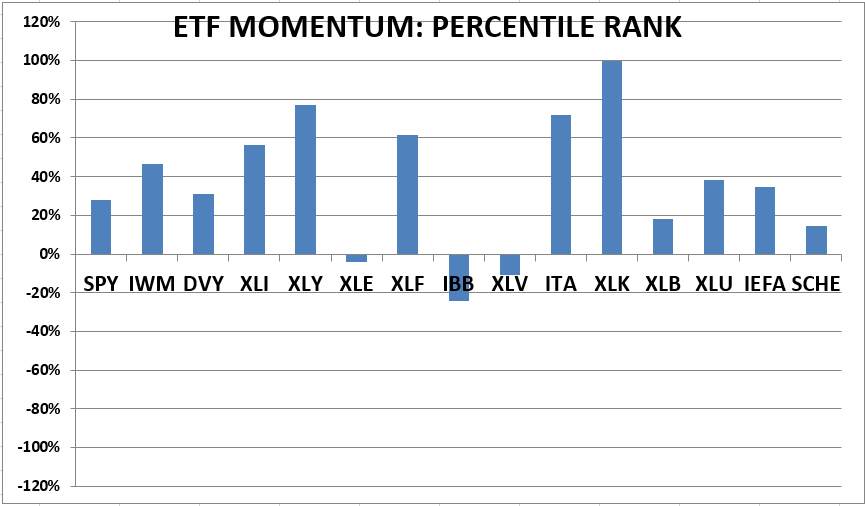
The top ranked ETF receives 100%. The rest are then
ranked based on their momentum relative to the leading ETF. While momentum isn’t stock performance per
se, momentum is closely related to stock performance. For example, over the
4-months from Oct thru mid-February 2016, the number 1 ranked Financials (XLF)
outperformed the S&P 500 by nearly 20%. In 2017 Technology (XLK) was ranked
in the top 3 Momentum Plays for 52% of all trading days in 2017 (if I counted
correctly.) XLK was up 35% on the year while the S&P 500 was up 18%.
*For additional background on the ETF ranking system see
NTSM Page at…
TODAY’S RANKING OF THE DOW 30 STOCKS (Ranked Daily)

*I rank the Dow 30 similarly to the ETF ranking system.
For more details, see NTSM Page at…
MONDAY MARKET INTERNALS (NYSE DATA)
Market Internals
remained NEGATIVE on the market at the close.
Market Internals are a decent trend-following analysis of
current market action but should not be used alone for short term trading. They
are usually right, but they are often late.
They are most useful when they diverge from the Index. In 2014, using these internals alone would
have made a 9% return vs. 13% for the S&P 500 (in on Positive, out on
Negative – no shorting).
I ran the numbers for 2018. Using the Short-term
indicator would have made a 5% gain instead of a 6% loss for buy-and-hold. The
methodology was Buy on a POSITIVE indication and Sell on a NEGATIVE indication
and stay out until the next POSITIVE indication. The back-test included 13-buys
and 13-sells, or a trade every 2-weeks on average.
My current stock allocation is about 30% invested in
stocks as of 9 January 2019. I sold the rally about half way up expecting a
retest of the lows Dec 2018.
INTERMEDIATE / LONG-TERM INDICATOR
Monday, the Panic Indicator, VIX and VOLUME indicators
were negative. PRICE and SENTIMENT indicators were neutral. (Sentiment was very
nearly a sell as of Friday.) Overall this is a BEARISH indication that is
now issuing a SELL signal.