“Trade what you see; not what you think.” – The Old Fool, Richard McCranie, trader extraordinaire.
“Biden's amnesty [mass amnesty for an estimated half million illegal aliens now married to U.S. citizens and who have lived in the U.S. for a decade or more] is blatantly, flagrantly, and offensively unconstitutional. [According to the Constitution] Only Congress, not the president, can "establish a uniform rule of naturalization." Prosecutorial discretion, which Biden (like Obama before him) laughably invokes, is only legitimate when applied on an individualized, case-by-case basis. Prosecutorial discretion does not apply to a blanket refusal to enforce large swaths of immigration law—an act which itself violates the president's Article II, Sec. 3 prerogative to "take care that the laws be faithfully executed." The president has plenary statutory authority under 8 U.S.C. Sec. 1201 to deport any alien (legal or illegal) at any time for any reason, but he does not have any reciprocal power to naturalize aliens outside of Congress.” Story at...
Joe Biden's Executive Amnesty Is Illegal, Unjust, and Self-Defeating | Opinion (msn.com)
My cmt: While the Democrats explicitly campaign on “restoring and strengthening our Democracy” (while implying Trump will destroy Democracy), Biden is again blatantly violating the Constitution, the very basis for our representative Democracy.
“I believe that Trump’s best choice is to pick somebody who can make voting for him more palatable. Moderates who dislike President Joe Biden but are turned off by the Trump persona could be a deciding force in the election. ...Haley, as the vice president pick, would give Trump the best path forward. A Trump-Haley ticket would represent an olive branch extended between the two factions of the GOP at war with each other. Trump’s populist base would certainly take issue with it, but his supporters won't let any VP choice stand in the way of their vote for him.” Opinion at...
Nikki Haley is the clear choice for Trump's VP pick. So I'm sure he'll go full MAGA. (msn.com)
My cmt: I couldn’t agree more, but Trump is too arrogant to think strategically, and further, he wants a MAGA “Yes Man.”
“-Existing-home sales slipped 0.7% in May to a seasonally adjusted annual rate of 4.11 million. Sales descended 2.8% from one year ago.
-The median existing-home sales price jumped 5.8% from May 2023 to $419,300 – the highest price ever recorded and the eleventh consecutive month of year-over-year price gains.
-The inventory of unsold existing homes grew 6.7% from the previous month to 1.28 million at the end of May, or the equivalent of 3.7 months' supply at the current monthly sales pace...
... Eventually, more inventory will help boost home sales and tame home price gains in the upcoming months," said NAR Chief Economist Lawrence Yun.” Press release at...
https://www.nar.realtor/newsroom/existing-home-sales-edged-lower-by-0-7-in-may-as-median-sales-price-reached-record-high-of-419300
-Friday the S&P 500 declined about 0.2% to 5465.
-VIX rose about 1% to 13.20.
-The yield on the 10-year Treasury declined to 4.257%.
UWM – Added 5/2/2024
QLD – Added 4/29/2024
XLK – Holding since the October 2022 lows.
“The Dow Jones U.S. Completion Total Stock Market Index, also known as the DWCPF, is a widely used financial index that provides a comprehensive measure of the US equity market. The DWCPF includes all US stocks that are not included in the Dow Jones US Total Stock Market Index, which comprises large-cap and mid-cap companies. As a result, the DWCPF provides a complete picture of the US stock market, including small-cap and micro-cap companies, which are often overlooked by other indexes.” From...
https://fi.money/blog/posts/what-is-dow-jones-u-s-completion-total-stock-market-index-dwcpf
The Bull/Bear Spread (Bull Indicators minus Bear Indicators) remained 13 Bear-signs and 11-Bull. (The rest are neutral. It is normal to have a lot of neutral indicators since many of those are top or bottom indicators that will signal only at extremes.) The 10-dMA of spread (purple line in the chart below) started falling Friday – that’s a concern.
TODAY’S COMMENT:
The S&P 500 is in the center of the channel when we draw channel lines back to October (black dashed lines in the above chart). However, the S&P 500 is at the top of the channel extending back to July (red dashed line above) so that could be a sign that a retreat is due. I don’t know which alternative carries more weight; I’ve never been much of a chart guy. Let’s just say caution is warranted.
(The Long-Term Indicator is not a good top-indicator. It can signal BUY at a top.)
Markets are stretched and breadth is looking weak. A 10% retreat is possible, although we don’t have a sell signal at this point. I will take profits in leveraged positions (QLD and UWM) Monday, since markets are looking weak. Let’s see what happens Monday.
TODAY’S RANKING OF 15 ETFs (Ranked Daily) ETF ranking follows:
*For additional background on the ETF ranking system see NTSM Page at…
http://navigatethestockmarket.blogspot.com/p/exchange-traded-funds-etf-ranking.html
For more details, see NTSM Page at…
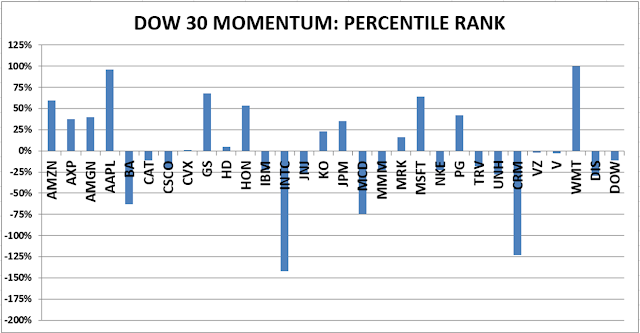
https://navigatethestockmarket.blogspot.com/p/a-system-for-trading-dow-30-stocks-my_8.html
My basket of Market Internals remained HOLD. (My basket of Market Internals is a decent trend-following analysis of current market action, but should not be used alone for short term trading. They are most useful when they diverge from the Index.)


