Thursday, February 10, 2022

Jobless Claims ... Consumer Price Index CPI … Coronavirus (Covid-19) … Stock Market Analysis … ETF Trading … Dow 30 Ranking

“Trade what you see; not what you think.” – The Old Fool, Richard McCranie, trader extraordinaire.


JOBLESS CLAIMS (YahooFinance)

“First-time unemployment filings came in lower in the latest weekly data, continuing a recent downward trend in jobless claims as Omicron-related pressures on the labor market begin to abate...Initial jobless claims, week ended Feb. 5: 223,000 vs. 230,000 expected; prior week of 238,000 upwardly revised to 239,000.” Story at...

https://finance.yahoo.com/news/jobless-claims-feb-5-2022-221602181.html


CPI (Reuters)

“U.S. consumer prices rose solidly in January, leading to the biggest annual increase in inflation in 40 years...The consumer price index gained 0.6% last month after a similar increase in December.” Story at...

https://www.reuters.com/business/us-consumer-prices-rise-strongly-january-weekly-jobless-claims-fall-2022-02-10/

My cmt: Inflation is high and this is about the same as last month.  Doesn’t look like a surprise to me.


MARKET REPORT / ANALYSIS

-Thursday the S&P 500 fell about 1.8% to 4504.

-VIX jumped about 20% to 23.91.

-The yield on the 10-year Treasury rose to 2.033%. (The markets didn’t like inflation; they didn’t like this number either.) 


Given that most corrections retest their prior lows, I’ll keep the pullback stats for a while.

Pullback Data:

Days since top: 27 (Avg= 30 days for corrections <10%; 60 days for larger, non-crash pullbacks)

Drop from Top: Now 6.1%; Max closing: 9.8%; Max intraday: 12% (Avg.= 13% for non-crash pullbacks)

The S&P 500 is 1.2% above its 200-dMA & 2.3% below its 50-dMA.

Max Retracement from bottom: 56% Wednesday.

The slope of the 200-dMA is up.


The S&P 500 made a double top at 4589 so I was watching the Russell 2000 to see if the Russell could hold above its prior high and give us a bullish sign.


The Russell 2000 had broken out of its range to continue an up-trend. Thursday, I didn’t want to see the Russel 2000 fall below its prior high of 2051. It closed at 2051. If it can’t stay above the 2051 level, it suggests that it may slide backwards and test lower levels, possibly the 27 January low.  That could pull other indices lower - not a good thought.


I thought we were out of the woods, but the inflation numbers spooked the markets and the S&P 500 futures fell immediately after the release.


I sold my QLD position in the morning when there was a clear head-and-shoulders pattern on a number of charts. With an ETF that doubles the market moves, its best to take a profit rather than hang on and risk a loss. I didn’t cut any other positions.  We were headed for a statistically significant day. As it turned out, today was a statistically significant down-day. That just means that the price-volume move exceeded my statistical parameters. Statistics show that a statistically-significant, down-day is followed by an up-day about 60% of the time so I may be better off selling tomorrow or hanging on if the indicators look OK.  The Friday run down may be telling.   


If tomorrow isn’t up, I’ll probably sell some more positions.


In spite of the nasty day, Indicators didn’t change much. The daily sum of 20 Indicators declined from +6 to +5 (a positive number is bullish; negatives are bearish); the 10-day smoothed sum that smooths the daily fluctuations improved from +32 to +43 (The trend direction is more important than the actual number for the 10-day value.) These numbers sometimes change after I post the blog based on data that comes in late. Most of these indicators are short-term so they tend to bounce around a lot.


The Long Term NTSM indicator ensemble remained to HOLD. Volume is bullish; VIX, Price & Sentiment are Neutral.


I’m neutral now – let’s see what happens tomorrow. I don’t think the inflation numbers should have affected the market as much as today's drop would indicate, but rather than guess what Mr. Market thinks, let’s follow the market tomorrow and see. 


POSITIONS ADDED:

Wednesday, 26 January: AAPL; XLE;

Monday, 31 January: QLD; SPY


POSITIONS SOLD: QLD 10 February.


MOMENTUM ANALYSIS:

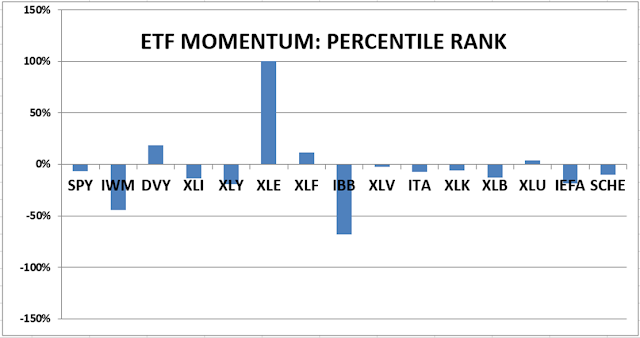
TODAY’S RANKING OF 15 ETFs (Ranked Daily)

The top ranked ETF receives 100%. The rest are then ranked based on their momentum relative to the leading

ETF.

*For additional background on the ETF ranking system see NTSM Page at…

http://navigatethestockmarket.blogspot.com/p/exchange-traded-funds-etf-ranking.html


TODAY’S RANKING OF THE DOW 30 STOCKS (Ranked Daily)

Here’s the revised DOW 30 and its momentum analysis. The top ranked stock receives 100%. The rest are then ranked based on their momentum relative to the leading stock.

For more details, see NTSM Page at…

https://navigatethestockmarket.blogspot.com/p/a-system-for-trading-dow-30-stocks-my_8.html


THURSDAY MARKET INTERNALS (NYSE DATA)

Market Internals remained Buy.


Market Internals are a decent trend-following analysis of current market action, but should not be used alone for short term trading. They are usually right, but they are often late.  They are most useful when they diverge from the Index. 


My stock-allocation in the portfolio is probably still about 65% invested in stocks. This is above my “normal” fully invested stock-allocation of 50%. I will hold this trading-position for a while, but it will not be a long-term hold.


I trade about 15-20% of the total portfolio using the momentum-based analysis I provide here. If I can see a definitive bottom, I’ll add a lot more stocks to the portfolio using an S&P 500 ETF.


You may wish to have a higher or lower % invested in stocks depending on your risk tolerance. 50% is a conservative position that I consider fully invested for most retirees.


As a general rule, some suggest that the % of portfolio invested in the stock market should be one’s age subtracted from 100.  So, a 30-year-old person would have 70% of the portfolio in stocks, stock mutual funds and/or stock ETFs.  That’s ok, but for older investors, I usually don’t recommend keeping less than 50% invested in stocks (as a fully invested position) since most people need some growth in the portfolio to keep up with inflation.


Wednesday, February 9, 2022

NFIB Small Business Optimism … Shipping Supply Chain Snarls Have Peaked ... Coronavirus (Covid-19) … Stock Market Analysis … ETF Trading … Dow 30 Ranking

“Trade what you see; not what you think.” – The Old Fool, Richard McCranie, trader extraordinaire.


NFIB SMALL BUSINESS OPTIMISM (Reuters)

“U.S. small business confidence fell to an 11-month low in January amid persistent worker shortages and higher prices for materials, a survey showed on Tuesday. The National Federation of Independent Business said its Small Business Optimism Index dropped 1.8 points to 97.1 last month...” Story at...

https://www.reuters.com/business/us-small-business-sentiment-drops-11-month-low-nfib-2022-02-08/


TOP SHIPPING EXEC SAYS WORST SUPPLY CHAIN SNARLS HAVE PEAKED (ZeroHedge)

“AP Moller-Maersk suggests the climax of global supply-chains snarls has passed, and bottlenecks will alleviate in the second half of the year. There are emerging signs major transpacific shipping freight rates are at a critical inflection point.  "We are guiding in an environment where we are coming out of a pandemic, and we don't have much experience with that to be honest," Chief Executive Officer Soren Skou.

https://www.zerohedge.com/commodities/worlds-top-shipping-exec-says-worst-supply-chain-snarls-have-peaked

My cmt:  This would be good news.  Any improvement in supply chains will be incredibly helpful. If Covid declines in China and they go back to full production, it would likely minimize the supply chain issue after backlogs are worked off. I think this would do a lot to cut inflation since inflation seems to be occurring due to supply shortage rather than demand excess. In that regard, I don’t see how a tightening of interest rates will help inflation. Normally inflation occurs due to an overheated economy. Not this time. I think the Fed does not have the tools to fight this battle, but I’m not an economist so what do I know?


A 50% DECLINE WOULD ONLY BE A CORRECTION (Real Investment Advice)

A 61.8% retracement would make it a “bear market” by breaking the bullish trend. When you realize that a 50-percent decline in prices would still maintain the “bullish trend” of the market, it just shows how exacerbated markets are due to a decade of monetary interventions... it is hard to comprehend that a 50% decline in the market wouldn’t technically qualify as a “bear market” as the bullish trend would remain intact. However, please don’t misconstrue what I am saying. A “mean reversion” will be devastating to the financial wealth of invested households... “Don’t stress, none of this will happen,” you say? Maybe? I certainly hope not. But are you willing to bet your retirement on it?” Commentary at...

https://realinvestmentadvice.com/a-50-decline-will-only-be-a-correction/

My cmt: We really need to be watching this year.  The odds of a down year are probably above 50%, because the last 3 years have been very strong and this is the second year in the Presidential cycle. The odds of a crash are high, too, but I won’t make a guess on that probability. Let’s just say the stars are aligned for a crash (>50% drop): Inflation is high; PEs are at extreme highs; the Fed is raising rates, ending QE and normalizing its balance sheet; and there are geopolitical concerns with Russia and China threatening aggression. Jeepers, just writing all that is scary! If the S&P 500 can get to new highs, I’ll be following the markets and indicators more closely than usual.


MARKET REPORT / ANALYSIS

-Wednesday the S&P 500 rose about 1.5% to 4587.

-VIX declined about 6% to 20.10.

-The yield on the 10-year Treasury slipped to 1.947%. 


Given that most corrections retest their prior lows, I’ll keep the pullback stats for a while.

Pullback Data:

Days since top: 26 (Avg= 30 days for corrections <10%; 60 days for larger, non-crash pullbacks)

Drop from Top: Now 4.4%; Max closing: 9.8%; Max intraday: 12% (Avg.= 13% for non-crash pullbacks)

The S&P 500 is 3.1% above its 200-dMA & 0.5% below its 50-dMA.

Max Retracement from bottom: 56% Wednesday.

The slope of the 200-dMA is up.


New-lows still outpaced new-highs today, but the spread between the two got a lot better. There were 91 new-highs today vs 148 new-lows. That’s encouraging and we can hope that the spread is positive Thursday. That would be a very bullish sign.


The S&P 500 traded up to its recent 2 February high of 4589 Wednesday, and closed a bit lower at 4587. 4589 is a resistance point, but there were bullish signs here.


The Russell 2000 climbed above its recent high of 2051 on 1 Feb to close at 2080 thus breaking out of the range from its 27 Jan low and the 1 Feb high.  That’s good. I expect that the S&P will follow thru too.  


Technically, the markets seem to be breaking higher.  FactSet earnings report from Friday showed that earnings are in-line for this quarter and Walt Disney was up nearly 10% after hours due to their strong earnings. With earnings and technicals both positive I am hopeful that markets will continue higher.


We may see new highs on the S&P 500 sooner than expected.  


The daily sum of 20 Indicators improved from +4 to +6 (a positive number is bullish; negatives are bearish); the 10-day smoothed sum that smooths the daily fluctuations improved from +18 to +32 (The trend direction is more important than the actual number for the 10-day value.) These numbers sometimes change after I post the blog based on data that comes in late. Most of these indicators are short-term so they tend to bounce around a lot.


The Long Term NTSM indicator ensemble remained to HOLD. Volume is bullish; VIX, Price & Sentiment are Neutral.


I remain cautiously bullish. 


POSITIONS ADDED:

Wednesday, 26 January: AAPL; XLE;

Monday, 31 January: QLD; SPY


MOMENTUM ANALYSIS:

TODAY’S RANKING OF 15 ETFs (Ranked Daily)

The top ranked ETF receives 100%. The rest are then ranked based on their momentum relative to the leading

ETF.

*For additional background on the ETF ranking system see NTSM Page at…

http://navigatethestockmarket.blogspot.com/p/exchange-traded-funds-etf-ranking.html


TODAY’S RANKING OF THE DOW 30 STOCKS (Ranked Daily)

Here’s the revised DOW 30 and its momentum analysis. The top ranked stock receives 100%. The rest are then ranked based on their momentum relative to the leading stock.

For more details, see NTSM Page at…

https://navigatethestockmarket.blogspot.com/p/a-system-for-trading-dow-30-stocks-my_8.html


WEDNESDAY MARKET INTERNALS (NYSE DATA)

Market Internals improved to Buy. We haven’t seen a Buy-signal on this indicator since 4 Jan.


Market Internals are a decent trend-following analysis of current market action, but should not be used alone for short term trading. They are usually right, but they are often late.  They are most useful when they diverge from the Index. 


My stock-allocation in the portfolio is about 65% invested in stocks. This is above my “normal” fully invested stock-allocation of 50%. I will hold this trading-position for a while, but it will not be a long-term hold.


I trade about 15-20% of the total portfolio using the momentum-based analysis I provide here. If I can see a definitive bottom, I’ll add a lot more stocks to the portfolio using an S&P 500 ETF.


You may wish to have a higher or lower % invested in stocks depending on your risk tolerance. 50% is a conservative position that I consider fully invested for most retirees.


As a general rule, some suggest that the % of portfolio invested in the stock market should be one’s age subtracted from 100.  So, a 30-year-old person would have 70% of the portfolio in stocks, stock mutual funds and/or stock ETFs.  That’s ok, but for older investors, I usually don’t recommend keeping less than 50% invested in stocks (as a fully invested position) since most people need some growth in the portfolio to keep up with inflation.

Tuesday, February 8, 2022

Kilmeade Calls Trump a Liar ... Buy the Dip in March – Not now … Coronavirus (Covid-19) … Stock Market Analysis … ETF Trading … Dow 30 Ranking

“Trade what you see; not what you think.” – The Old Fool, Richard McCranie, trader extraordinaire.


KILMEADE CALLS TRUMP A LIAR (msn.com)

"Right now, nobody cares about 2020. Nobody. And everything that he [Trump] said and the challenges that he made should've been done before the election. And they did a recount in Arizona, and the recount showed no difference almost, and he came out and said it showed that they won Arizona. That's an outright lie...” – Brian Kilmead, Fox Radio Host and political commentator. Story at...

Fox News' Brian Kilmeade Slams Trump Over 'Outright Lie' About 2020 Election (msn.com)

I happened to be listening Monday when Kilmeade made these comments.  No question, he called Trump a liar on a nationally syndicated right-leaning radio program.


BUY THE DIP IN MARCH, NOT NOW (msn.com)

“Investors should hold off on buying the current decline in stocks until after the Federal Reserve's first interest rate hike, according to a Monday note from Bank of America. The bank's technical analyst Stephen Suttmeier found that stocks have a tendency to sell off in the months immediately after the initial Fed rate hike before eventually moving higher...” Story at...

Investors should prepare to buy the dip in stocks after the Fed's first interest rate hike in March, BofA says (msn.com)

My cmt: Too late for me; I already bought the dip based on my indicators – hope I’m right.


MARKET REPORT / ANALYSIS

-Tuesday the S&P 500 rose about 0.8% to 4521.

-VIX declined about 6% to 21.44.

-The yield on the 10-year Treasury rose to 1.964%. 


Given that most corrections retest their prior lows, I’ll keep the pullback stats for a while.

Pullback Data:

Days since top: 25 (Avg= 30 days for corrections <10%; 60 days for larger, non-crash pullbacks)

Drop from Top: Now 5.7%; Max closing: 9.8%; Max intraday: 12% (Avg.= 13% for non-crash pullbacks)

The S&P 500 is 1.7% above its 200-dMA & 2% below its 50-dMA.

Max Retracement from bottom: 56% Wednesday.

The slope of the 200-dMA is up.


There was a nice positive move for the Indices today with a reasonably strong close. We need to break above the recent high of 4589 on the S&P 500 before we can feel a little more positive. The pullback won’t really be over until the S&P 500 makes new highs.


There were 58 new-highs today vs 242 new-lows so this stat is still going the wrong way. Breadth is looking up though; over the last 10-days, 50.3% of issues on the NYSE have been up. That’s the first time in 3-weeks that the 10-day % of issues advancing has been above 50%. On a longer, 100-day basis, the stats still look bad, but we’ll take what we can get. One has to start somewhere so it is good to see the 10-day data improve.


The daily sum of 20 Indicators improved from +2 to +4 (a positive number is bullish; negatives are bearish); the 10-day smoothed sum that smooths the daily fluctuations improved from +11 to +18 (The trend direction is more important than the actual number for the 10-day value.) These numbers sometimes change after I post the blog based on data that comes in late. Most of these indicators are short-term so they tend to bounce around a lot.


The Long Term NTSM indicator ensemble remained to HOLD. Volume is bullish; VIX, Price & Sentiment are Neutral.


The S&P 500 remains below its 50-dMA.  That will be a level of resistance.


We saw some improvement in internals today, but the S&P 500 still needs to break back above its 50-dMA.


I remain cautiously bullish. 


POSITIONS ADDED:

Wednesday, 26 January: AAPL; XLE;

Monday, 31 January: QLD; SPY


MOMENTUM ANALYSIS:

TODAY’S RANKING OF 15 ETFs (Ranked Daily)

The top ranked ETF receives 100%. The rest are then ranked based on their momentum relative to the leading

ETF.

*For additional background on the ETF ranking system see NTSM Page at…

http://navigatethestockmarket.blogspot.com/p/exchange-traded-funds-etf-ranking.html


TODAY’S RANKING OF THE DOW 30 STOCKS (Ranked Daily)

Here’s the revised DOW 30 and its momentum analysis. The top ranked stock receives 100%. The rest are then ranked based on their momentum relative to the leading stock.

For more details, see NTSM Page at…

https://navigatethestockmarket.blogspot.com/p/a-system-for-trading-dow-30-stocks-my_8.html


TUESDAY MARKET INTERNALS (NYSE DATA)

Market Internals remained HOLD.


Market Internals are a decent trend-following analysis of current market action, but should not be used alone for short term trading. They are usually right, but they are often late.  They are most useful when they diverge from the Index. 


My stock-allocation in the portfolio is about 65% invested in stocks. This is above my “normal” fully invested stock-allocation of 50%. I will hold this trading-position for a while, but it will not be a long-term hold.


I trade about 15-20% of the total portfolio using the momentum-based analysis I provide here. If I can see a definitive bottom, I’ll add a lot more stocks to the portfolio using an S&P 500 ETF.


You may wish to have a higher or lower % invested in stocks depending on your risk tolerance. 50% is a conservative position that I consider fully invested for most retirees.


As a general rule, some suggest that the % of portfolio invested in the stock market should be one’s age subtracted from 100.  So, a 30-year-old person would have 70% of the portfolio in stocks, stock mutual funds and/or stock ETFs.  That’s ok, but for older investors, I usually don’t recommend keeping less than 50% invested in stocks (as a fully invested position) since most people need some growth in the portfolio to keep up with inflation.

Monday, February 7, 2022

Earnings … Net Inflows Into Stocks ... Coronavirus (Covid-19) … Stock Market Analysis … ETF Trading … Dow 30 Ranking

“Trade what you see; not what you think.” – The Old Fool, Richard McCranie, trader extraordinaire.


"President Trump is wrong…I had no right to overturn the election. The presidency belongs to the American people, and the American people alone. And frankly there is almost no idea more un-American than the notion that any one person could choose the American president...Men and women, if we lose faith in the Constitution, we won't just lose elections, we will lose our country."  - Mike R. Pence, VP.


“Let's face it. Let's call it what it is. Jan. 6 was a riot that was incited by Donald Trump in an effort to intimidate Mike Pence and the Congress into doing exactly what he said in his own words last week: Overturn the election.” – Chris Christie, former republican Governor of NJ.


“While vital to calculating ways to survive a warming world, climate models are hitting a wall. They are running up against the complexity of the physics involved; the limits of scientific computing; uncertainties around the nuances of climate behavior; and the challenge of keeping pace with rising levels of carbon dioxide, methane and other greenhouse gases. Despite significant improvements, the new models are still too imprecise to be taken at face value, which means climate-change projections still require judgment calls.” - RL Holtz, WSJ


EARNINGS (FactSet)

“Overall, 56% of the companies in the S&P 500 have reported actual results for Q4 2021 to date. Of these companies, 76% have reported actual EPS above estimates, which is equal to the five-year average of 76%. In aggregate, companies are reporting earnings that are 8.2% above estimates, which is slightly below the five-year average of 8.6%...The blended (combines actual results for companies that have reported and estimated results for companies that have yet to report) earnings growth rate for the fourth quarter is 29.2% today... If 29.2% is the actual growth rate for the quarter, it will mark the fourth straight quarter of earnings growth above 25% for the index. The last time the index reported four straight quarters of earnings growth above 25% was Q4 2009 through Q3 2010.” FactSet earnings report at...

https://insight.factset.com/sp-500-earnings-season-update-february-4-2022


GOLDMAN SAYS FOR THE FIRST TIME IN 2022 WE SEE MASSIVE NET INFLOWS (ZeroHedge)

“So now that the bulk of earnings season has passed, and despite some high profile tech misses - most notably Facebook - is it safe to say that markets have finally stabilized? For the answer we go to Rubner's [Scott Rubner, Goldman Sachs flow trader] weekly tactical flow of funds note, which recaps where investors are putting their money to work in 2022. What is most notable this time, is that according to Rubner, while we are still not “all clear” after week 5, for the first time in 2022, net demand is set to exceed net supply this coming week.” Commentary at... 

https://www.zerohedge.com/markets/goldman-first-time-2022-we-see-massive-net-inflows-stocks-week


MARKET REPORT / ANALYSIS

-Monday the S&P 500 rose about 0.4% to 4484.

-VIX declined about 1% to 22.99.

-The yield on the 10-year Treasury rose to 1.921%. 


Given that most corrections retest their prior lows, I’ll keep the pullback stats for a while.

Pullback Data:

Days since top: 24 (Avg= 30 days for corrections <10%; 60 days for larger, non-crash pullbacks)

Drop from Top: Now 6.5%; Max intraday: 12% (Avg.= 13% for non-crash pullbacks)

The S&P 500 is 0.9% above its 200-dMA & 2.8% below its 50-dMA.

Max Retracement from bottom: 56% Wednesday.

The slope of the 200-dMA is up.


I forgot a bullish sign in my Friday rundown of indicators: On 31 January and 1 February there were back-to-back high volume up-days (80% up-volume or better).  That is a bullish sign that the pullback may be over. There were a couple of down-days afterwards so that muddies the water a little. Adding the bull-sign I missed Friday would make the count 11-Bull to 10-Bear indicators – not much difference.  That’s a balanced indication that shows investors are confused.


As today’s chart indicates (below), investors still haven’t decided what to do with this market: Buy-the-dip or sell-the-rip? The Russell 2000 and the NYSE Composite were both up today while the major indices were down. The Russell is the lowest quality index.  Seeing it lead is a bullish sign to me.


Internals were mixed.  Up-volume outpaced down-volume by about 40% and the # of stocks advancing outpaced the decliners by about 15%. The holdout has been the new-high/new-low data.  The new-lows outpaced new-highs by 140 issues Monday.  That was better than Friday when the spread was 193. The new-high/new-low spread always lags, but we need to see it turn positive again soon. It was positive Tuesday and Wednesday of last week.


I measure Sentiment as %-Bulls (Bulls/{bulls+bears}) based on the amounts invested in selected Rydex/Guggenheim mutual funds. My Sentiment indicator is finally getting closer to a bearish, buy-zone, but it has not given a bull signal on a 5-day basis.


I didn’t see much change in the Friday indicators as I scanned thru my numbers today. Short-term indicators haven’t changed much either.


The daily sum of 20 Indicators declined from +3 to +2 (a positive number is bullish; negatives are bearish); the 10-day smoothed sum that smooths the daily fluctuations improved from +3 to +11 (The trend direction is more important than the actual number for the 10-day value.) These numbers sometimes change after I post the blog based on data that comes in late. Most of these indicators are short-term so they tend to bounce around a lot.


The Long Term NTSM indicator ensemble remained to HOLD. Volume is bullish; VIX, Price & Sentiment are Neutral.


I remain cautiously bullish.  The S&P 500 still needs to break back above its 50-dMA. The bulls don’t want to see the S&P 500 fall below its 200-dMA.


POSITIONS ADDED:

Wednesday, 26 January: AAPL; XLE;

Monday, 31 January: QLD; SPY


MOMENTUM ANALYSIS:

TODAY’S RANKING OF 15 ETFs (Ranked Daily)

The top ranked ETF receives 100%. The rest are then ranked based on their momentum relative to the leading

ETF.

*For additional background on the ETF ranking system see NTSM Page at…

http://navigatethestockmarket.blogspot.com/p/exchange-traded-funds-etf-ranking.html


TODAY’S RANKING OF THE DOW 30 STOCKS (Ranked Daily)

Here’s the revised DOW 30 and its momentum analysis. The top ranked stock receives 100%. The rest are then ranked based on their momentum relative to the leading stock.

For more details, see NTSM Page at…

https://navigatethestockmarket.blogspot.com/p/a-system-for-trading-dow-30-stocks-my_8.html


MONDAY MARKET INTERNALS (NYSE DATA)

Market Internals remained HOLD.


Market Internals are a decent trend-following analysis of current market action, but should not be used alone for short term trading. They are usually right, but they are often late.  They are most useful when they diverge from the Index. 


My stock-allocation in the portfolio is about 65% invested in stocks. This is above my “normal” fully invested stock-allocation of 50%. I will hold this trading-position for a while, but it will not be a long-term hold.


I trade about 15-20% of the total portfolio using the momentum-based analysis I provide here. If I can see a definitive bottom, I’ll add a lot more stocks to the portfolio using an S&P 500 ETF.


You may wish to have a higher or lower % invested in stocks depending on your risk tolerance. 50% is a conservative position that I consider fully invested for most retirees.


As a general rule, some suggest that the % of portfolio invested in the stock market should be one’s age subtracted from 100.  So, a 30-year-old person would have 70% of the portfolio in stocks, stock mutual funds and/or stock ETFs.  That’s ok, but for older investors, I usually don’t recommend keeping less than 50% invested in stocks (as a fully invested position) since most people need some growth in the portfolio to keep up with inflation.