Tuesday, August 24, 2021

New Home Sales ... No Important Sectors Supporting the Bulls … Coronavirus (Covid-19) … Stock Market Analysis … ETF Trading … Dow 30 Ranking

“Trade what you see; not what you think.” – The Old Fool, Richard McCranie, trader extraordinaire.


“In 2020, the top 20% of taxpayers paid 78% of federal income taxes, according to the Tax Policy Center, which was up from 68% in 2019. The top 1% of taxpayers paid 28% of taxes in 2020, up from 25% in 2019.” - ZeroHedge.


NEW HOME SALES (Reuters)

“Sales of new U.S. single-family homes increased in July after three straight monthly declines, but housing market momentum is slowing as surging housing prices amid tight supply sideline potential buyers from the market... New home sales rose 1.0% to a seasonally adjusted annual rate of 708,000 units last month. ” Story at...

https://www.reuters.com/world/us/us-new-home-sales-increase-july-2021-08-24/


NO KEY SECTORS SUPPORTING THE BULLS (Heritage Capital, 23 Aug)

“In what would be the most unlikely of scenarios, it would be super interesting and surprising if the S&P 400 and Russell 2000 gathered themselves for a run to new highs while the other indices went sideways or pulled back. My four key sectors are not offering any support to the bulls as none are at or close to new highs...The bulls absolutely need to see a minimum of two sectors move to new highs on the next rally. If not, a more significant overall stock market decline may get closer.” Paul Schatz,  President Heritage Capital. Full commentary at...

https://investfortomorrow.com/blog/no-key-sectors-supporting-bulls/


CORONAVIRUS (NTSM)

Here’s the latest from the COVID19 Johns Hopkins website as of 6:00 PM Tuesday. U.S. total case numbers are on the left axis; daily numbers are on the right side of the graph in Red with the 10-dMA of daily numbers in Green.


The 10-dMA of new cases has been bouncing up and down so it is not clear to me that this wave has peaked.  When we smooth out the 10-dMA to get a better handle on trend, it is still rising. Keep an eye on this. Dr. Gottlieb thinks this wave of the pandemic is waning – we’ll see.


MARKET REPORT / ANALYSIS

-Tuesday the S&P 500 rose about 0.2% to 4486.

-VIX rose about 0.3% to 17.20.

-The yield on the 10-year Treasury rose to 1.295%.


The S&P 500 made a new high today, slightly higher than the last new-high.  On the bullish side, we’ve seen 3 days in a row with advancing volume above 75%. It was 81% today. A nice bullish sign. On the other hand, there was a significant dip late in the day as the index gave up more than half of its gain. That’s somewhat bearish and raises the concern that tomorrow will continue the trend down.


Further, only 3.4% of issues on the NYSE made new, 52-week, all-time-highs at today’s new S&P 500 high. That’s very close to my Bear-signal for this indicator.  Even if it didn’t quite send the bear signal, it still is a warning that the market is not as healthy as it would seem. We still have both the 10-dMA and the 50-dMA of Breadth (percentage of issues advancing on the NYSE) below 50%. The 50-dMA of breadth has been below 50% for 6 days in a row.  3 days in a row is practically a definition of a pullback; that stat needs to improve soon or markets will be headed down. However, there were bullish signs.


Tuesday, the McClellan Oscillator turned positive so all recent Hindenburg Omens have been cancelled.  This occurred because the ratio of new-highs to new-lows has improved and the number of new-lows declined. That’s all bullish.


We’ve also had 3 consecutive days with up-vol greater than 75% - that’s a strong Bullish sign, too.


The daily sum of 20 Indicators improved from -8 to -6 (a positive number is bullish; negatives are bearish); the 10-day smoothed sum that smooths the daily fluctuations slipped from -63 to -68. (These numbers sometimes change after I post the blog based on data that comes in late.) Most of these indicators are short-term and many are trend following.


The Long Term NTSM indicator ensemble remained HOLD. Price, Volume, VIX & Sentiment indicators are neutral.  


I am less convinced that we’re going to have a pullback. Still, it’s odd to see such a consistently strong bounce coming after a slight dip of less than 2% when combined with extremely poor market-internals and bearish internal divergences in utilities and cyclicals only a few days ago.  Perhaps we should thank the FED again!


If signs continue to improve, I’ll get back to a fully invested position in the next day or 2.


MOMENTUM ANALYSIS:

TODAY’S RANKING OF 15 ETFs (Ranked Daily)

The top ranked ETF receives 100%. The rest are then ranked based on their momentum relative to the leading

ETF.
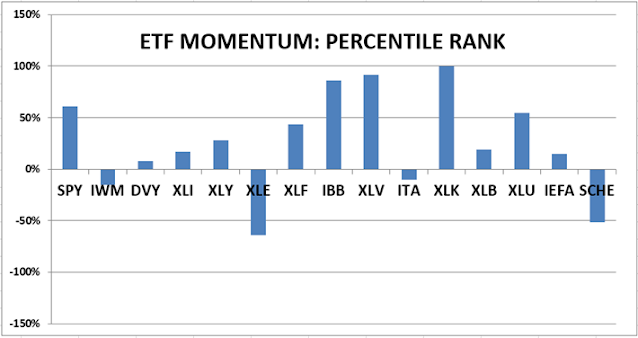
*For additional background on the ETF ranking system see NTSM Page at…

http://navigatethestockmarket.blogspot.com/p/exchange-traded-funds-etf-ranking.html


TODAY’S RANKING OF THE DOW 30 STOCKS (Ranked Daily)

Here’s the revised DOW 30 and its momentum analysis. The top ranked stock receives 100%. The rest are then ranked based on their momentum relative to the leading stock.

For more details, see NTSM Page at…

https://navigatethestockmarket.blogspot.com/p/a-system-for-trading-dow-30-stocks-my_8.html


TUESDAY MARKET INTERNALS (NYSE DATA)

Market Internals remained NEUTRAL on the market.


Market Internals are a decent trend-following analysis of current market action, but should not be used alone for short term trading. They are usually right, but they are often late.  They are most useful when they diverge from the Index. 


Using the Short-term indicator in 2018 in SPY would have made a 5% gain instead of a 6% loss for buy-and-hold. The methodology was Buy on a POSITIVE indication and Sell on a NEGATIVE indication and stay out until the next POSITIVE indication. The back-test included 13-buys and 13-sells, or a trade every 2-weeks on average.  


My stock-allocation is about 45% invested in stocks. I am bearish and watching the markets and indicators closely. This is only slightly below my fully invested position of 50%.


You may wish to have a higher or lower % invested in stocks depending on your risk tolerance. 50% is a conservative position that I consider fully invested for most retirees. As a retiree, 50% in the stock market is about fully invested for me – it is a cautious and conservative number. If I feel very confident, I might go to 60%; if a correction is deep enough, and I can call a bottom, 80% would not be out of the question.

Monday, August 23, 2021

Existing Home Sales ... IHS Flash Composite PMI … Stocks Haven’t Fallen 5% in 200 Sessions ... Coronavirus (Covid-19) … Stock Market Analysis … ETF Trading … Dow 30 Ranking

“Trade what you see; not what you think.” – The Old Fool, Richard McCranie, trader extraordinaire.


“American troops cannot and should not be fighting in a war and dying in a war that Afghan forces are not willing to fight for themselves.”- President Joe Biden.


“Their soldiers fought and died in very substantial numbers. It’s way over 60,000 dead. Roughly 27 times as many Afghans died fighting for their country as did Americans.” – General David Petraeus, Retired.


EXISTING HOME SALES (National Association of Realtors)

“-Existing-home sales rose 2% on a seasonally adjusted annual rate from June to July, with no sales declines showing in any regions.

-The inventory of unsold homes increased 7.3% to 1.32 million from June to July – equivalent to 2.6 months of the monthly sales pace.

-The median existing-home sales price rose at a year-over-year pace of 17.8%.” Press release at...

https://www.nar.realtor/newsroom/existing-home-sales-climb-2-0-in-july


IHS FLASH COMPOSITE PMI (Markit Economics)

“Private sector companies across the U.S. signalled a further strong upturn in business activity during August, however, the pace of growth slowed to an eight-month low. Capacity pressures, material shortages and the spread of the Delta variant reportedly weighed on the output expansion...The expansion slowed sharply again in August as the spread of the Delta variant led to a weakening of demand growth, especially for consumer-facing services, and further frustrated firms’ efforts to meet existing sales...Not only have supply chain delays hit a new survey record high, but the August survey saw increasing frustrations in relation to hiring.” Press release at...

https://www.markiteconomics.com/Public/Home/PressRelease/2ebf3c08ba874510879b6b2976cc98c4


S&P 500 HASN’T FALLEN 5% FROM A PEAK IN NEARLY 200 SESSIONS (MarketWatch)

“Friday marked the 200th session without a drawdown of 5% or more from a recent peak, making the current stretch of levitation the longest such since 2016, when the market went 404 sessions without falling by at least 5% peak to trough...It is extremely rare for the market to enjoy such a period of relative effervescence. Indeed, such lengthy stretches without a 5% pullback or better have occurred on only eight occasions in the S&P 500 index...” Story at...

https://www.marketwatch.com/story/the-s-p-500-hasnt-fallen-by-at-least-5-in-nearly-200-sessions-heres-what-history-says-happens-next-11629401149?siteid=yhoof2


CORONAVIRUS (NTSM)

Here’s the latest from the COVID19 Johns Hopkins website as of 5:30 PM Monday. U.S. total case numbers are on the left axis; daily numbers are on the right side of the graph in Red with the 10-dMA of daily numbers in Green.


MARKET REPORT / ANALYSIS

-Monday the S&P 500 rose about 0.9% to 4480.

-VIX fell about 8% to 17.15.

-The yield on the 10-year Treasury slipped to 1.252%.


The S&P 500 almost made a new high today, but it couldn’t hold it at the close and drifted down slightly below the old high of 4479.71.  That’s less than a point below the prior high 4479.53, so essentially, the Index made a double top today.  Now it needs to power higher to convince us that this weakness is over. It may happen, but bearish signs are still in place.


Monday, there was another Hindenburg Omen. While price has marched higher, the internals still look weak.


Today was another statistically significant up-day. That just means that the price-volume move exceeded my statistical parameters. Statistics show that a statistically-significant, up-day is followed by a down-day about 60% of the time. I said yesterday’s action could have been a dead-cat-bounce. I didn’t see anything today that would prove or disprove that comment.


Looking at the Friday rundown of some important indicators, only 2 bearish signs switched to bull signs Monday:

(1) The smoothed advancing volume on the NYSE is rising.

(2) 55% of the 15-ETFs that I track have been up over the last 10-days.


A new total run-down of some important indicators is still quite bearish (14-bear signs vs. 4-bull signs). These indicators tend to be both long-term and short-term, so they are somewhat different than the 20 that I report on daily.


The daily sum of 20 Indicators improved from -10 to -8 (a positive number is bullish; negatives are bearish); the 10-day smoothed sum that smooths the daily fluctuations slipped from -56 to -63. (These numbers sometimes change after I post the blog based on data that comes in late.) Most of these indicators are short-term and many are trend following.


The Long Term NTSM indicator ensemble remained HOLD. The VIX indicator improved. Price, Volume, VIX & Sentiment indicators are neutral.  


It still looks like we’re going to have a pullback of some kind. In the recent past, the S&P 500 has not broken thru its 50-dMA. The S&P 500 is 2.8% above its 50-dMA. I’m a little more bearish, but I think the drop will probably less than 10% down. As always, there are no guarantees (the market could always just power higher) – Mr. Market doesn’t read my blog.


MOMENTUM ANALYSIS:

TODAY’S RANKING OF 15 ETFs (Ranked Daily)

The top ranked ETF receives 100%. The rest are then ranked based on their momentum relative to the leading

ETF.

*For additional background on the ETF ranking system see NTSM Page at…

http://navigatethestockmarket.blogspot.com/p/exchange-traded-funds-etf-ranking.html


TODAY’S RANKING OF THE DOW 30 STOCKS (Ranked Daily)

Here’s the revised DOW 30 and its momentum analysis. The top ranked stock receives 100%. The rest are then ranked based on their momentum relative to the leading stock.

For more details, see NTSM Page at…

https://navigatethestockmarket.blogspot.com/p/a-system-for-trading-dow-30-stocks-my_8.html


MONDAY MARKET INTERNALS (NYSE DATA)

Market Internals improved to NEUTRAL on the market.


Market Internals are a decent trend-following analysis of current market action, but should not be used alone for short term trading. They are usually right, but they are often late.  They are most useful when they diverge from the Index. 


Using the Short-term indicator in 2018 in SPY would have made a 5% gain instead of a 6% loss for buy-and-hold. The methodology was Buy on a POSITIVE indication and Sell on a NEGATIVE indication and stay out until the next POSITIVE indication. The back-test included 13-buys and 13-sells, or a trade every 2-weeks on average.  

My stock-allocation is about 45% invested in stocks. I am bearish and watching the markets and indicators closely.


You may wish to have a higher or lower % invested in stocks depending on your risk tolerance. 50% is a conservative position that I consider fully invested for most retirees. As a retiree, 50% in the stock market is about fully invested for me – it is a cautious and conservative number. If I feel very confident, I might go to 60%; if a correction is deep enough, and I can call a bottom, 80% would not be out of the question.


Friday, August 20, 2021

Fewer NDX Stocks in an Uptrend ... Tech Holding Up Indices … Coronavirus (Covid-19) … Stock Market Analysis … ETF Trading … Dow 30 Ranking

“Trade what you see; not what you think.” – The Old Fool, Richard McCranie, trader extraordinaire.


“People always ask me what is going on in the markets. It is simple. Greatest Speculative Bubble of All Time in All Things. By two orders of magnitude.” – Michael “Big Short” Burry.


FEWER NDX STOCKS IN THE UPREND (McClellan Financial Publications)

“Notice that when the final March 2000 top came for the Nasdaq 100, there was a pretty monstrous divergence between prices and this indicator...The current divergence now in 2021 is a gentler one, so perhaps not foretelling great calamity this time, but still saying that the energy of the advance has been waning, and setting up for a decline of some kind.” – Tom McClellan. Commentary at...

https://www.mcoscillator.com/learning_center/weekly_chart/waning_number_of_ndx_stocks_in_the_uptrend/


TECH HOLDING UP THE INDICES (Heritage Capital)

“For now, all of the warning signs I have been discussing this month remain in place. The stock market is not behaving well, but the bears have been unable to make any meaningful downside progress... If the mega tech stocks begin to rollover, that could spell challenges to the indices. However, I keep hearing the pundit nonsense that investors won’t sell; they will just rotate to other stocks and prevent the market from correcting. Not only is that idiotic, but it’s also how larger declines unfold.” – Paul Schatz, President, Heritage Capital. Commentary at...

https://investfortomorrow.com/blog/tech-holding-up-indices-for-now/


CORONAVIRUS (NTSM)

Here’s the latest from the COVID19 Johns Hopkins website as of 5:30 PM Friday. U.S. total case numbers are on the left axis; daily numbers are on the right side of the graph in Red with the 10-dMA of daily numbers in Green.


MARKET REPORT / ANALYSIS

-Friday the S&P 500 rose about 0.8% to 4442.

-VIX fell about 14% to 18.56.

-The yield on the 10-year Treasury rose to 1.261%.


The Friday’s run-down of some important indicators is very bearish (16-bear and 2-bull) and the numbers are close to what they were just before the Coronavirus, 34%-correction. These indicators tend to be both long-term and short-term, so they are somewhat different than the 20 that I report on daily. Details follow:


BULL SIGNS

-The 100-dMA of the % of issues advancing on the NYSE (Breadth) is above 50%.

-The 5-10-20 Timer System is BUY; the 5-dEMA and 10-dEMA are both above the 20-dEMA. 


NEUTRAL

-Distribution Days.  There have been 2 in the last 25-days. Neutral.

-Bollinger Bands

-RSI.

-Statistically, the S&P 500 gave a panic-signal, 18 June, but the signal has expired.

-Non-crash Sentiment indicator remains neutral, but it is very bullish and that means the signal is leaning bearish.

-4.4% of all issues traded on the NYSE made new, 52-week highs when the S&P 500 made a new all-time-high today, 16 August. (There is no bullish signal for this indicator.) This is below average, but not low enough to send a bear signal – something to watch.

-The Fosback High-Low Logic Index is neutral.

-There have been 13 up-days over the last 20 days. Neutral

-There have been 7 up-days over the last 10-days. Neutral

-The size of up-moves has been smaller than the size of down-moves over the last month, but not enough to give a signal.

-VIX was sell yesterday, but improved to Neutral Friday.

-Overbought/Oversold Index (Advance/Decline Ratio).

-29 July, the 52-week, New-high/new-low ratio improved by 0.4 standard deviations, somewhat bullish, but neutral.

-There have been 2 Statistically-Significant days in the last 15-days. This can be a bull or bear signal. 2 is neutral. 

-The S&P 500 is 10.6% above its 200-dMA (Bear indicator is 12%.). This value was 15.9% above the 200-dMA when the 10% correction occurred in Sep 2020.


BEAR SIGNS

-The 10-dMA % of issues advancing on the NYSE (Breadth) is below 50%.

-The 50-dMA % of issues advancing on the NYSE (Breadth) is below 50%.

-MACD of S&P 500 price made a bearish crossover, 17 August.

-McClellan Oscillator.

-The S&P 500 is under-performing the Utilities ETF (XLU).

-Slope of the 40-dMA of New-highs is down. This is one of my favorite trend indicators.

-Cyclical Industrials (XLI-ETF) have been under-performing the S&P 500 recently.

-The smoothed advancing volume on the NYSE is falling.

-MACD of the percentage of issues advancing on the NYSE (breadth) made a bearish crossover 10 August.

-Breadth on the NYSE compared to the S&P 500 index is bearish.

-My Money Trend indicator.

-Long-term new-high/new-low data is falling.

-Short-term new-high/new-low data is falling.

-There were 3 Hindenburg Omen signals 16-18 Aug and another one today.  They will remain in effect until the McClellan Oscillator turns positive.

-The Smart Money (late-day action). (This indicator is based on the Smart Money Indicator developed by Don Hayes).

-47% of the 15-ETFs that I track have been up over the last 10-days.


On Friday, 21 February, 2 days after the top of the Coronavirus pullback, there were 10 bear-signs and 1 bull-sign. Now there are 16 bear-signs and 2 bull-signs. Last week, there were 7 bear-signs and 11 bull-signs.


Today was a statistically significant up-day. That just means that the price-volume move exceeded my statistical parameters. Statistics show that a statistically-significant, up-day is followed by a down-day about 60% of the time. Given the indicators, this suggests that today was just a dead cat bounce...we'll see.


The daily sum of 20 Indicators improved from -13 to -10 (a positive number is bullish; negatives are bearish); the 10-day smoothed sum that smooths the daily fluctuations slipped from -48 to -56. (These numbers sometimes change after I post the blog based on data that comes in late.) Most of these indicators are short-term and many are trend following.


The Long Term NTSM indicator ensemble remained HOLD. The VIX indicator improved. Price, Volume, VIX & Sentiment indicators are neutral.  


Today’s summary of indicators is very bearish and that suggests more strongly that we’re going to have a pullback of some kind. In the recent past, the S&P 500 has not broken thru its 50-dMA. That would imply only a 2% drop from here, not even a correction. I’m a little more bearish, but I think the drop will probably less than 10% down. As always, there are no guarantees – Mr. Market doesn’t read my blog.


MOMENTUM ANALYSIS:

TODAY’S RANKING OF 15 ETFs (Ranked Daily)

The top ranked ETF receives 100%. The rest are then ranked based on their momentum relative to the leading

ETF.

*For additional background on the ETF ranking system see NTSM Page at…

http://navigatethestockmarket.blogspot.com/p/exchange-traded-funds-etf-ranking.html


TODAY’S RANKING OF THE DOW 30 STOCKS (Ranked Daily)

Here’s the revised DOW 30 and its momentum analysis. The top ranked stock receives 100%. The rest are then ranked based on their momentum relative to the leading stock.

For more details, see NTSM Page at…

https://navigatethestockmarket.blogspot.com/p/a-system-for-trading-dow-30-stocks-my_8.html


FRIDAY MARKET INTERNALS (NYSE DATA)

Market Internals remained BEARISH on the market.


Market Internals are a decent trend-following analysis of current market action, but should not be used alone for short term trading. They are usually right, but they are often late.  They are most useful when they diverge from the Index. 


Using the Short-term indicator in 2018 in SPY would have made a 5% gain instead of a 6% loss for buy-and-hold. The methodology was Buy on a POSITIVE indication and Sell on a NEGATIVE indication and stay out until the next POSITIVE indication. The back-test included 13-buys and 13-sells, or a trade every 2-weeks on average.  


My stock-allocation is about 45% invested in stocks. I am bearish and watching the markets closely.


You may wish to have a higher or lower % invested in stocks depending on your risk tolerance. 50% is a conservative position that I consider fully invested for most retirees. As a retiree, 50% in the stock market is about fully invested for me – it is a cautious and conservative number. If I feel very confident, I might go to 60%; if a correction is deep enough, and I can call a bottom, 80% would not be out of the question.

Thursday, August 19, 2021

Leading Economic Indicators LEI ... Jobless Claims ... Philadelphia Fed Index … Coronavirus (Covid-19) … Stock Market Analysis … ETF Trading … Dow 30 Ranking

“Trade what you see; not what you think.” – The Old Fool, Richard McCranie, trader extraordinaire.


“People always ask me what is going on in the markets. It is simple. Greatest Speculative Bubble of All Time in All Things. By two orders of magnitude.” – Michael “Big Short” Burry.


LEADING ECONOMIC INDICATORS (Conference Board)

“The Conference Board Leading Economic Index® (LEI)for the U.S. increased by 0.9 percent in July to 116.0 (2016 = 100), following a 0.5 percent increase in June and a 1.2 percent increase in May. “The U.S. LEI registered another large gain in July, with all components contributing positively,” said Ataman Ozyildirim, Senior Director of Economic Research at The Conference Board. “The Leading Index’s overall upward trend, which started with the end of the pandemic-induced recession in April 2020, is consistent with strong economic growth in the second half of the year. While the Delta variant and/or rising inflation fears could create headwinds for the US economy in the near term, we expect real GDP growth for 2021 to reach 6.0 percent year-over-year, before easing to a still robust 4.0 percent growth rate for 2022.” Press release at...

https://conference-board.org/data/bcicountry.cfm?cid=1


JOBLESS CLAIMS (Yahoo Finance)

“Initial unemployment claims fell further last week to the lowest level since March 2020, bringing the level of weekly new filings closer to pre-virus levels... Initial unemployment claims, week ended August 14: 348,000 vs. 364,000 expected...” Story at...

https://finance.yahoo.com/news/weekly-jobless-claims-week-ended-august-14-2021-181609988.html


PHILADELPHIA FED INDEX (Advisor Perspectives)

“The latest Manufacturing Index came in at 19.4, down 2.5 from last month's 21.9...Since this is a diffusion index, negative readings indicate contraction, positive ones indicate expansion...‘Most future indexes moderated this month but continue to indicate that the firms expect growth over the next six months.’”  Commentary at... 

https://www.advisorperspectives.com/dshort/updates/2021/08/19/philly-fed-mfg-index-current-indicators-remain-positive


MARKET NOT RUNNING ON ALL CYLINDERS (Heritage Capital)

“...Now, just because I keep writing about all these warnings doesn’t mean Armageddon is upon us. It is entirely possible that the stock market can explode higher from here and correct many, most or all of the warnings. I don’t think that’s the likely scenario, but it is a possible... I will continue to buy weakness and sell strength as best I can until proven otherwise.” Commentary at...

https://investfortomorrow.com/blog/market-not-running-on-all-cylinders/


EDUCATION DEPT CANCELS STUDENT DEBT - THE GIVEAWAYS CONTINUE (CNBC)

“The U.S. Department of Education announced on Thursday it will cancel $5.8 billion in student debt for more than 320,000 borrowers [on average, 18,000 per person]....The Education Department under the Biden administration has also canceled the student debt for thousands of students who attended for-profit schools...“You don’t need Congress,” Sen. Majority Leader Chuck Schumer, D-N.Y., has said. “All you need is the flick of a pen.” Story at...

https://www.cnbc.com/2021/08/19/education-department-cancels-student-debt-for-over-320000-borrowers-.html

My cmt: I spent 35-years in government managing programs. To spend even 1 dollar, it takes 2 acts of Congress: (1) An authorizing bill; (2) an appropriations bill. How the Education Department can cancel Billions of dollars in Debt is beyond me.


CYBER EXPERT PROVES LINDELL WRONG – DEMANDS $5 MILLION REWARD (msn.com)

“Lindell [Mike Lindell, My Pillow, CEO] has long claimed to be in possession of a large set of network data from the 2020 election, saved as packet captures, or .pcap files. He's even claimed that it contained every vote cast last November.  Not so, says Alderson [Bill Alderson, Republican & longtime cybersecurity expert]. It took roughly 45 minutes for him to see that the data given to him and the dozens of other experts in attendance was bunk — not only did it fail to prove anything about the accuracy of the 2020 election, but the files weren't even in the right format. "P-CAPs adhere to an international standard," Alderson said.” Story at...

https://www.msn.com/en-us/news/politics/mike-lindell-lashes-out-as-cyber-expert-demands-5m-reward-for-debunking-election-data/ar-AANtCDB?ocid=Peregrine

My cmt: Lindell claims his team hacked the data from the Chinese. Maybe they did.  Maybe, this entire episode is a Chinese set-up and Lindell is the foil.  That makes more sense than the possibility that bad actors faked millions of votes to steal the election from Trump.


CORONAVIRUS (NTSM)

Here’s the latest from the COVID19 Johns Hopkins website as of 7:30 PM Thursday. U.S. total case numbers are on the left axis; daily numbers are on the right side of the graph in Red with the 10-dMA of daily numbers in Green.


MARKET REPORT / ANALYSIS

-Thursday the S&P 500 rose about 01% to 4406.

-VIX rose about 0.5% to 21.67.

-The yield on the 10-year Treasury slipped to 1.246%.


It doesn’t take another Hindenburg Omen to know that conditions are ripe for a pullback. Today would have created another Omen, but New-highs have dropped below the threshold. For an Omen to be triggered, both new-highs and new-lows must be elevated.  Still, internals didn’t look good.


Thursday’s key NYSE market internal data follows: Only 20% of volume was up-volume; only 29% of issues were advancing; 118 issues made new 52-week lows vs. only 47 issues that made new,52-week highs. Utilities outpaced the S&P 500 while the XLI underperformed the Index. Both are bearish signs.  


VIX continued its climb and is still giving a bear signal.


The 50-dMA of stocks advancing on the NYSE was only 48.5% today. Simply stated, this means that more than half of the issues on the NYSE have been down over the last 2-1/2 months. Today is the third day in a row that the 50-dMA has been below 50% advancing issues. For me that is a definition of a pullback.


The daily sum of 20 Indicators declined from -12 to -13 (a positive number is bullish; negatives are bearish); the 10-day smoothed sum that smooths the daily fluctuations slipped from -40 to -48. (These numbers sometimes change after I post the blog based on data that comes in late.) Most of these indicators are short-term and many are trend following.


The Long Term NTSM indicator remained HOLD, but the VIX indicator continued its bear indication. VIX is one of my better indicators and a negative VIX indication is not a good sign. Price, Volume & Sentiment are neutral; VIX is bearish.  


So, we have a lot of bear indications. To me it looks like we’re going to have a pullback of some kind, probably less than 10% down.  I’ll be looking for a reversal though; Mr. Market doesn’t always agree with indicators, no matter who owns them.


I sold my XLK position this morning.  I’ll pick up a new momentum play as soon as indicators improve enough to convince me that markets are headed up.


MOMENTUM ANALYSIS:

TODAY’S RANKING OF 15 ETFs (Ranked Daily)

The top ranked ETF receives 100%. The rest are then ranked based on their momentum relative to the leading ETF.

*For additional background on the ETF ranking system see NTSM Page at…

http://navigatethestockmarket.blogspot.com/p/exchange-traded-funds-etf-ranking.html


TODAY’S RANKING OF THE DOW 30 STOCKS (Ranked Daily)

Here’s the DOW 30 and its momentum analysis. The top ranked stock receives 100%. The rest are then ranked based on their momentum relative to the leading stock.

For more details, see NTSM Page at…

https://navigatethestockmarket.blogspot.com/p/a-system-for-trading-dow-30-stocks-my_8.html


THURSDAY MARKET INTERNALS (NYSE DATA)

Market Internals remained BEARISH on the market.


Market Internals are a decent trend-following analysis of current market action, but should not be used alone for short term trading. They are usually right, but they are often late.  They are most useful when they diverge from the Index. 


Using the Short-term indicator in 2018 in SPY would have made a 5% gain instead of a 6% loss for buy-and-hold. The methodology was Buy on a POSITIVE indication and Sell on a NEGATIVE indication and stay out until the next POSITIVE indication. The back-test included 13-buys and 13-sells, or a trade every 2-weeks on average.


My stock-allocation is about 45% invested in stocks. I am bearish and watching the markets closely.


You may wish to have a higher or lower % invested in stocks depending on your risk tolerance. 50% is a conservative position that I consider fully invested for most retirees. As a retiree, 50% in the stock market is about fully invested for me – it is a cautious and conservative number. If I feel very confident, I might go to 60%; if a correction is deep enough, and I can call a bottom, 80% would not be out of the question.

Reduced Stock Holdings / Took some Profits

I sold the Technology ETF (XLK) in order to reduce stock holdings this morning. Markets still look shaky. Defensive holdings, like Utilities and Consumer Staples, are outperforming the S&P 500 today by a long shot. Further, XLK is no longer my top momentum play.


I only made about 1% in XLK, but the S&P 500 was flat over the same holding period so I can’t complain.


This brings my stock holdings to about 45% of the total portfolio.


Wednesday, August 18, 2021

FOMC Minutes ... Housing Starts / Housing Permits... EIA Crude Inventories … Coronavirus (Covid-19) … Stock Market Analysis … ETF Trading … Dow 30 Ranking

“Trade what you see; not what you think.” – The Old Fool, Richard McCranie, trader extraordinaire.


“People always ask me what is going on in the markets. It is simple. Greatest Speculative Bubble of All Time in All Things. By two orders of magnitude.” – Michael “Big Short” Burry.


It is economically absurd to believe more expensive energy, free childcare, free paid leave, free education for two years, and higher taxes won't increase inflation and slow growth.” – Mike “Mish” Shedlock.


FOMC MINUTES (Economic Times)

“Most participants judged that the Committee’s standard of ‘substantial further progress’ toward the maximum-employment goal had not yet been met,” minutes of the Federal Open Market Committee’s July 27-28 gathering released in Washington Wednesday said...Powell in his press conference following the July meeting said “the labor market has a ways to go,” a view expressed by several other officials since then.” Story at...

https://economictimes.indiatimes.com/markets/stocks/news/fed-minutes-show-most-officials-see-inflation-goal-in-hand/articleshow/85438416.cms


This article is probably more important than the minutes. Repeating from yesterday:

FED EYES TAPERING IN A FEW MONTHS (WSJ)

“Federal Reserve officials are nearing agreement to begin scaling back their easy money policies in about three months if the economic recovery continues...  this timetable...would enable them to raise interest rates sooner than currently anticipated if the economy makes rapid progress toward their goals.” Story at...

https://www.wsj.com/articles/fed-officials-weigh-ending-asset-purchases-by-mid-2022-11629106200


HOUSING STARTS / BUILDING PERMITS (Yahoo Finance / Reuters)

“U.S. homebuilding fell more than expected in July, the latest sign that surging construction costs and home prices continued to constrain the housing market early in the third quarter...the report from the Commerce Department on Wednesday showed a rebound in building permits last month, the increase was led by the volatile multi-family home segment, which will do little to ease an acute housing shortage... Housing starts dropped 7.0%...” Story at...

https://finance.yahoo.com/news/u-housing-starts-fall-sharply-124325984.html


EIA CRUDE INVENTORIES (Energy Information Administration)

“U.S. commercial crude oil inventories (excluding those in the Strategic Petroleum Reserve) decreased by 3.2 million barrels from the previous week. At 435.5 million barrels, U.S. crude oil inventories are about 6% below the five year average for this time of year.” Press release at...

https://ir.eia.gov/wpsr/wpsrsummary.pdf


CORONAVIRUS (NTSM)

Here’s the latest from the COVID19 Johns Hopkins website as of 5:30 PM Wednesday. U.S. total case numbers are on the left axis; daily numbers are on the right side of the graph in Red with the 10-dMA of daily numbers in Green.


MARKET REPORT / ANALYSIS

-Wednesday the S&P 500 fell about 1.1% to 4400.

-VIX rose about 20% to 21.57.

-The yield on the 10-year Treasury slipped to 1.262%.


Today, we had the third Hindenburg Omen in a row.  Clusters of Omens increase confidence in the signal and suggest more strongly that there is a pullback coming or underway. The last time we saw 3 in a row was about 2 weeks before the top of the 34% Coronavirus correction.  I do not expect a drop that big now.  A correction in the 7-10% range seems more likely. Of course, there’s no guarantee that we’re in a correction at all. (I discussed the definition of the Hindenburg Omen in Tuesday’s blog.)


We do note that the 50-dMA of stocks advancing on the NYSE was only 48.8%. Simply stated, this means that more than half of the issues on the NYSE have been down over the last 2-1/2 months. If we see another day less than 50%, I’d say the correction is here.


The daily sum of 20 Indicators declined from -8 to -12 (a positive number is bullish; negatives are bearish); the 10-day smoothed sum that smooths the daily fluctuations slipped from -37 to -40. (These numbers sometimes change after I post the blog based on data that comes in late.) Most of these indicators are short-term and many are trend following.


The Long Term NTSM indicator remained HOLD, but the VIX indicator gave a bear sign. VIX is one of my better indicators and a negative VIX indication is not a good sign. Price, Volume & Sentiment are neutral; VIX is bearish.  


Looks like we’re headed for a rough patch in the stock market. More bear signs would make me trim some stock holdings.


MOMENTUM ANALYSIS:

TODAY’S RANKING OF 15 ETFs (Ranked Daily)

The top ranked ETF receives 100%. The rest are then ranked based on their momentum relative to the leading

ETF.

*For additional background on the ETF ranking system see NTSM Page at…

http://navigatethestockmarket.blogspot.com/p/exchange-traded-funds-etf-ranking.html


TODAY’S RANKING OF THE DOW 30 STOCKS (Ranked Daily)

Here’s the revised DOW 30 and its momentum analysis. The top ranked stock receives 100%. The rest are then ranked based on their momentum relative to the leading stock.

For more details, see NTSM Page at…

https://navigatethestockmarket.blogspot.com/p/a-system-for-trading-dow-30-stocks-my_8.html


WEDNESDAY MARKET INTERNALS (NYSE DATA)


Market Internals remained BEARISH on the market.

Market Internals are a decent trend-following analysis of current market action, but should not be used alone for short term trading. They are usually right, but they are often late.  They are most useful when they diverge from the Index. 


Using the Short-term indicator in 2018 in SPY would have made a 5% gain instead of a 6% loss for buy-and-hold. The methodology was Buy on a POSITIVE indication and Sell on a NEGATIVE indication and stay out until the next POSITIVE indication. The back-test included 13-buys and 13-sells, or a trade every 2-weeks on average.  

My stock-allocation is about 50% invested in stocks. I am not super bullish (or bearish) and I am watching the markets closely.


You may wish to have a higher or lower % invested in stocks depending on your risk tolerance. 50% is a conservative position that I consider fully invested for most retirees. As a retiree, 50% in the stock market is about fully invested for me – it is a cautious and conservative number. If I feel very confident, I might go to 60%; if a correction is deep enough, and I can call a bottom, 80% would not be out of the question.