JOBLESS CLAIMS (Reuters)
“The number of Americans filing for unemployment benefits
rose modestly last week, suggesting sustained labor market strength that could
help to support the economy amid risks from the coronavirus and weak business
investment.” Story at…
PHILADELPHIA FED INDEX (Marketwatch)
“The Philadelphia Fed said Thursday its gauge of business
activity in its region surged in February to its highest level in three years. The regional Fed bank’s index jumped to 36.7 in
February from 17 in the prior month.” Story at…
MANUFACTURING RECESSION COULD BE OVER (CNBC)
“Production at American facilities fell in the second
half of 2019 despite an otherwise growing economy, sparking worries that a
broader recession might be in the works. But indicators this week from the key
Philadelphia and New York Federal Reserve districts showed a sharp rebound that
far exceeded Wall Street expectations.” Story at…
LEADING ECONOMIC INDICATORS (Conference Board)
“The Conference Board Leading Economic Index® (LEI) for
the U.S. increased 0.8 percent in January to 112.1 (2016 = 100), following a
0.3 percent decline in December and a 0.1 percent increase in November.
“The strong pickup in the January US LEI was driven by a
sharp drop in initial unemployment insurance claims, increasing housing
permits, consumers’ outlook on the economy and financial indicators,” said
Ataman Ozyildirim, Senior Director of Economic Research at The Conference
Board. “The LEI’s six-month growth rate has returned to positive territory,
suggesting that the current economic expansion – at about 2 percent – will
continue through early 2020. While weakness in manufacturing appears to show
signs of softening, the COVID-19 outbreak may impact manufacturing supply
chains in the US in the coming months.” Press release at…
EIA CRUDE INVENTORIES (fxStreet)
“The EIA has reported a build in US crude oil inventories
in the week ending February 14 of 414,000 barrels. Expectations stood at an
increase of 2.494 million. A lower increase in stored petrol is positive for
oil prices.” Story at…
MARKET REPORT / ANALYSIS
-Thursday the S&P 500 dipped about 0.4% to 3373.
-VIX rose about 8% to 15.56.
-The yield on the 10-year Treasury slipped to 1.518.
The daily sum of 20 Indicators declined from -4 to
-7 (a positive number is bullish; negatives are bearish). The 10-day smoothed
sum that negates the daily fluctuations declined from +19 to +11. (These
numbers sometimes change after I post the blog based on data that comes in
late.) Most of these indicators are short-term. They look very weak now.
Not much change in my guess: Based on the overstretched
S&P 500, I am still expecting another dip – not huge, but perhaps in the
5-10% zone. (It could always be worse if we get bad news.) On the other hand,
the Index may continue to climb until we see RSI and Bollinger Bands give
negative signs – that may not take too long. We’ll see.
TOP / BOTTOM INDICATOR SCALE OF 1 TO 10 (Zero is a neutral
reading.)
Today’s Reading: -1
Most Recent Day with a value other than Zero: -1 on 20
February (The S&P 500 was too far above its 200-dMA when sentiment is
considered.) Even without sentiment, the S&P 500 is 11% above its
200-dMA – that’s still high too.
(1) +10 Max Bullish / -10 Max Bearish)
(2) -4 or below is a Sell sign. +4 or higher is a Buy
Sign.
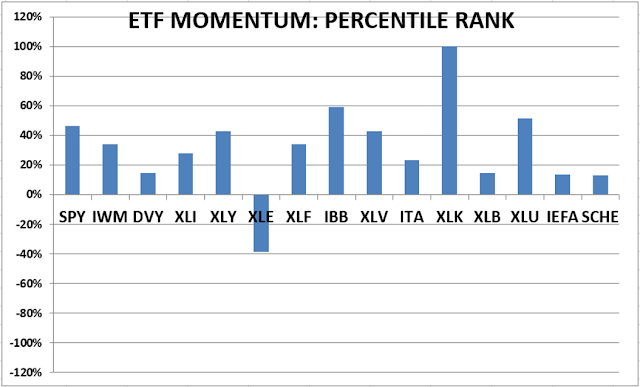
MOMENTUM ANALYSIS:
TODAY’S RANKING OF
15 ETFs (Ranked Daily)
*For additional background on the ETF ranking system see
NTSM Page at…
TODAY’S RANKING OF THE DOW 30 STOCKS (Ranked Daily)
The top ranked stock receives 100%. The rest are then
ranked based on their momentum relative to the leading stock.
For more details, see NTSM Page at…
THURSDAY MARKET INTERNALS (NYSE DATA)
Market Internals remained
NEUTRAL on the market.
Market Internals are a decent trend-following analysis of
current market action but should not be used alone for short term trading. They
are usually right, but they are often late.
They are most useful when they diverge from the Index. In 2014, using these internals alone would
have made a 9% return vs. 13% for the S&P 500 (in on Positive, out on
Negative – no shorting).
Using the Short-term indicator in 2018 in SPY would have
made a 5% gain instead of a 6% loss for buy-and-hold. The methodology was Buy
on a POSITIVE indication and Sell on a NEGATIVE indication and stay out until
the next POSITIVE indication. The back-test included 13-buys and 13-sells, or a
trade every 2-weeks on average.
My current stock allocation is about 45% invested in
stocks as of 27 January (down from 60%). This is a conservative position
appropriate for a retiree based on an overstretched S&P 500. You may wish
to have a higher or lower % invested in stocks depending on your risk
tolerance.
INTERMEDIATE / LONG-TERM INDICATOR
Thursday, the VOLUME, VIX, PRICE, and SENTIMENT
Indicators were neutral. The Long-Term Indicator remains HOLD.

