“Trade what you see; not what you think.” – The Old Fool,
Richard McCranie, trader extraordinaire.
HOUSING STARTS / BUILDING PERMITS (YahooFinance/Reuters))
“U.S. homebuilding unexpectedly fell in September and
permits dropped to a one-year low amid acute shortages of raw materials and
labor, strengthening expectations that economic growth slowed sharply in the
third quarter.” Story at...
https://finance.yahoo.com/news/u-housing-starts-permits-tumble-123711801.html
THE DISMAL TRUTH ABOUT THE CRUSADE AGAINST CLIMATE CHANGE
(ZeroHedge)
“Last week, Bank of America sparked a firestorm of
reaction amid both the pro and contra climate change camps...The bottom
line: no less than
a stunning $150 trillion in new capital investment would be required to reach a
"net zero" world over 30 years - equating to some $5 trillion in
annual investments - and amounting to twice current global GDP. Needless to
say, the private sector has nowhere near the capital required to complete this
investment which is why...the bill would have to be footed by central banks in
the form of tens of trillions in QE.” Story at...
My cmt: Spending such large sums by QE would lead to
massive inflation. In the climate change book, “Unsettled”, Steven Koonin, PhD,
concluded that a combination of strategies would be required: making smaller
reductions to CO2 outputs; adapting to the changed conditions; and, if
necessary, changing the reflectivity of the Earth. That last one seems like a
crazy idea, but it is technically the easiest. Putting additives in fuels would
reflect more sunlight and cool the planet. The problem is that some areas might
benefit, while others would be harmed. How would equity be achieved?
CORONAVIRUS (NTSM)
Here’s the latest from the COVID19 Johns Hopkins website as
of 4:30 PM Tuesday. U.S. total case numbers are on the left axis; daily numbers
are on the right side of the graph in Red with the 10-dMA of daily numbers in
Green. I added the smoothed 10-dMA of new cases (in purple) to the chart.
Almost 15% of the entire US population has had Covid.
MARKET REPORT / ANALYSIS
-Tuesday the S&P 500 rose about 0.7% to 4520.
-VIX dropped about 4% to 15.68.
-The yield on the 10-year Treasury rose to 1.663%.
I noted yesterday that I didn’t see any bear indicators
and that wouldn’t last long. Well, it didn’t.
Bollinger Bands are “overbought,” but without confirmation from RSI I usually don’t
pay attention to this indicator. It is
not surprising considering the level of bullishness the markets are
showing.
Today was the fifth day in a row that the S&P 500
finished in positive territory. That’s
unusual and a lot of bears got burned today betting on a down-day in the Rydex
funds I track for sentiment. On longer terms, the numbers are not particularly
bearish – 12-days have been up over the last 20-days; and 6-days have been up
over the last 10-days. Still, I would expect a down-day tomorrow.
The daily sum of 20 Indicators slipped from +10 to +6 (a
positive number is bullish; negatives are bearish); the 10-day smoothed sum
that smooths the daily fluctuations improved from +19 to +23 (These numbers
sometimes change after I post the blog based on data that comes in late.) Most
of these indicators are short-term and many are trend following.
The Long Term NTSM indicator
ensemble slipped to HOLD (but it was almost a buy). Volume is bullish; Price, VIX
and & Sentiment indicators are neutral.
I remain bullish.
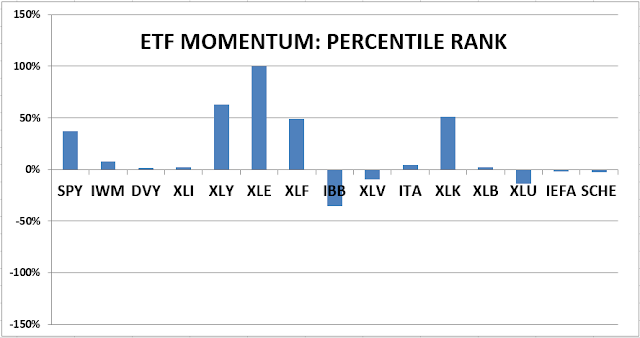
MOMENTUM ANALYSIS:
TODAY’S RANKING OF 15 ETFs
(Ranked Daily)
The top ranked ETF receives
100%. The rest are then ranked based on their momentum relative to the leading
ETF.
*For additional background on
the ETF ranking system see NTSM Page at…
http://navigatethestockmarket.blogspot.com/p/exchange-traded-funds-etf-ranking.html
TODAY’S RANKING OF THE DOW 30 STOCKS (Ranked Daily)
Here’s the revised DOW 30 and
its momentum analysis. The top ranked stock receives 100%. The rest are then
ranked based on their momentum relative to the leading stock.
For more details, see NTSM
Page at…
https://navigatethestockmarket.blogspot.com/p/a-system-for-trading-dow-30-stocks-my_8.html
TUESDAY MARKET INTERNALS (NYSE
DATA)
Market Internals remained BULLISH on the market.
Market Internals are a decent
trend-following analysis of current market action, but should not be used alone
for short term trading. They are usually right, but they are often late. They are most useful when they diverge from
the Index.
My stock-allocation in the portfolio is now about 65% invested in stocks; this is above my “normal” fully invested stock-allocation of 50% stocks. Indicators are very bullish, so I am taking a short-term position in additional stocks to boost returns.
You may wish to have a higher
or lower % invested in stocks depending on your risk tolerance. 50% is a
conservative position that I consider fully invested for most retirees.
As a general rule, some
suggest that the % of portfolio invested in the stock market should be one’s
age subtracted from 100. So, a
30-year-old person would have 70% of the portfolio in stocks, stock mutual
funds and/or stock ETFs. That’s ok, but
for older investors, I usually don’t recommend keeping less than 50% invested
in stocks (as a fully invested position) since most people need some growth in
the portfolio to keep up with inflation.


