Wednesday, September 8, 2021

FED Beige Book ... JOLTS – Job Openings ... Hysteria over 1 Degree of Global Warming … Coronavirus (Covid-19) … Stock Market Analysis … ETF Trading … Dow 30 Ranking

“Trade what you see; not what you think.” – The Old Fool, Richard McCranie, trader extraordinaire.


MASS HYSTERIA OVER 1 DEGREE OF WARMING (MishTalk – Gobal Economic Trend Analysis)

Global surface temperature was 1.09 [0.95 to 1.20] °C higher in 2011– 2020 than 1850–1900...The likely range of total human-caused global surface temperature increase from 1850–1900 to 2010–2019 is 0.8°C to 1.3°C, with a best estimate of 1.07°C.” - 2021 Summary for Policymakers (SPM), 14th session of Working Group I and 54th Session of the Intergovernmental Panel on Climate Change, subject to final copy-editing and layout.  

My cmt: Unbelievable! The hysteria is about 1.07°C??!!! Sadly, this is not a joke. See “Investigating the Mass Hysteria Over 1 Degree in Climate Change Since 1850” at...

https://mishtalk.com/economics/investigating-the-mass-hysteria-over-1-degree-in-climate-change-since-1850


FED BEIGE BOOK (CNBC)

“U.S. businesses are experiencing escalating inflation that is being aggravated by a shortage of goods and likely will be passed onto consumers in many areas, the Federal Reserve reported Wednesday... Rising inflation pressures are part of that picture in which a shortage of workers is being met by higher salaries.” Story at...

https://www.cnbc.com/2021/09/08/businesses-are-feeling-stronger-inflation-and-paying-higher-wages-feds-beige-book-says.html


JOLTS – JOB OPENINGS (Business Insider)

“Job openings in the US rose to a record high for the fifth consecutive month in July as demand for workers still outpaced hiring. Openings climbed to 10.9 million in July from 10.2 million, according to Job Openings and Labor Turnover Survey, or JOLTS, data published Wednesday... The available-worker-to-opening ratio fell to 0.8 in July, signaling there were more job listings than workers to fill them.” Story at...

https://www.businessinsider.com/jolts-job-openings-july-labor-market-hiring-worker-shortage-recovery-2021-9


CORONAVIRUS (NTSM)

Here’s the latest from the COVID19 Johns Hopkins website as of 6:30 PM Wednesday. U.S. total case numbers are on the left axis; daily numbers are on the right side of the graph in Red with the 10-dMA of daily numbers in Green.


The smoothed 10-dMA of new cases is still off its peak, so perhaps we have seen the worst of the Delta-varient.  That’s a scary comment though; I think I said the same thing early in the Covid pandemic. I suspect we may see another peak as Delta moves to other areas – hope I am wrong.


MARKET REPORT / ANALYSIS

-Wednesday the S&P 500 was down about 0.1% to 4514.

-VIX slipped about 1% to 17.96.

-The yield on the 10-year Treasury slipped to 1.344%.


I said yesterday that I didn’t see signs of a correction? I missed one yesterday and a few more popped up today.


Today, the 50-dMA of issues advancing on the NYSE was below 50% for the 2nd day in a row. (I missed it yesterday.) My “definition” of correction is the 50-dMA of advancing issues is less than 50% for 3 consecutive days. Let’s see what happens tomorrow. Of course, this signal warned 17-26 August and we didn’t see a correction then.  This is more of a follow-on to that weakness and is a concern if it does in fact stay below 50% for a third day.


The 10-dMA of issues advancing on the NYSE also dropped below 50% today suggesting the trend is down. The 40-dMA of new-highs is also suggesting a downtrend is in play. Other indicators are also trending down.


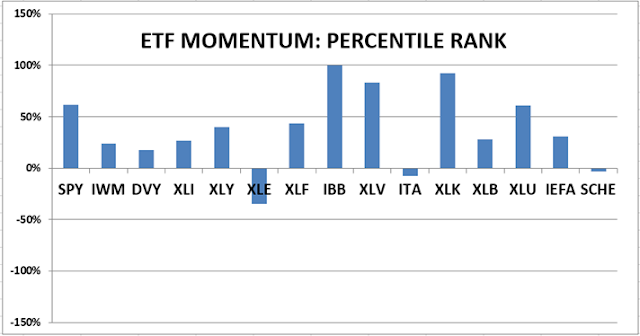
Investors bought Utilities (XLU-ETF) hard today. Utilities are the leading sector over the last 2 months! That’s a bearish sign.


The daily sum of 20 Indicators slipped from -2 to -7 (a positive number is bullish; negatives are bearish); the 10-day smoothed sum that smooths the daily fluctuations declined from -8 to -9. (These numbers sometimes change after I post the blog based on data that comes in late.) Most of these indicators are short-term and many are trend following.


The Long Term NTSM indicator ensemble remained HOLD. Volume, Price, VIX & Sentiment indicators are neutral. 


These indicators bounce around and aren’t enough for me to make portfolio changes yet. I am still cautiously bullish.  A top is coming, but not THE TOP.


MOMENTUM ANALYSIS:

TODAY’S RANKING OF 15 ETFs (Ranked Daily)

The top ranked ETF receives 100%. The rest are then ranked based on their momentum relative to the leading

ETF.

*For additional background on the ETF ranking system see NTSM Page at…

http://navigatethestockmarket.blogspot.com/p/exchange-traded-funds-etf-ranking.html


TODAY’S RANKING OF THE DOW 30 STOCKS (Ranked Daily)

Here’s the revised DOW 30 and its momentum analysis. The top ranked stock receives 100%. The rest are then ranked based on their momentum relative to the leading stock.

For more details, see NTSM Page at…

https://navigatethestockmarket.blogspot.com/p/a-system-for-trading-dow-30-stocks-my_8.html


WEDNESDAY MARKET INTERNALS (NYSE DATA)

Market Internals remained NEUTRAL on the market.


Market Internals are a decent trend-following analysis of current market action, but should not be used alone for short term trading. They are usually right, but they are often late.  They are most useful when they diverge from the Index. 


My stock-allocation is now about 50% invested in stocks; this is my “normal” 50% allocation.


You may wish to have a higher or lower % invested in stocks depending on your risk tolerance. 50% is a conservative position that I consider fully invested for most retirees.


As a general rule, some suggest that the % of portfolio invested in the stock market should be one’s age subtracted from 100.  So, a 30 year old person would have 70% of the portfolio in stocks, stock mutual funds and/or stock ETFs.  That’s ok, but for older investors, I usually don’t recommend keeping less than 50% invested in stocks (as a fully invested position) since most people need some growth in the portfolio to keep up with inflation.

Tuesday, September 7, 2021

Large Increase in EPS Estimates ... Untethered – Norhtman Trader … Ivermectin Bad reporting ... Coronavirus (Covid-19) … Stock Market Analysis … ETF Trading … Dow 30 Ranking

"Delta is reducing consumer demand and threatening the reopening, ultimately it's just a harsh reminder that the pandemic has control of our destiny," - Daniel Zhao, Senior Economist, Glassdoor.


LARGE INCREASE IN EPS (FACTSET)

“During the first two months of the third quarter, analysts increased earnings estimates for companies in the S&P 500 for the quarter. The Q3 bottom-up EPS estimate (which is an aggregation of the median EPS estimates for Q3 for all the companies in the index) increased by 3.8% (to $49.31 from $47.50) during this period...In fact, the third quarter marked the fourth-largest increase in the bottom-up EPS estimate during the first two months of a quarter since 2009. It also marked the fifth straight quarter in which the bottom-up EPS estimate increased during the first two months of the quarter.” Story at... 

https://insight.factset.com/fourth-largest-increase-in-eps-estimates-for-sp-500-companies-since-2009-for-q3


UNTETHERED (NorthmanTrader)

“The 5 EMA is such a regular magnet for markets that all history also teaches us that the farther markets move away from the 5 EMA, either to the downside or the upside, it tends to revert and reconnect [but now]...not only must markets make constant new highs, they can’t even afford a 5% pullback without breaking the uptrend which would invite all sorts of negative technical consequences and could change the current market landscape dramatically not necessarily staying confined to a mere 5% pullback. The only way for markets to avoid a trend break then is to continue to avoid all market history of monthly 5EMA reconnects. All of history. This is what investors must then count on. Best of luck.” Sven Henrich.  Commentary at...

https://northmantrader.com/2021/09/01/untethered/


SLOPPY BIASED CORONAVIRUS REPORTING (NPR)

“Joe Rogan, the mega-popular podcast host who has suggested that young, fit people don't need to get the COVID-19 vaccine, has announced he tested positive for the virus, but is feeling fine thanks to a cocktail of unproven medical treatments...Rogan added that his treatments also included monoclonal antibodies, Z-pack antibiotics and a vitamin drip for "three days in a row." Story at...

https://www.npr.org/2021/09/01/1033485152/joe-rogan-covid-ivermectin

My cmt: While NPR’s story criticized Rogan for taking Ivermectin and “unproven medical treatments”, they (and many other media sites) ignored the fact that Rogan said he took “monoclonal antibodies”. That is the Gold Standard for Covid treatment. It includes Regeneron Pharmaceuticals’ two-antibody combination REGN-COV2 and may have included Remdesivir from Gilead. Those drugs alone would have cured Rogan so the discussion of Ivermectin here is meaningless and is designed to send a message (Ivermectin is bad; Rogan is bad) rather than reporting the full story. NPR can no longer be trusted to present the news fairy.


The wackos on the other side also cited Rogan’s experience to tout Ivermectin as good. Here’s a clip from ZeroHedge (whose goal seems to be to create divisiveness on any subject they cover) where they completely left out the fact that Rogan got an antibody treatment. From ZeroHedge: "So we threw the kitchen sink at it, all kinds of meds,” Rogan said, adding that he took a Z-Pak (aka the antibiotic azithromycin), prednisolone (a corticosteroid used to treat inflammation) and Ivermectin, which is a drug used for decades to treat a wide variety of parasitic and other infections - and more recently, Covid.” Story at...

https://www.zerohedge.com/covid-19/i-feel-good-joe-rogan-contracts-covid-bounces-back-within-days-using-drug-cocktail

I don’t trust ZeroHedge and I would suggest that anyone reading ZeroHedge do a fact-check of any piece they publish.


CORONAVIRUS (NTSM)

Here’s the latest from the COVID19 Johns Hopkins website as of 5:30 PM Tuesday. U.S. total case numbers are on the left axis; daily numbers are on the right side of the graph in Red with the 10-dMA of daily numbers in Green.


The smoothed 10-dMA of new cases dropped a little today.  That may be due to under-reporting over the long weekend or perhaps new-cases really are dropping. New patients aren’t dropping in Richmond at my daughter’s hospital. They have patents in the halls and ICU patients backed up in the ER. Almost all new cases are unvaccinated.


MARKET REPORT / ANALYSIS

-Tuesday the S&P 500 was down about 0.3% to 4523.

-VIX rose about 7% to 17.5.

-The yield on the 10-year Treasury rose to 1.373%.


There were several articles about a coming correction mainly because some of the big banks turned more bearish.  The CNBC pundits all agreed – September is a bad month and they were more bearish in their discussions. Usually, when everyone thinks one thing will happen, it doesn’t. We’ll probably have a correction, but it won’t happen until the pundits have given up and gone bullish. In the meantime, we’ll be watching the signals to see if we can see it coming.  Now, I don’t see evidence of a correction.


The daily sum of 20 Indicators slipped from +1 to -2 (a positive number is bullish; negatives are bearish); the 10-day smoothed sum that smooths the daily fluctuations improved from -14 to -8. (These numbers sometimes change after I post the blog based on data that comes in late.) Most of these indicators are short-term and many are trend following.


The Long Term NTSM indicator ensemble remained HOLD. Volume, Price, VIX & Sentiment indicators are neutral.  


I am cautiously bullish.  A top is coming, but not THE TOP.


MOMENTUM ANALYSIS:

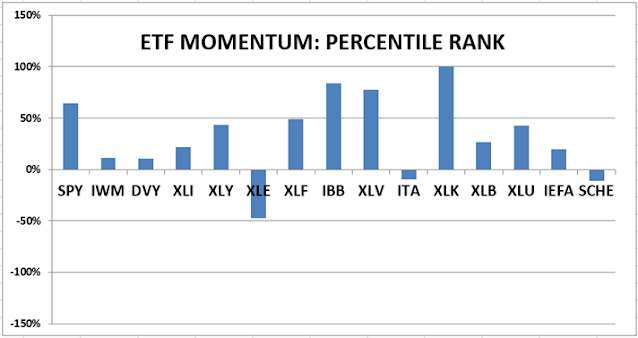
TODAY’S RANKING OF 15 ETFs (Ranked Daily)

The top ranked ETF receives 100%. The rest are then ranked based on their momentum relative to the leading

ETF.


*For additional background on the ETF ranking system see NTSM Page at…

http://navigatethestockmarket.blogspot.com/p/exchange-traded-funds-etf-ranking.html

TODAY’S RANKING OF THE DOW 30 STOCKS (Ranked Daily)

Here’s the revised DOW 30 and its momentum analysis. The top ranked stock receives 100%. The rest are then ranked based on their momentum relative to the leading stock.

For more details, see NTSM Page at…

https://navigatethestockmarket.blogspot.com/p/a-system-for-trading-dow-30-stocks-my_8.html


TUESDAY MARKET INTERNALS (NYSE DATA)

Market Internals slipped to NEUTRAL on the market.


Market Internals are a decent trend-following analysis of current market action, but should not be used alone for short term trading. They are usually right, but they are often late.  They are most useful when they diverge from the Index. 


My stock-allocation is now about 50% invested in stocks; this is my “normal” 50% allocation.


You may wish to have a higher or lower % invested in stocks depending on your risk tolerance. 50% is a conservative position that I consider fully invested for most retirees.


As a general rule, some suggest that the % of portfolio invested in the stock market should be one’s age subtracted from 100.  So a 30 year old person would have 70% of the portfolio in stocks, stock mutual funds and/or stock ETFs.  That’s ok, but for older investors, I usually don’t recommend keeping less than 50% invested in stocks (as a fully invested position) since most people need some growth in the portfolio to keep up with inflation.

Friday, September 3, 2021

Payroll Report ... Unemployment Rate … Coronavirus (Covid-19) … ISM Non-Manufacturing Index ... Stock Market Analysis … ETF Trading … Dow 30 Ranking

“People always ask me what is going on in the markets. It is simple. Greatest Speculative Bubble of All Time in All Things. By two orders of magnitude.” – Michael “Big Short” Burry.


"If I was Darth Vader and I wanted to destroy the US economy, I would do aggressive spending in the middle of an already hot economy...This is the biggest bubble I've seen in my career." - Stanley Druckenmiller, billionaire investor.


PAYROLL REPORT / (CNBC)

“Initial filings for unemployment insurance fell last week to their lowest levels since March 2020 in another sign that the labor market is gradually improving from the Covid-19 era, the Labor Department reported Thursday. First-time jobless claims totaled 340,000 for the week ended Aug. 28... The level of continuing claims, the measure of ongoing benefits, was 2.75 million, a decrease of 160,000...” Story at...

https://www.cnbc.com/2021/09/02/us-weekly-jobless-claims.html


PAYROLL REPORT / UNEMPLOYMENT RATE (YahooFinance)

“The U.S. economy added back jobs at a far slower pace in August following an early-summer jump in employment, as an initial wave of reopening hiring waned and concerns over the Delta variant increased.

-Change in non-farm payrolls: +235,000 vs. +733,000 expected and a revised +1.053 million in July

-Unemployment rate, August: 5.2% vs. 5.2% expected and 5.4% in July...” Story at...

https://finance.yahoo.com/news/august-jobs-report-nonfarm-payrolls-labor-department-coronavirus-194347179.html


ISM NON-MANUFACTURING INDEX (ISM via prnewswire)

"According to the Services PMI®, 17 services industries reported growth. The composite index indicated growth for the 15th consecutive month after a two-month contraction in April and May 2020. There was a pullback in the rate of expansion in the month of August; however, growth remains strong for the services sector. The tight labor market, materials shortages, inflation and logistics issues continue to cause capacity constraints," Press release at... 

https://www.prnewswire.com/news-releases/services-pmi-at-61-7-august-2021-services-ism-report-on-business-301368818.html


CORONAVIRUS (NTSM)

Here’s the latest from the COVID19 Johns Hopkins website as of 9:00 PM Friday. U.S. total case numbers are on the left axis; daily numbers are on the right side of the graph in Red with the 10-dMA of daily numbers in Green.


Same as yesterday, the smoothed 10-dMA of new cases rose to a new-high of over 160,000 cases today.  US numbers continue to climb sharply.


MARKET REPORT / ANALYSIS

-Friday the S&P 500 was down about 2pts to 4535.

-VIX was unchanged at 16.41.

-The yield on the 10-year Treasury rose to 1.326%.


The Friday run-down of some important indicators remains on the Bull side (5-bear and 14-bull) – a good sign for the bulls. These indicators tend to be both long-term and short-term, so they are different than the 20 that I report on daily. Details follow:


BULL SIGNS

-The 10-dMA % of issues advancing on the NYSE (Breadth) is above 50%.

-The 50-dMA % of issues advancing on the NYSE (Breadth) is above 50%.

-The 100-dMA of the % of issues advancing on the NYSE (Breadth) is above 50%.

-The 5-10-20 Timer System is BUY; the 5-dEMA and 10-dEMA are both above the 20-dEMA. 

-MACD of S&P 500 price made a bullish crossover, 25 August.

-McClellan Oscillator.

-The smoothed advancing volume on the NYSE is rising.

-MACD of the percentage of issues advancing on the NYSE (breadth) made a bullish crossover 27 August.

-Short-term new-high/new-low data is rising.

-Long-term new-high/new-low data is rising.

-My Money Trend indicator.

-There was a Follow-thru day on 27 Aug.  This cancels any prior Distribution days.

-Slope of the 40-dMA of New-highs is up. This is one of my favorite trend indicators.

-59% of the 15-ETFs that I track have been up over the last 10-days.


NEUTRAL

-Distribution Days.  There have been 2 in the last 25-days. Cancelled by FT Day.

-Bollinger Bands

-RSI.

-Statistically, the S&P 500 gave a panic-signal, 18 June, but the signal has expired.

-Non-crash Sentiment indicator remains neutral, but it is very bullish and that means the signal is leaning bearish.

-The Fosback High-Low Logic Index is neutral.

-VIX.

-The size of up-moves has been smaller than the size of down-moves over the last month, but not enough to give a signal.

-29 July, the 52-week, New-high/new-low ratio improved by 0.4 standard deviations, somewhat bullish, but neutral.

-There have been 4 Statistically-Significant days in the last 15-days. This can be a bull or bear signal. 4 is neutral. 

-The S&P 500 is 11.6% above its 200-dMA (Bear indicator is 12%.). This value was 15.9% above the 200-dMA when the 10% correction occurred in Sep 2020.

-There were 5 Hindenburg Omen signals 16-23 Aug.  The McClellan Oscillator turned positive so the Omens have been cancelled.

-7.7% of all issues traded on the NYSE made new, 52-week highs when the S&P 500 made a new all-time-high 2 September. (There is no bullish signal for this indicator.) This is above the average for all-time highs.

-There have been 14 up-days over the last 20 days. Neutral

-There have been 7 up-days over the last 10-days. Neutral


BEAR SIGNS

-Overbought/Oversold Index (Advance/Decline Ratio) is overbought.

-Breadth on the NYSE compared to the S&P 500 index is bearish.

-Cyclical Industrials (XLI-ETF) have been under-performing the S&P 500 recently.

-The S&P 500 is under-performing the Utilities ETF (XLU).

-The Smart Money (late-day action) indicates the Pros are selling. (This indicator is based on the Smart Money Indicator developed by Don Hayes).


On Friday, 21 February, 2 days after the top of the Coronavirus pullback, there were 10 bear-signs and 1 bull-sign. Now there are 5 bear-signs and 14 bull-signs. Last week, there were 7 bear-signs and 10 bull-signs.


The daily sum of 20 Indicators slipped from +4 to +1(a positive number is bullish; negatives are bearish); the 10-day smoothed sum that smooths the daily fluctuations improved from -25 to -14. (These numbers sometimes change after I post the blog based on data that comes in late.) Most of these indicators are short-term and many are trend following.


The Long Term NTSM indicator ensemble remained HOLD. Volume, Price, VIX & Sentiment indicators are neutral.  


I am cautiously bullish.  A top is coming, but not THE TOP.


MOMENTUM ANALYSIS:

TODAY’S RANKING OF 15 ETFs (Ranked Daily)

The top ranked ETF receives 100%. The rest are then ranked based on their momentum relative to the leading

ETF.

*For additional background on the ETF ranking system see NTSM Page at…

http://navigatethestockmarket.blogspot.com/p/exchange-traded-funds-etf-ranking.html


TODAY’S RANKING OF THE DOW 30 STOCKS (Ranked Daily)

Here’s the revised DOW 30 and its momentum analysis. The top ranked stock receives 100%. The rest are then ranked based on their momentum relative to the leading stock.

For more details, see NTSM Page at…

https://navigatethestockmarket.blogspot.com/p/a-system-for-trading-dow-30-stocks-my_8.html


FRIDAY MARKET INTERNALS (NYSE DATA)

Market Internals remained BULLISH on the market.


Market Internals are a decent trend-following analysis of current market action, but should not be used alone for short term trading. They are usually right, but they are often late.  They are most useful when they diverge from the Index. 


My stock-allocation is now about 50% invested in stocks; this is my “normal” 50% allocation.


You may wish to have a higher or lower % invested in stocks depending on your risk tolerance. 50% is a conservative position that I consider fully invested for most retirees.


As a general rule, some suggest that the % of portfolio invested in the stock market should be one’s age subtracted from 100.  So a 30 year old person would have 70% of the portfolio in stocks, stock mutual funds and/or stock ETFs.  That’s ok, but I usually don’t recommend keeping less than 50% invested in stocks (as a fully invested position) since most people need some growth in the portfolio to keep up with inflation.

Thursday, September 2, 2021

Jobless Claims ... Factory Orders ... Social Security to Run Out of Funds … Coronavirus (Covid-19) … Stock Market Analysis … ETF Trading … Dow 30 Ranking

“Trade what you see; not what you think.” – The Old Fool, Richard McCranie, trader extraordinaire.


JOBLESS CLAIMS (Reuters)

“The number of Americans filing new claims for jobless benefits fell last week, while layoffs dropped to their lowest level in more than 24 years in August, suggesting the labor market was charging ahead even as new COVID-19 infections surge... Initial claims for state unemployment benefits dropped 14,000 to a seasonally adjusted 340,000 for the week ended Aug. 28, the lowest level since mid-March 2020...” Story at...

https://www.reuters.com/business/us-weekly-jobless-claims-fall-layoffs-24-year-low-2021-09-02/


FACTORY ORDERS (KFGO)

“New orders for U.S.-made goods rose in July, while business spending on equipment remained strong, signs that manufacturing was holding up despite persistent supply constraints and spending rotating back to services from goods. The Commerce Department said on Thursday that factory orders increased 0.4% in July...” Story at...

https://kfgo.com/2021/09/02/u-s-factory-orders-increase-in-july-despite-supply-constraints/


SOCIAL SECURITY TRUST FUND TO RUN OUT SOONER (CNBC)

“The Social Security trust fund most Americans rely on for their retirement will run out of money in 12 years, one year sooner than expected, according to an annual government report published Tuesday....Medicare’s hospital insurance fund would be depleted in 2026.” Story At...

https://www.cnbc.com/2021/08/31/social-security-trust-funds-set-to-be-depleted-sooner-than-expected.html

My cmt: Trump didn’t address this problem; will the Biden administration? We’ll see.


CORONAVIRUS (NTSM)

Here’s the latest from the COVID19 Johns Hopkins website as of 6:00 PM Thursday. U.S. total case numbers are on the left axis; daily numbers are on the right side of the graph in Red with the 10-dMA of daily numbers in Green.


Same as yesterday, the smoothed 10-dMA of new cases rose to a new-high of over 155,000 cases today.  I don’t see the improvement reported by the media. They were saying the new-case load is falling in hot-spot locations.  Maybe, but cases must be picking up elsewhere, because (so far) overall US numbers continue to climb.


MARKET REPORT / ANALYSIS

-Thursday the S&P 500 was up about 0.3% to 4537.

-VIX slipped about 2% to 16.41.

-The yield on the 10-year Treasury slipped to 1.289%.


Today, Thursday, the S&P 500 made a new all-time high today while 7.7% of issues on the NYSE made new-52-week highs. That’s a little above average for 52-week-highs when the Index makes a new high – that’s a good sign that the advance is reasonably broad.  If we were to have a pullback, it suggests that the drop would be less than 10%.


Thursday, we saw a repeat of yesterday’s divergence between utilities, cyclicals and the S&P 500 Index. Investors were buying utilities today. In the longer term, utilities (XLU-ETF) are outperforming the S&P 500.  The cyclical industrials (XLI-ETF) are underperforming the S&P 500. Both are bearish signs.


Otherwise, Indicators have moved into bullish territory and I don’t have many topping indicators that are warning.


The daily sum of 20 Indicators remained +4 (a positive number is bullish; negatives are bearish); the 10-day smoothed sum that smooths the daily fluctuations improved from -42 to -25. (These numbers sometimes change after I post the blog based on data that comes in late.) Most of these indicators are short-term and many are trend following.


The Long Term NTSM indicator ensemble remained HOLD. Volume is bullish; Price, VIX & Sentiment indicators are neutral.  


I am cautiously bullish.  A top is coming, but not THE TOP.


MOMENTUM ANALYSIS:

TODAY’S RANKING OF 15 ETFs (Ranked Daily)

The top ranked ETF receives 100%. The rest are then ranked based on their momentum relative to the leading

ETF.

*For additional background on the ETF ranking system see NTSM Page at…

http://navigatethestockmarket.blogspot.com/p/exchange-traded-funds-etf-ranking.html


TODAY’S RANKING OF THE DOW 30 STOCKS (Ranked Daily)

Here’s the revised DOW 30 and its momentum analysis. The top ranked stock receives 100%. The rest are then ranked based on their momentum relative to the leading stock.

For more details, see NTSM Page at…

https://navigatethestockmarket.blogspot.com/p/a-system-for-trading-dow-30-stocks-my_8.html


THURSDAY MARKET INTERNALS (NYSE DATA)

Market Internals remained BULLISH on the market.


Market Internals are a decent trend-following analysis of current market action, but should not be used alone for short term trading. They are usually right, but they are often late.  They are most useful when they diverge from the Index. 


My stock-allocation is now about 50% invested in stocks; this is my “normal” 50% allocation.


You may wish to have a higher or lower % invested in stocks depending on your risk tolerance. 50% is a conservative position that I consider fully invested for most retirees.


As a general rule, some suggest that the % of portfolio invested in the stock market should be one’s age subtracted from 100.  So a 30 year old person would have 70% of the portfolio in stocks, stock mutual funds and/or stock ETFs.  That’s ok, but I usually don’t recommend keeping less than 50% invested in stocks (as a fully invested position) since most people need some growth in the portfolio to keep up with inflation.

Wednesday, September 1, 2021

ADP employment ... IHS Markit Manufacturing PMI ... Crude Inventories … Ivermectin ... Coronavirus (Covid-19) … Stock Market Analysis … ETF Trading … Dow 30 Ranking

“President Biden’s defiant, accusatory defense on Tuesday of his Afghanistan withdrawal and its execution was so dishonest, and so lacking in self-reflection or accountability, that it was unworthy of the sacrifices Americans have made in that conflict.” – WSJ Editorial.

https://www.wsj.com/articles/a-dishonest-afghan-accounting-joe-biden-speech-taliban-afghanistan-withdrawal-20-year-war-11630448010


ADP EMPLOYMENT CHANGE (Yaho Finance)

“Private sector employment increased by 374,000 jobs from July to August according to the August ADP® National Employment Report™..."Our data, which represents all workers on a company's payroll, has highlighted a downshift in the labor market recovery. We have seen a decline in new hires, following significant job growth from the first half of the year," said Nela Richardson, chief economist, ADP. "Despite the slowdown, job gains are approaching 4 million this year, yet still 7 million jobs short of pre-COVID-19 levels.”  Story at... 

https://finance.yahoo.com/news/adp-national-employment-report-private-121500166.html


IHS MARKIT MANUFACTURING PMI (Morningstar News)

“Activity in the U.S. manufacturing sector slowed in August as strong demand for goods met with persistent capacity constraints and material shortages that constrained output growth. The final reading for the U.S. Manufacturing Business Activity PMI for August came in at 61.1..” Story at...

https://www.morningstar.com/news/dow-jones/202109017654/us-manufacturing-activity-softened-in-august-ihs-markit


CONSTRUCTION SPENDING (Business Times)

“US construction spending picked up in July, lifted by gains in both private and public sector projects...Construction spending rose 9.0 per cent on a year-on-year basis in July.” Story at...

https://www.businesstimes.com.sg/real-estate/construction-spending-rises-in-july-amid-abroad-gains


EIA CRUDE INVENTORIES (EIA)

“U.S. commercial crude oil inventories (excluding those in the Strategic Petroleum Reserve) decreased by 7.2 million barrels from the previous week. At 425.4 million barrels, U.S. crude oil inventories are about 6% below the five year average for this time of year.” Press release at...

https://ir.eia.gov/wpsr/wpsrsummary.pdf


USING A LIVESTOCK DEWORMING DRUG TO TREAT COVID (WFLA)

“Using Ivermectin for COVID is not recommended by the FDA and isn’t proven to be effective...Leah Ward Winchester, who has studied the drug’s connection to COVID...cites ongoing studies conducted to determine how effective the drug is against COVID. But these studies are being done with the proper doses and ingredients meant for humans, not things found in farm stores.” Story at...

https://www.wfla.com/community/health/coronavirus/some-people-are-using-livestock-deworming-drug-to-treat-covid-19/

My cmt: My niece is a veterinary PA.  She can’t get this drug for her practice due to panic buying by people using it for Covid. Don’t use the veterinary version of this medicine! The jury is still out, but see the following piece.


IVERMECTIN FOR PREVENTION AND TREATMENT OF COVID-19 INFECTION (American Journal of Therapeutics)

“The antiparasitic ivermectin, with antiviral and anti-inflammatory properties, has now been tested in numerous clinical trials...Moderate-certainty evidence finds that large reductions in COVID-19 deaths are possible using ivermectin. Using ivermectin early in the clinical course may reduce numbers progressing to severe disease. The apparent safety and low cost suggest that ivermectin is likely to have a significant impact on the SARS-CoV-2 pandemic globally...Ivermectin is likely to be an equitable, acceptable, and feasible global intervention against COVID-19. Health professionals should strongly consider its use, in both treatment and prophylaxis.” Journal paper at...

https://journals.lww.com/americantherapeutics/fulltext/2021/08000/ivermectin_for_prevention_and_treatment_of.7.aspx


CORONAVIRUS (NTSM)

Here’s the latest from the COVID19 Johns Hopkins website as of 6:00 PM Wednesday. U.S. total case numbers are on the left axis; daily numbers are on the right side of the graph in Red with the 10-dMA of daily numbers in Green.


The smoothed 10-dMA of new cases rose to a new-high of over 150,000 cases today.  I don’t see the improvement reported by the media. They were saying the new-case load is falling in hot-spot locations.  Maybe, but cases must be picking up elsewhere, because overall US numbers continue to climb.


MARKET REPORT / ANALYSIS

-Wednesday the S&P 500 was up about 1pt to 4524.

-VIX slipped about 0.4% to 16.11.

-The yield on the 10-year Treasury slipped to 1.300%.


One of the simplest indicators is to count how many up-days occur on a given index over varying timeframes. I keep track of this over 10 and 20-day periods for the S&P 500.  Currently, both have reached their upper limits. We’ve seen 15 up-days over the last 20-days and 8 up-days over the last 10-days. If either of those numbers get higher, it would send a bearish signal. It would take 3 more consecutive up-days to flip the 20-day and even more to flip the 10-day value. That’s because in a moving average, the last value (in this case 10 or 20 days ago) is dropped and the latest value is added. If the last value is an up-day and the latest value is an up-day, there is no change on the overall number. As it is, these indicators are mildly bearish and suggest a down-day for tomorrow.


Investors were buying utilities today. In the longer term, utilities (XLU-ETF) are outperforming the S&P 500.  The cyclical industrials (XLI-ETF) are underperforming the S&P 500. Both are bearish signs.


Otherwise, Indicators continue to improve slowly.


The daily sum of 20 Indicators improved from +2 to +4 (a positive number is bullish; negatives are bearish); the 10-day smoothed sum that smooths the daily fluctuations improved from -58 to -42. (These numbers sometimes change after I post the blog based on data that comes in late.) Most of these indicators are short-term and many are trend following.


The Long Term NTSM indicator ensemble remained HOLD. Volume is bullish; Price, VIX & Sentiment indicators are neutral.  


I am cautiously bullish.  A top is coming, but not THE TOP.


MOMENTUM ANALYSIS:

TODAY’S RANKING OF 15 ETFs (Ranked Daily)

The top ranked ETF receives 100%. The rest are then ranked based on their momentum relative to the leading

ETF.


*For additional background on the ETF ranking system see NTSM Page at…

http://navigatethestockmarket.blogspot.com/p/exchange-traded-funds-etf-ranking.html


TODAY’S RANKING OF THE DOW 30 STOCKS (Ranked Daily)

Here’s the revised DOW 30 and its momentum analysis. The top ranked stock receives 100%. The rest are then ranked based on their momentum relative to the leading stock.


For more details, see NTSM Page at…

https://navigatethestockmarket.blogspot.com/p/a-system-for-trading-dow-30-stocks-my_8.html


WEDNESDAY MARKET INTERNALS (NYSE DATA)

Market Internals remained BULLISH on the market.


Market Internals are a decent trend-following analysis of current market action, but should not be used alone for short term trading. They are usually right, but they are often late.  They are most useful when they diverge from the Index. 


My stock-allocation is now about 50% invested in stocks; this is my “normal” 50% allocation.


You may wish to have a higher or lower % invested in stocks depending on your risk tolerance. 50% is a conservative position that I consider fully invested for most retirees.


As a general rule, some suggest that the % of portfolio invested in the stock market should be one’s age subtracted from 100.  So a 30 year old person would have 70% of the portfolio in stocks, stock mutual funds and/or stock ETFs.  That’s ok, but I usually don’t recommend keeping less than 50% invested in stocks (as a fully invested position) since most people need some growth in the portfolio to keep up with inflation.