Thursday, January 19, 2023

Jobless Claims ... Philadelphia Fed Index ... EIA Crude Inventories ... Housing starts ... Momentum Trading DOW Stocks & ETFs … Stock Market Analysis ...

 “Trade what you see; not what you think.” – The Old Fool, Richard McCranie, trader extraordinaire.
 
JOBLESS CLAIMS (CNBC)
“The number of Americans filing new claims for unemployment benefits unexpectedly fell last week, suggesting the labor market remains tight despite higher interest rates. Initial claims for state unemployment benefits dropped 15,000 to a seasonally adjusted 190,000 for the week ended Jan. 14...” Story at...
https://www.cnbc.com/2023/01/19/us-weekly-jobless-claims-unexpectedly-fall.html
 
HOUSING STARTS (YahooFinance)
“Housing starts dropped further in December to 1.38 million, down 1.4% from revised November 2022 estimate and down 21.8% from December 2021, according to the U.S. Census Bureau.” Story at...
https://finance.yahoo.com/news/december-housing-starts-homebuilding-activity-141424684.html
 
PHILADLEPHIA FED INDEX (Investing.com)
“The Philadelphia Federal Reserve's manufacturing index rose modestly for a second straight month, to -8.9 from an upwardly revised level of -13.7 in December. While the index level is still low by historical standards, it contrasts starkly with a plunge in the analogous index published earlier in the week by the New York Fed.” Story at...
https://www.investing.com/news/economic-indicators/philly-fed-manufacturing-index-rose-in-january-but-activity-still-contracted-2983961
 
EIA CRUDE OIL INVENTORIES (EIA)
“U.S. commercial crude oil inventories (excluding those in the Strategic Petroleum Reserve) increased by 8.4 million barrels from the previous week. At 448.0 million barrels, U.S. crude oil inventories are about 3% above the five year average for this time of year.” Story at...
https://ir.eia.gov/wpsr/wpsrsummary.pdf
 
MARKET REPORT / ANALYSIS
-Thursday the S&P 500 fell about 0.8% to 3899.
-VIX rose about 0.9% to 20.52.
-The yield on the 10-year Treasury rose to 3.405%.
 
PULLBACK DATA:
-Drop from Top: 18.7% as of today. 25.4% max (on a closing basis).
-Trading Days since Top: 262-days.
The S&P 500 is 1.8% BELOW its 200-dMA & 0.7% BELOW its 50-dMA.
*I won’t call the correction over until the S&P 500 makes a new-high; however, evidence suggests the bottom was in the 3600 area.
 
MY TRADING POSITIONS:
I am doing less trading now. You may do better watching the momentum charts rather than my moves.
XLK – Technology ETF.
SSO – 2x S&P 500.
XLE – Energy Sector ETF. Low PE; good Dividend; decent momentum.
BA – (Boeing) I am late on this one, but we’ll see.
XLY - Consumer Discretionary ETF.
 
SHY – Short term bonds. 30-day yield is 4.2%. (Trailing 1-year yield is 1.3%.) I’ll hold this, but if the market retests the lows, I’ll sell it and buy stocks.)
 
TODAY’S COMMENT:
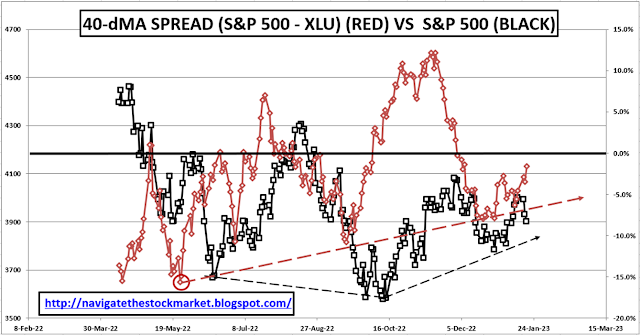
I noted that on Wednesday, spreads were bullish when we compare Utilities, Consumer Staples and Consumer Discretionary sectors of the market to the S&P 500. Today that wasn’t the case, so let’s look at a longer-term indicator for Utilities vs the S&P 500. The chart below is constructed so that if the spread (red line) is below zero, Utilities are outpacing the S&P 500. That’s a bearish indication, but the slope of the curve is up. That suggests improvement in a bullish direction, i.e., the S&P 500 has been advancing faster than Utilities. Overall, that suggests I need to be patient and stay fully invested for a while longer.
 
The A/D (Advance / Decline) Ratio remained overbought today, so we may not have seen the end of selling. I still don’t expect too much downside, but we’ll see. It’s all up to the earnings now as earnings season is underway.
 
Today, the daily sum of 20 Indicators fell from +7 to +1 (a positive number is bullish; negatives are bearish); the 10-day smoothed sum that smooths the daily fluctuations decreased from +117 to 106. (The trend direction is more important than the actual number for the 10-day value.) These numbers sometimes change after I post the blog based on data that comes in late. Most of these 20 indicators are short-term so they tend to bounce around a lot.
 
LONG-TERM INDICATOR: The Long Term NTSM indicator declined to HOLD: PRICE is positive. VOLUME, VIX & SENTIMENT are neutral.
(The important BUY in this indicator was on 21 October, 7-days after the bottom. My NTSM buy-signal was 27 September, based on improved internals at the retest low, about 2% before the bottom.)
 
Bottom line: I’m a BULL, but I am watching indicators closely. I am over-invested in the markets.
I now have about 75% of the portfolio invested in stocks. (As a retiree, 50% invested in stocks is my “normal” portfolio.) As the rally ages, I’ll cut back toward a 50% stock allocation more suitable for my status as a retiree.
 
BEST ETFs - MOMENTUM ANALYSIS:
TODAY’S RANKING OF 15 ETFs (Ranked Daily)
ETF ranking follows:

The top ranked ETF receives 100%. The rest are then ranked based on their momentum relative to the leading ETF.
*For additional background on the ETF ranking system see NTSM Page at…
http://navigatethestockmarket.blogspot.com/p/exchange-traded-funds-etf-ranking.html
 
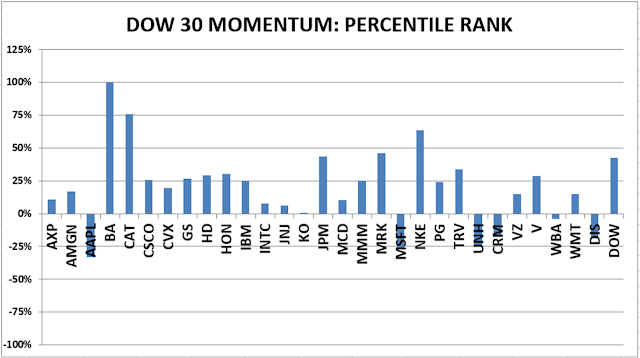
BEST DOW STOCKS - TODAY’S MOMENTUM RANKING OF THE DOW 30 STOCKS (Ranked Daily)
DOW 30 momentum ranking follows:

The top ranked Stock receives 100%. The rest are then ranked based on their momentum relative to the leading Stock.
For more details, see NTSM Page at…
https://navigatethestockmarket.blogspot.com/p/a-system-for-trading-dow-30-stocks-my_8.html
 
THURSDAY MARKET INTERNALS (NYSE DATA)
My basket of Market Internals remained HOLD.
(Market Internals are a decent trend-following analysis of current market action, but should not be used alone for short term trading. They are most useful when they diverge from the Index.) 
 
 
...My current invested position is about 75% stocks, including stock mutual funds and ETFs. I’m usually about 50% invested in stocks.
 
I trade about 15-20% of the total portfolio using the momentum-based analysis I provide here. If I can see a definitive bottom, I’ll add a lot more stocks to the portfolio using an S&P 500 ETF.

Wednesday, January 18, 2023

Fed Beige Book ... PPI ... Retail Sales ... Industrial Production ... Best DOW Stocks ... Best ETFs … Stock Market Analysis ...

 “Trade what you see; not what you think.” – The Old Fool, Richard McCranie, trader extraordinaire.
 
FED BEIGE BOOK (US News)
“The summary of conditions will do little to change the Fed’s current plans calling for additional interest rate hikes this year, with one pegged for Jan. 31-Feb. 1 when its monetary policy committee meets...Much of the summary confirms other accounts that residential real estate activity is weak, the labor market remains strong, and that inflation has slowed...“On balance, contacts across districts said they expected future price growth to moderate further in the year ahead,” the survey said.” Story at...
https://www.usnews.com/news/economy/articles/2023-01-18/feds-beige-book-finds-economy-holding-steady-with-little-growth-expected-in-the-coming-months
 
PPI (CNBC)
“Prices for wholesale goods and services fell sharply in December, providing another sign that inflation, while still high, is beginning to ease.
The producer price index, which measures final demand prices across hundreds of categories, declined 0.5% for the month...” Story at...
https://www.cnbc.com/2023/01/18/wholesale-prices-fell-0point5percent-in-december-much-more-than-expected.html
 
RETAIL SALES (CNN News)
“US retail sales continued their fall in December, dropping by 1.1% as inflation remained high, the Commerce Department reported Wednesday. That’s the largest monthly decline since December 2021...” Story at...
https://www.cnn.com/2023/01/18/economy/retail-sales-december/index.html
 
INDUSTRIAL PRODUCTION (News Max)”
"Production at U.S. factories fell more than expected in December and output in the prior month was weaker than previously thought, indicating that manufacturing was rapidly losing momentum as higher borrowing costs hurt demand for goods. Manufacturing output dropped 1.3% last month...” Story at...
https://www.newsmax.com/finance/streettalk/u-s-manufacturing/2023/01/18/id/1104885/
 
MARKET REPORT / ANALYSIS
-Wednesday the S&P 500 fell about 1.6% to 3929.
-VIX rose about 5% to 20.34.
-The yield on the 10-year Treasury fell to 3.373%.
 
PULLBACK DATA:
-Drop from Top: 18.1% as of today. 25.4% max (on a closing basis).
-Trading Days since Top: 261-days.
The S&P 500 is 1.2% BELOW its 200-dMA & 0.1% ABOVE its 50-dMA.
*I won’t call the correction over until the S&P 500 makes a new-high; however, evidence suggests the bottom was in the 3600 area.
 
MY TRADING POSITIONS:
I am doing less trading now. You may do better watching the momentum charts rather than my moves.
XLK – Technology ETF.
SSO – 2x S&P 500. (My indicators are improving.)
XLE – Energy Sector ETF. Low PE; good Dividend; decent momentum.
BA – (Boeing) I am late on this one, but we’ll see.
XLY - Consumer Discretionary ETF.
 
SHY – Short term bonds. 30-day yield is 4.2%. (Trailing 1-year yield is 1.3%.) I’ll hold this, but if the market retests the lows, I’ll sell it and buy stocks.)
 
TODAY’S COMMENT:
I noted yesterday that the A/D (Advance / Decline) Ratio was overbought and some weakness would not be a surprise.  Today, we got the weakness.
 
Divergence spreads today were actually bullish when we compare them to the S&P 500 loss (1.6%). Utilities sold off hard (down 2.4%). Consumer Staples were also down a lot (2.7%) while Consumer Discretionary was down only 1.3%. All of these spreads are the opposite of what we would expect if investors were worried about a coming recession. One could argue that Utilities would sell off in expectations of higher interest rates, but that wouldn’t explain why Consumer Staples would be down so much. So, while Melissa Lee on CNBC was calling the end of the rally, these spreads don’t seem to support that argument.  I guess we’ll know soon enough if stocks continue to fall hard.
 
The S&P 500 is still overbought on the A/D Ratio so we could see further weakness, but I still don’t expect too much downside. It’s all up to the earnings now as earnings season is underway.
 
Today, the daily sum of 20 Indicators fell from +14 to +7 (a positive number is bullish; negatives are bearish); the 10-day smoothed sum that smooths the daily fluctuations decreased from +121 to 117. (The trend direction is more important than the actual number for the 10-day value.) These numbers sometimes change after I post the blog based on data that comes in late. Most of these 20 indicators are short-term so they tend to bounce around a lot.
 
LONG-TERM INDICATOR: The Long Term NTSM indicator remained BUY: VOLUME, PRICE & SENTIMENT are all positive.  VIX is neutral.
(The important BUY in this indicator was on 21 October, 7-days after the bottom. My NTSM buy-signal was 27 September, based on improved internals at the retest low, about 2% before the bottom.)
 
Bottom line: I’m a BULL. I am over-invested in the markets.
I now have about 75% of the portfolio invested in stocks. (As a retiree, 50% invested in stocks is my “normal” portfolio.) As the rally ages, I’ll cut back toward a 50% stock allocation more suitable for my status as a retiree.
 
BEST ETFs - MOMENTUM ANALYSIS:
TODAY’S RANKING OF 15 ETFs (Ranked Daily)
ETF ranking follows:

The top ranked ETF receives 100%. The rest are then ranked based on their momentum relative to the leading ETF.
*For additional background on the ETF ranking system see NTSM Page at…
http://navigatethestockmarket.blogspot.com/p/exchange-traded-funds-etf-ranking.html
 
BEST DOW STOCKS - TODAY’S MOMENTUM RANKING OF THE DOW 30 STOCKS (Ranked Daily)
DOW 30 momentum ranking follows:

The top ranked Stock receives 100%. The rest are then ranked based on their momentum relative to the leading Stock.
For more details, see NTSM Page at…
https://navigatethestockmarket.blogspot.com/p/a-system-for-trading-dow-30-stocks-my_8.html
 
WEDNESDAY MARKET INTERNALS (NYSE DATA)
My basket of Market Internals slipped to HOLD.
(Market Internals are a decent trend-following analysis of current market action, but should not be used alone for short term trading. They are most useful when they diverge from the Index.) 
 
 
...My current invested position is about 75% stocks, including stock mutual funds and ETFs. I’m usually about 50% invested in stocks.
 
I trade about 15-20% of the total portfolio using the momentum-based analysis I provide here. If I can see a definitive bottom, I’ll add a lot more stocks to the portfolio using an S&P 500 ETF.

Tuesday, January 17, 2023

Empire State Manufacturing ... Best DOW Stocks ... Best ETFs … Stock Market Analysis ...

 “Trade what you see; not what you think.” – The Old Fool, Richard McCranie, trader extraordinaire.
 
EMPIRE STATE MANUFACTURING (Reuters)
“New York state manufacturing contracted sharply in January as orders collapsed and employment growth stalled, pointing to continued weakness in national factory activity, and little improvement was expected over the next six months...The New York Fed's "Empire State" index on current business conditions plummeted to -32.9 this month from -11.2 in December. That was the lowest level since May 2020 and the fifth worst reading in the survey's history.” Story at...
https://www.reuters.com/markets/us/new-york-state-manufacturing-collapses-monthly-survey-2023-01-17/
My cmt: Economists expected the contraction to slowdown, instead it accelerated.
 
STOCK MARKET LEGEND ISSUES BEAR WARNING (Fox Business)
“While [Peter Eliades] the Stockmarket Cycles publisher and editor was bullish [in October], he said on "Cavuto: Coast to Coast" Monday that he’s returning to his cage. "I'm returning to my cage again," Eliades told Cavuto. "I'm going to be called a vicious and ferocious growling bear."...Employers added 223,000 jobs in December, the Labor Department said in its monthly payroll report... The unemployment rate unexpectedly fell to 3.5%, a five-decade low. "That's one of the lowest readings in the last oh, gosh, 60 years. You just don't get down to 3.5% that often," Eliades said. "Except the problem is, it works exactly the way your instinct might tell you it would work: very low unemployment numbers are usually very bearish for the market." Story at...
Stock market legend issues ‘vicious and ferocious growling bear’ warning over US labor force (msn.com)
My cmt: As I noted recently, low unemployment can signal an overheated economy. If the Fed is hell bent on increasing unemployment, even though inflation is falling, this prediction could be correct. The issue is timing. We might see new highs in the markets before this prediction can be realized. At that point, we may consider whether this dire outcome is still is a possibility. 
 
THEY’VE RULED OUT TAIL RISK (Hussman Funds)
“As of Friday, December 16, the S&P 500 Index is down -19.7% from the most speculative level of valuations in U.S. history – exceeding even the 1929 and 2000 extremes, based on the valuation measures we find best-correlated with actual subsequent market returns in cycles across history. The apparent shallowness of this loss isn’t a sign of “resilience.” Despite being nearly a year into what we expect to be a far deeper retreat, the relatively shallow loss isn’t even surprising. The same thing happened in the first year of each of the three deepest post-war stock market collapses: 2000-2002, 2007-2009, and 1973-74...For our part, our most reliable valuation measures imply negative 10-12 year market returns, and a potential market loss on the order of -60% from current levels over the completion of the present market cycle.” Commentary at... 
https://www.hussmanfunds.com/comment/mc221219/
My cmt: While a crash from current market levels is possible, it seems unlikely at this point. Here are some other thoughts by Pros...
 
2023 OUTLOOK (Ciovacco Management on YouTube)
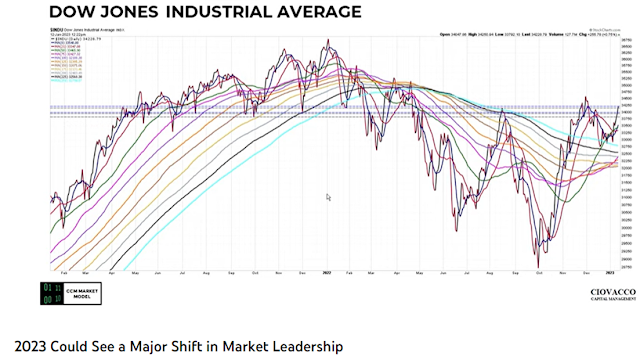
“A lot of good things are happening [in this chart] including the price consolidating above the moving averages...This is different than anything we’ve seen [during the pullback]...telling us there’s a higher probability of [markets moving higher].” Chris Ciovacco, Ciovacco Management. Narrated PowerPoint presentation at...
https://www.youtube.com/watch?v=Cao1nSHWvGo
My cmt: The presentation shows many charts improving thus indicating a higher probability of good things happening in the future. The charts were from Thursday.  Friday, there were more bullish indications, most notably, the S&P 500 broke above its 200-day moving average.
 
3RD YEAR OF PRESIDENTIAL TERM IS SUPPOSED TO BE BULLISH (McClellan Financial Publications)
“During a typical 4-year presidential term, the stock market tends to be flattish during the first 2 years...But third years are really consistently up, almost all of the time.  The notable exceptions were 1931, when the world was in the middle of the Great Depression, and 1939, when the Wehrmacht was marching through Poland.  Outside of conditions like those, the third year can usually be counted on to be an up year.” Commentary at...
https://www.mcoscillator.com/learning_center/weekly_chart/3rd_year_of_presidential_term_is_supposed_to_be_bullish/
 
MARKET REPORT / ANALYSIS
-Tuesday the S&P 500 dipped about 0.2% to 3991.
-VIX rose about 6% to 19.36.
-The yield on the 10-year Treasury rose to 3.549%.
 
PULLBACK DATA:
-Drop from Top: 16.8% as of today. 25.4% max (on a closing basis).
-Trading Days since Top: 260-days.
The S&P 500 is 0.3% ABOVE its 200-dMA & 1.8% ABOVE its 50-dMA.
*I won’t call the correction over until the S&P 500 makes a new-high; however, evidence suggests the bottom was in the 3600 area.
 
MY TRADING POSITIONS:
I am doing less trading now. You may do better watching the momentum charts rather than my moves.
XLK – Technology ETF.
SSO – 2x S&P 500. (My indicators are improving.)
XLE – Energy Sector ETF. Low PE; good Dividend; decent momentum.
BA – (Boeing) I am late on this one, but we’ll see.
XLY - Consumer Discretionary ETF.
 
SHY – Short term bonds. 30-day yield is 4.2%. (Trailing 1-year yield is 1.3%.) I’ll hold this, but if the market retests the lows, I’ll sell it and buy stocks.)
 
TODAY’S COMMENT:
 
“Breadth thrusts have, for the most part, been the most reliable market signal in the bull market from 2009 all the way up to 2021.” – Chris Ciovacco. I use a Zweig Breadth Thrust that is bullish when there is a rapid improvement in the percentage of stocks advancing over a given time period. The graphic indicates 61 Breadth Thrust signals. Many of those signals are using other methods of determining breadth thrusts. I only have 23 bullish Zweig Breadth Thrusts since 2009. Still, I think the point is the same; breadth thrusts are good indicators. Since we saw a Breadth Thrust last Thursday, it suggests good things ahead for the markets, with a caution. No indicator is always right – we saw a Breadth Thrust on 2 June 2022. While it marked a good bounce, it was obviously not the bottom of this bear market. The S&P 500 fell another 13% before bottoming in October. Further, it was followed by 2 negative Breadth Thrusts a week later warning of more trouble ahead. There is no guarantee that October will be the final bottom, but indicators are improving and a Breadth Thrust is very bullish.
 
It looks like the Nasdaq Composite retested its lows at the end of December and has bounced up sharply from there. The Nas was up 0.1% today while the other major indices were all down. It might be time to add more exposure to technology.
 
The S&P 500 is still overbought on the A/D Ratio so we could see a bit of weakness, but I don’t expect much downside. The Buying Pressure minus Selling Pressure is sloping upward now, a bullish sign.  This indicator has been down for the last month.
 
The S&P 500 closed above its 200-dMA for a second consecutive day a good sign for the bulls.
 
Today, the daily sum of 20 Indicators improved from +13 to +14 (a positive number is bullish; negatives are bearish); the 10-day smoothed sum that smooths the daily fluctuations increased from +114 to 121. (The trend direction is more important than the actual number for the 10-day value.) These numbers sometimes change after I post the blog based on data that comes in late. Most of these 20 indicators are short-term so they tend to bounce around a lot.
 
LONG-TERM INDICATOR: The Long Term NTSM indicator remained BUY: In a rare agreement, VOLUME, VIX, PRICE & SENTIMENT are all positive.
“Looking good Billy Ray! Feeling good Lewis!”
(The important BUY in this indicator was on 21 October, 7-days after the bottom. The NTSM buy-signal was 27 September, based on improved internals at the retest low, about 2% before the bottom.)
 
Bottom line: I’m a BULL. I am over-invested in the markets.
I now have about 75% of the portfolio invested in stocks. (As a retiree, 50% invested in stocks is my “normal” portfolio.) As the rally ages, I’ll cut back toward a 50% stock allocation more suitable for my status as a retiree.
 
BEST ETFs - MOMENTUM ANALYSIS:
TODAY’S RANKING OF 15 ETFs (Ranked Daily)
ETF ranking follows:
The top ranked ETF receives 100%. The rest are then ranked based on their momentum relative to the leading ETF.
*For additional background on the ETF ranking system see NTSM Page at…
http://navigatethestockmarket.blogspot.com/p/exchange-traded-funds-etf-ranking.html

BEST DOW STOCKS - TODAY’S MOMENTUM RANKING OF THE DOW 30 STOCKS (Ranked Daily)
DOW 30 momentum ranking follows:
The top ranked Stock receives 100%. The rest are then ranked based on their momentum relative to the leading Stock.
For more details, see NTSM Page at…
https://navigatethestockmarket.blogspot.com/p/a-system-for-trading-dow-30-stocks-my_8.html

TUESDAY MARKET INTERNALS (NYSE DATA)

My basket of Market Internals remained BUY.
(Market Internals are a decent trend-following analysis of current market action, but should not be used alone for short term trading. They are most useful when they diverge from the Index.) 
 
 
...My current invested position is about 75% stocks, including stock mutual funds and ETFs. I’m usually about 50% invested in stocks.
 
I trade about 15-20% of the total portfolio using the momentum-based analysis I provide here. If I can see a definitive bottom, I’ll add a lot more stocks to the portfolio using an S&P 500 ETF.
 

Friday, January 13, 2023

Inflation is Over ... Michigan Sentiment ... Best DOW Stocks ... Best ETFs … Stock Market Analysis

 
“Trade what you see; not what you think.” – The Old Fool, Richard McCranie, trader extraordinaire.
 
“Inflation on a forward-looking basis is low.” Proffessor Jeremy Siegel, Wharton School of Business
 
UNIV OF MICHIGAN SENTIMENT (Univ of Michigan)
“Consumer sentiment remained low from a historical perspective but continued lifting for the second consecutive month, rising 8% above December and reaching about 4% below a year ago. Current assessments of personal finances surged 16% to its highest reading in eight months on the basis of higher incomes and easing inflation. Although the short-run economic outlook fell modestly from December, the long-run outlook rose 7% to its highest level in nine months and is now 17% below its historical average. Year-ahead inflation expectations receded for the fourth straight month, falling to 4.0% in January from 4.4% in December.” Press release at...
http://www.sca.isr.umich.edu/
 
INFLATION IS OVER (CNBC)
“The CPI, which measure of basket of items most frequently purchased by consumers, homes, food, energy, apparel, etc., has not only stopped going up but, as of yesterday’s report, [12 Jan] showed its first monthly decline since inflation broke out... Core consumer prices have also sharply and rapidly descended from their mid-2022 peak...The markets are not the only indicators saying inflation has peaked, the data, themselves, are making the self-same case. Inflation is dead. Long live inflation!” – Ron Insana. Story at...
https://www.cnbc.com/2023/01/13/insana-says-the-case-is-clear-that-inflation-is-over.html?qsearchterm=inflation
 
MARKET REPORT / ANALYSIS
-Friday the S&P 500 rose about 0.4% to 3999.
-VIX fell about 3% to 18.35.
-The yield on the 10-year Treasury rose to 3.505%.
 
PULLBACK DATA:
-Drop from Top: 16.6% as of today. 25.4% max (on a closing basis).
-Trading Days since Top: 258-days.
The S&P 500 is 0.4% ABOVE its 200-dMA & 2.2% ABOVE its 50-dMA.
*I won’t call the correction over until the S&P 500 makes a new-high; however, evidence suggests the bottom was in the 3600 area.
 
MY TRADING POSITIONS:
I am doing less trading now. You may do better watching the momentum charts rather than my moves.
XLK – Technology ETF.
SSO – 2x S&P 500. (My indicators are improving.)
XLE – Energy Sector ETF. Low PE; good Dividend; decent momentum.
BA – I am late on this one, but we’ll see.
XLY - Consumer Discretionary.
 
TODAY’S COMMENT:
Sentiment turned Bullish today because there are too many bears betting against the markets. (I measure Sentiment as %-Bulls (Bulls/{bulls+bears}) based on the amounts invested in selected Rydex/Guggenheim mutual funds.) My buy-sell limits are based on a 5-day moving average and standard deviation analysis. The values might be much more negative at the bottom of a major crash, but for now, I am seeing investors betting the rally will fail at the 200-dMA, thus giving us a bull-signal. Sentiment has been bullish at various times during this bear market, most recently after the October 12 lows, so Sentiment alone cannot be used for market timing.
 
Looks like the Bears who were betting the rally would fail at the 200-dMA were wrong; the S&P 500 closed above its 200-day Friday. That may push markets higher next week.
 
On Fridays, I summarize a number of indicators to get a weekly feel for trend. The Friday rundown of indicators improved and shifted more bullish (5-bear and 18-bull). These indicators tend to be both long-term and short-term, so they are different than the 20 that I report on daily. 
 
BULL SIGNS
-There was a Zweig Breadth Thrust 12 January. That’s a rare, very-bullish sign.
-There was a Follow-thru day 6 January and that cancels prior Distribution Days.
-The 10-dMA percentage of issues advancing on the NYSE (Breadth) is above 50%.
-The 50-dMA percentage of issues advancing on the NYSE (Breadth) is above 50%.
-Sentiment.
-The smoothed advancing volume on the NYSE is increasing.
-MACD of the percentage of issues advancing on the NYSE (breadth) made a bullish crossover 13 Jan.
-MACD of S&P 500 price made a bullish crossover 11 Jan.
-My Money Trend indicator is improving.
-Short-term new-high/new-low data.
-Long-term new-high/new-low data.
-McClellan Oscillator.
-VIX indicator. (VIX is falling fast enough to be bullish.)
-XLI-ETF (Cyclical Industrials) is outperforming the S&P 500.
-The 5-day EMA is above the 10-day EMA so short-term momentum is bullish.
-The 5-10-20 Timer System is BUY; the 5-dEMA and 10-dEMA are both above the 20-dEMA.
-Slope of the 40-dMA of New-highs is rising.
-66% of the 15-ETFs that I track have been up over the last 10-days.
 
NEUTRAL
-There has only been 1 Statistically-Significant day (big moves in price-volume) in the last 15-days.
-Issues advancing on the NYSE (Breadth) compared to the S&P 500.
-The short-term, 10-day, Fosback Hi-Low Logic Index is neutral although leaning bullish.
-The longer-term, 50-dEMA, Fosback Hi-Low Logic Index is neutral although leaning bullish.
-There have been 5 up-days over the last 10 sessions – neutral.
-There have been 9 up-days over the last 20 sessions - neitral.
-The graph of the 100-day Count (the 100-day sum of up-days) has flattened.
-RSI
-The Smart Money (late-day action) is mixed.
-The 50-dMA percentage of issues advancing on the NYSE (Breadth) has been above 50%, for 3 days in a row ending the “correction-now” signal.
-The Calm-before-the-Storm/Panic Indicator flashed a panic-buying signal 10 November - expired.
-90% down-volume days - the last one was 5 Dec. - neutral. (There has been a 90% up-volume day since then, but it did not meet all of the tests for a bullish 90% up-volume day.)
-The S&P 500 is 0.4% above its 200-dMA. (Bull indicator is 12% below the 200-day, although this is based on “normal” pullbacks.)
-There was a Hindenburg Omen signal 8 April – expired.
-2.8% of all issues traded on the NYSE made new, 52-week highs when the S&P 500 made a new all-time-high, 3 January 2022. (There is no bullish signal for this indicator.) This indicated that the advance was too narrow and a correction was likely to be >10%. It proved correct, but is now Expired
-The 52-week, New-high/new-low ratio improved by 3.5 standard deviations. More simply, the spread between new-highs and new-lows improved by 716 on 14 October. That’s a solid bottom sign at a retest. – Expired.
-13 & 21 Oct were Bullish Outside Reversal Days with no Bearish Outside Reversal days since then - expired.
-On average, the size of up-moves has been larger than the size of down-moves over the last month, but not enough to send a signal.
 
BEAR SIGNS
-The 100-dMA percentage of issues advancing on the NYSE (Breadth) is still below 50%, but not by much.
-Smoothed Buying Pressure minus Selling Pressure is falling, but just barely.
-Overbought/Oversold Index (Advance/Decline Ratio) is overbought. 
-S&P 500 is underperforming Utilities (XLU-ETF).
-Bollinger Bands.
 
On Friday, 21 February, 2 days after the top before the Coronavirus pullback, there were 10 bear-signs and 1 bull-sign. Now there are 5 bear-signs and 18-Bull. Last week, there were 6 bear-sign and 11 bull-signs.
 
The Friday rundown is giving a very bullish indication. The shorter term indicators are quite bullish, too.
 
Today, the daily sum of 20 Indicators remained +13 (a positive number is bullish; negatives are bearish); the 10-day smoothed sum that smooths the daily fluctuations increased from +103 to 114. (The trend direction is more important than the actual number for the 10-day value.) These numbers sometimes change after I post the blog based on data that comes in late. Most of these 20 indicators are short-term so they tend to bounce around a lot.
 
LONG-TERM INDICATOR: The Long Term NTSM indicator remained BUY: VOLUME, VIX & SENTIMENT are positive; PRICE is neutral. (The important BUY in this indicator was on 21 October, 7-days after the bottom. The NTSM buy-signal was 27 September, based on improved internals at the retest low, about 2% before the bottom.)
 
Bottom line: “Looking good Billy Ray! Feeling good Lewis!” I’m a BULL. I am over-invested in the markets, back to where I was before the recent weakness got me worried that the S&P 500 might make a lower low, even though my analysis suggested that the bottom was roughly 3600 for the S&P 500.
 
I now have about 75% of the portfolio invested in stocks. (As a retiree, 50% invested in stocks is my “normal” portfolio.) I was 75% invested in stocks in early December so I am just resetting my stock allocation based on my analysis that showed the correction bottom probably occurred around 27 September. As the rally ages, I’ll cut back toward a 50% stock allocation more suitable for my status as a retiree.
 
BEST ETFs - MOMENTUM ANALYSIS:
TODAY’S RANKING OF 15 ETFs (Ranked Daily)
ETF ranking follows:

The top ranked ETF receives 100%. The rest are then ranked based on their momentum relative to the leading ETF.
*For additional background on the ETF ranking system see NTSM Page at…
http://navigatethestockmarket.blogspot.com/p/exchange-traded-funds-etf-ranking.html
 
BEST DOW STOCKS - TODAY’S MOMENTUM RANKING OF THE DOW 30 STOCKS (Ranked Daily)
DOW 30 momentum ranking follows:

The top ranked Stock receives 100%. The rest are then ranked based on their momentum relative to the leading Stock.
For more details, see NTSM Page at…
https://navigatethestockmarket.blogspot.com/p/a-system-for-trading-dow-30-stocks-my_8.html
 
FRIDAY MARKET INTERNALS (NYSE DATA)
My basket of Market Internals remained BUY.
(Market Internals are a decent trend-following analysis of current market action, but should not be used alone for short term trading. They are most useful when they diverge from the Index.) 
 
 
...My current invested position is about 75% stocks, including stock mutual funds and ETFs. I’m usually about 50% invested in stocks.
 
I trade about 15-20% of the total portfolio using the momentum-based analysis I provide here. If I can see a definitive bottom, I’ll add a lot more stocks to the portfolio using an S&P 500 ETF.
 

Thursday, January 12, 2023

CPI ... Jobless Claims ... Best DOW Stocks ... Best ETFs … Stock Market Analysis ...

 
“Trade what you see; not what you think.” – The Old Fool, Richard McCranie, trader extraordinaire.
 
“Wars reveal much about societies, and this one is no exception. The invasion of Ukraine is not about legitimate grievance, or even the aspirations of a dictator, but about a more profound problem of Russia’s imperial self-conception. And that is why assuring victory to Ukraine and a defeat of those ambitions is so important.” – Elliot A. Cohen, professor at Johns Hopkins School of Advanced International Studies and chair in strategy at the Center for Strategic and International Studies. 
 
In its early years, my NTSM Blog had a large Russian readership, but that didn’t last. When Putin was first elected, UN election watchers identified massive fraud due to skewed results in some areas.  Russia was forced to hold another election, but Putin leaned how to cheat better and he was elected. When I criticized that phony election my Russian readers vanished.
 

CPI (CNBC)
“The consumer price index, which measures the cost of a broad basket of goods and services, fell 0.1% for the month, in line with the Dow Jones estimate. That equated to the largest month-over-month decrease since April 2020...[during Covid lockdown]...” Story at...
https://www.cnbc.com/2023/01/12/consumer-prices-fell-0point1percent-in-december-in-line-with-economists-expectations.html
 
JOBLESS CLAIMS (WSJ)
“Initial jobless claims, a proxy for layoffs, fell by 1,000 to a seasonally adjusted 205,000 last week, the Labor Department said Thursday. Claims had trended higher since touching near record lows early in 2022, but continue to hover near pre-pandemic levels...“Inflation is quickly moderating. Obviously, it’s still painfully high, but it’s quickly moving in the right direction,” said Mark Zandi, chief economist at Moody’s Analytics. ” Story at...
https://www.wsj.com/articles/u-s-jobless-claims-edge-down-in-first-week-of-year-11673530895
 
2023 FEARLESS FORECAST – YEAR OF THE BULL – EXCERPT (Heritage Capital)
“The stock market begins 2023 with strong headwinds of sharply higher interest rates, stubbornly high inflation, weakening economy and a dogmatic Federal Reserve. Those do not sound like ingredients for a bull market or positive year. But that’s exactly what I see ahead. 2023 will be green for the stock market. How the markets get from January 1 to December 31 is the interesting question...On the index front the venerable Dow Jones Industrial Average will be the laggard in 2023. Looking at the sectors, the semiconductors make a big comeback and energy lags...I haven’t been this excited for fixed income since March 2009. All reasonable scenarios lead to higher bond prices and lower yields. By “bonds”, I am referring to treasury and investment grade corporates.” – Paul Schatz, President Heritage Capital. Full forecast at... 
https://investfortomorrow.com/blog/2023-fearless-forecast-year-of-the-bull/
 
MARKET REPORT / ANALYSIS
-Thursday the S&P 500 rose about 0.3% to 3983.
-VIX fell about 11% to 18.83.
-The yield on the 10-year Treasury dipped to 3.446%.
 
PULLBACK DATA:
-Drop from Top: 17% as of today. 25.4% max (on a closing basis).
-Trading Days since Top: 258-days.
The S&P 500 is at its 200-dMA & 1.8% ABOVE its 50-dMA.
*I won’t call the correction over until the S&P 500 makes a new-high; however, evidence suggests the bottom was in the 3600 area.
 
MY TRADING POSITIONS:
I am doing less trading now. You may do better watching the momentum charts rather than my moves.
XLK – Technology ETF.
SSO – 2x S&P 500. (My indicators are improving.)
XLE – Energy Sector ETF. Low PE; good Dividend; decent momentum.
BA – I am late on this one, but we’ll see.
 
Consumer Discretionary (XLY) has been outperforming recently, another bullish sign. That would be a good choice now if the bottom really has been made.
ITA remains near the top in my momentum ETF analysis. I saw an article mentioning that the US needs to decide whether to arm Ukraine or replenish US stocks. I suspect we'll do both.  
 
TODAY’S COMMENT:
All of the CNBC regulars (except for Jim Lebenthal) and most guest pundits are saying the same thing: Markets will fall in the first half of the year as interest rates cause a slowdown and then rally in the latter half of the year.  I’d be very careful about group think. They could be right, but right now, the market does not agree with them. In any event, when everyone on Wall Street thinks one thing will happen, the actual outcome is often the opposite. Mr. Market is hard to predict; that’s why I try to follow him. Again, now and always, “Trade what you see; not what you think.”
 
S&P 500 climbed above its 200-dMA, but closed a whisker below it. However, there was a very bullish sign today - Thursday there was a Breadth Thrust.
 
“The Breadth Thrust Indicator is a technical indicator which determines market momentum, signaling the start of a potential new bull market. The idea is based on the principle that the sudden change of money in the investment markets elevates stocks and signals increased liquidity.”
https://www.investopedia.com/terms/b/breadth-thrust-indicator.asp#:~:text=The%20Breadth%20Thrust%20Indicator%20is%20a%20technical%20indicator%20which%20determines,stocks%20and%20signals%20increased%20liquidity.
 
Essentially, a Breadth Thrust is a rapid upward change in Breadth. In my case, it means that the % of advancing issues have increased dramatically over the last 10-days. Like all indicators, it isn’t foolproff. There was a Breadth Thrust in June and that one obviously didn’t signal a new bull market. There was one in January of 2019 and that one did occur 8-days after the low of a 20% correction that ended in December of 2018.
 
Today, the daily sum of 20 Indicators remained +13 (a positive number is bullish; negatives are bearish); the 10-day smoothed sum that smooths the daily fluctuations increased from +89 to 103. (The trend direction is more important than the actual number for the 10-day value.) These numbers sometimes change after I post the blog based on data that comes in late. Most of these 20 indicators are short-term so they tend to bounce around a lot.
 
LONG-TERM INDICATOR: The Long Term NTSM indicator remained BUY: VOLUME & VIX are positive; PRICE & SENTIMENT are neutral. (The important BUY in this indicator was on 21 October, 7-days after the bottom. The NTSM buy-signal was 27 September, based on improved internals at the retest low.)
 
The Advance / Decline Ratio remained overbought . This indicator signals frequently; a Breadth Thrust is rare and more significant.
 
Bottom line: I’m a BULL at this point. I am over-invested in the markets, back to where I was before the recent weakness got me worried that the S&P 500 might make a lower low, even though my analysis suggested that the bottom was roughly 3600 for the S&P 500.
 
I’m now have about 75% of the portfolio invested in stocks. (As a retiree, 50% invested in stocks is my “normal” portfolio.) I was 75% invested in stocks in early December so I am just resetting my stock allocation based on my analysis that showed the correction bottom probably occurred around 27 September. As the rally ages, I’ll cut back toward a 50% stock allocation more suitable for my status as a retiree.
 
BEST ETFs - MOMENTUM ANALYSIS:
TODAY’S RANKING OF 15 ETFs (Ranked Daily)
ETF ranking follows:
The top ranked ETF receives 100%. The rest are then ranked based on their momentum relative to the leading ETF.
*For additional background on the ETF ranking system see NTSM Page at…
http://navigatethestockmarket.blogspot.com/p/exchange-traded-funds-etf-ranking.html
 
BEST DOW STOCKS - TODAY’S MOMENTUM RANKING OF THE DOW 30 STOCKS (Ranked Daily)
DOW 30 momentum ranking follows:

The top ranked Stock receives 100%. The rest are then ranked based on their momentum relative to the leading Stock.
For more details, see NTSM Page at…
https://navigatethestockmarket.blogspot.com/p/a-system-for-trading-dow-30-stocks-my_8.html
 
THURSDAY MARKET INTERNALS (NYSE DATA)
My basket of Market Internals remained BUY.
(Market Internals are a decent trend-following analysis of current market action, but should not be used alone for short term trading. They are most useful when they diverge from the Index.) 
 
 
...My current invested position is about 75% stocks, including stock mutual funds and ETFs. I’m usually about 50% invested in stocks.
 
I trade about 15-20% of the total portfolio using the momentum-based analysis I provide here. If I can see a definitive bottom, I’ll add a lot more stocks to the portfolio using an S&P 500 ETF.


Wednesday, January 11, 2023

EIA Crude Inventories ... Best DOW Stocks ... Best ETFs … Stock Market Analysis

 
“Trade what you see; not what you think.” – The Old Fool, Richard McCranie, trader extraordinaire.
 
EIA CRUDE INVENTORIES (EIA)
“U.S. commercial crude oil inventories (excluding those in the Strategic Petroleum Reserve) increased by 19 million barrels from the previous week. At 439.6 million barrels, U.S. crude oil inventories are about 1% above the five year average for this time of year.” Report at...
https://ir.eia.gov/wpsr/wpsrsummary.pdf
 
MARKET REPORT / ANALYSIS
-Wednesday the S&P 500 rose about 1.3% to 3970.
-VIX rose about 2.5% to 21.09. (Perhaps the Options Crowd is buying protection in case the CPI data is bad tomorrow?)
-The yield on the 10-year Treasury dipped to 3.541%.
 
PULLBACK DATA:
-Drop from Top: 17.2% as of today. 25.4% max (on a closing basis).
-Trading Days since Top: 257-days.
The S&P 500 is 0.4% BELOW its 200-dMA & 1.5% ABOVE its 50-dMA.
*I won’t call the correction over until the S&P 500 makes a new-high; however, evidence suggests the bottom was in the 3600 area.
 
MY TRADING POSITIONS:
I am doing less trading now. You may do better watching the momentum charts rather than my moves.
XLK – Technology ETF. (I now have a small profit in XLK.)
SSO – 2x S&P 500. (My indicators are improving.)
XLE – Energy Sector ETF. Low PE; good Dividend; decent momentum.
 
Consumer Discretionary (XLY) has been outperforming recently, another bullish sign. That would be a good choice now if the bottom really has been made.
 
TODAY’S COMMENT:
The last time the S&P 500 was above its 200-dMA was back in April . The Index didn’t quite get there today – it closed 0.4% below it – but it is getting closer.
 
The Junk Bond(JNK) spread is looking very bullish since JNK has been showing a positive divergence (indicated by the rising red line) since late December.

 
The S&P 500 closed 0.3% above its 50-dMA today, Wednesday. Theat’s the second consecutive close above the 50-dMA and that is a good sign in the charts.
 
Today, the daily sum of 20 Indicators improved from +12 to +13 (a positive number is bullish; negatives are bearish); the 10-day smoothed sum that smooths the daily fluctuations increased from +76 to 89. (The trend direction is more important than the actual number for the 10-day value.) These numbers sometimes change after I post the blog based on data that comes in late. Most of these 20 indicators are short-term so they tend to bounce around a lot.
 
LONG-TERM INDICATOR: The Long Term NTSM indicator flpped back to BUY: PRICE & VOLUME are positive; VIX & SENTIMENT are neutral. (The important BUY in this indicator was on 21 October, 7-days after the bottom. The NTSM buy-signal was 27 September, based on improved internals at the retest low.)
 
The Advance / Decline Ratio is one fo the few bearish indicators today. It is overbought so that could give us a down-day soon. Sometimes this indicator can be a decent short-term indicator, but not always.  It is very short-term and even when it is correct, the signal can resolve itself quickly. It is not a top indicator. With CPI due Thursday, I think the news will overpower the indicators.
 
Indicators have gotten more bullish and the S&P 500 closed above its 50-dMA again, so I significantly increased my stock allocation.
 
Bottom line: I’m a BULL at this point. I am over-invested in the markets, back to where I was before the recent weakness got me worried that the S&P 500 might make a lower low, even though my analysis suggested that the bottom was roughly 3600 for the S&P 500.
 
I’m now have about 75% of the portfolio invested in stocks. (As a retiree, 50% invested in stocks is my “normal” portfolio.) I was 75% invested in stocks in early December so I am just resetting my stock allocation based on my analysis that showed the correction bottom probably occurred on 27 September. As the rally ages, I’ll cut back toward a 50% stock alloaction more suitable for my status as a retiree.
 
BEST ETFs - MOMENTUM ANALYSIS:
TODAY’S RANKING OF 15 ETFs (Ranked Daily)
ETF ranking follows:

The top ranked ETF receives 100%. The rest are then ranked based on their momentum relative to the leading ETF.
*For additional background on the ETF ranking system see NTSM Page at…
http://navigatethestockmarket.blogspot.com/p/exchange-traded-funds-etf-ranking.html
 
BEST DOW STOCKS - TODAY’S MOMENTUM RANKING OF THE DOW 30 STOCKS (Ranked Daily)
DOW 30 momentum ranking follows:
The top ranked Stock receives 100%. The rest are then ranked based on their momentum relative to the leading Stock.
For more details, see NTSM Page at…
https://navigatethestockmarket.blogspot.com/p/a-system-for-trading-dow-30-stocks-my_8.html
 
WEDNESDAY MARKET INTERNALS (NYSE DATA)
My basket of Market Internals remained BUY.
(Market Internals are a decent trend-following analysis of current market action, but should not be used alone for short term trading. They are most useful when they diverge from the Index.) 
 
 
...My current invested position is about 75% stocks, including stock mutual funds and ETFs. I’m usually about 50% invested in stocks.
 
I trade about 15-20% of the total portfolio using the momentum-based analysis I provide here. If I can see a definitive bottom, I’ll add a lot more stocks to the portfolio using an S&P 500 ETF.