Markets are closed Monday for the George Washington’s
birthday. Washington was revered during his time and was unanimously elected President
by the Electoral College. Washington stepped down after two-terms and that act established
a tradition of Presidents serving only two terms. That tradition was unbroken until Franklin
Roosevelt served 13 years, from 1932 until his death in 1945. In 1951, the Constitution was Amended to
limit Presidents to two terms.
“Trade what you see; not what you think.” – The Old Fool,
Richard McCranie, trader extraordinaire.
“Far
more money has been lost by investors in preparing for corrections, or
anticipating corrections, than has been lost in the corrections themselves.” - Peter
Lynch, former manager of Fidelity’s Magellan® fund
“I personally did not see the shooter. I heard the
altercation of a girl or some girls like ‘don’t do it, not here this is stupid’
or something like that. And then the gunshots, which at the time I thought were
fireworks...I mean, I got suspicious of a certain group of people that were
there...We were standing on the left side of the stage when the shooting ended
up happening. And right before it ended up happening, there was this group
dressed in all black. About four, five, six kids with black on, black masks.”
- Jacob
Gooch, Kansas City shooting survivor, as told to CBS Mornings.
My cmt: Police have stated that the shootings resulted
from a “dispute between people.” Some of
the victims (described as “children” by the press) must have been members of a
rival gang, at least that’s my speculation. We’ll see.
PPI / CORE PPI (CNBC)
“Wholesale prices rose more than expected in January,
further complicating the inflation picture...
The producer price index, a measure of prices received by producers of domestic
goods and services, rose 0.3% for the month, the biggest move since August...
Excluding food and energy, core PPI increased 0.5%...” Story at...
https://www.cnbc.com/2024/02/16/january-wholesale-prices-rise-0point3percent-more-than-expected.html
My cmt: Both PPI and Core PPI were higher than expected.
The market reaction was much less than when the CPI report came out. Since CPI
was high, it wasn’t a complete shock that PPI was also above the expected
number.
PPI (Advisor Perspectives)
Chart from...
https://www.advisorperspectives.com/dshort/updates/2024/02/16/inflation-ppi-producer-price-index-down-january-2024
HOUSING STARTS (Baton Rouge Business Report)
“U.S. single-family homebuilding fell in January, likely
because of harsh weather conditions, but a rise in permits for future
construction suggested a rebound in the coming months. Single-family housing
starts, which account for the bulk of homebuilding, dropped 4.7%” ... Story
at...
https://www.businessreport.com/newsletters/roundup-us-housing-starts-wholesale-prices-growing-wealth
UNIV MICHIGAN SENTIMENT (Morningstar)
“Sentiment among U.S. consumers ticked up slightly in
February, cementing a recent upswing in confidence as inflation continues to
ease. The preliminary reading Friday of the University of Michigan's
consumer-confidence index climbed for the third consecutive month to 79.6
points in February from 79.0 in January.” Story at...
https://www.morningstar.com/news/dow-jones/202402164470/us-consumer-confidence-rises-for-third-straight-month-confirming-recovery-university-of-michigan
MARKET REPORT / ANALYSIS
-Friday the S&P 500 declined about 0.5% to 5006.
-VIX rose about 2% to 14.24.
-The yield on the 10-year Treasury rose to 4.281%.
MY TRADING POSITIONS:
UWM – Added 1/22/2024.
XLK – Technology ETF (holding since the October 2022
lows).
INTC – Added 12/6/2023.
CRM – Added 1/22/2024
BA – Added 12/6/2023. I plan to hold Boeing for the time
being.
DWCPF - Dow Jones U.S. Completion Total Stock Market
Index. – Added 12/7/2023 when I sold the S&P 500. This is a large position
in my retirement account betting on Small Caps.
TODAY’S COMMENT:
We look at a Summary of indicators on Friday (about
50-indicators). These indicators tend to be both long-term and short-term. The
weekly rundown of indicators remained Bullish this week, but there were fewer
Bull-signs: now 6-bear and 13-bull.
BULL SIGNS
-The smoothed advancing volume on the NYSE is rising.
-The
10-dMA percentage of issues advancing on the NYSE (Breadth) is above 50%.
-The 50-dMA percentage of issues advancing on the NYSE
(Breadth) is above 50%.
-The
100-dMA percentage of issues advancing on the NYSE (Breadth) is above 50%
-My Money Trend indicator.
-McClellan Oscillator.
-Short-term new-high/new-low data.
-The graph of the 100-day Count (the 100-day sum of
up-days).
-There were
back-to-back 80% up-volume days on 14 &15 February canceling the High
down-volume, down day on 13
February, although not all of the criteria were met for the high,
down-volume day.
-XLI-ETF (Cyclical Industrials) vs the S&P 500.
-The 5-10-20 Timer System is BUY.
-The short-term momentum is bullish.
-63% of the 15-ETFs that I track have been up over the
last 10-days. (45-55% is neutral.)
NEUTRAL
-There have been 3 Distribution Days since 19 Jan
Follow-thru day, but not enough to send a signal.
-There have been 3 Statistically-Significant days (big
moves in price-volume) in the last 15-days.
-The S&P 500 is 11.6% above its 200-dMA. (The Bear
indicator is 12% above the 200-day.)
-Sentiment. (Sentiment got very bearish recently due to
the continued march higher. Too much bearishness is bullish, but it is back to
neutral now.)
-Bollinger
Bands.
-The Bollinger Squeeze has cleared.
-Overbought/Oversold Index (Advance/Decline Ratio).
-The 50-dMA percentage of issues advancing on the NYSE
(Breadth) has not been below 50% for more than 3 days in a row.
-Issues advancing on the NYSE (Breadth) compared to the
S&P 500.
-On average, the size of up-moves has been smaller than
the size of down-moves over the last month, but not enough to send a message.
-7.6% of all issues traded on the NYSE made new, 52-week
highs when the S&P 500 made a new all-time-high, 15 February 2024. (There
is no bullish signal for this indicator.)
-The short-term, 10-day EMA, Fosback Hi-Low Logic Index.
-The long-term, 50-dEMA, Fosback Hi-Low Logic Index.
-There
was a New-high/New-low spread reversal on 4 October (based on std deviation of
spread). Expired
-There have been 13 up-days over the last 20 sessions.
-There have been 6 up-days over the last 10 sessions.
-RSI.
-The Calm-before-the-Storm/Panic Indicator flashed a top
warning signal 15 Sept., but it may well have been a bottom signal. - Expired
-VIX indicator.
-There was a Hindenburg Omen signal 6 Feb 2024 – expired.
The McClellan Oscillator turned positive 9 February.
-20 December there was a Bearish Outside Reversal Day,
but the S&P 500 closed above the high for 20 December, 4778, on 27 & 28
December so this one is now neutral.
-There was a Zweig Breadth Thrust 3 November. That’s a
rare, very-bullish sign, but the McClellan Oscillator subsequently turned
negative ending this signal.
-Long-term new-high/new-low data.
BEAR SIGNS
-MACD of the percentage of issues advancing on the NYSE
(breadth) made a bearish crossover 12 January.
-MACD of S&P 500 price made a bearish crossover 16
Feb.
-Slope of the 40-dMA of New-highs is falling.
-Smoothed
Buying Pressure minus Selling Pressure.
-The Smart Money (late-day action).
-S&P 500 spread vs. Utilities (XLU-ETF).
Now there are 6 bear-signs and 13-Bull. Last week,
there were 7 bear-sign and 15 bull-signs.
The daily spread of 20 short-term Indicators (Bulls minus
Bears) declined from +7 to +5 (a positive number is bullish; negatives
are bearish); the 10-day smoothed sum that smooths the daily fluctuations improved
from +1 to +2. (The trend direction is more important than the actual number
for the 10-day value.) These numbers sometimes change after I post the blog
based on data that comes in late. Most of these 20 indicators are short-term so
they tend to bounce around a lot. Still, the markets are getting stretched
again so I’ll follow the indicators.
I’m gong to stop reporting the 20 Short-term
Indicator spread. The Friday Summary of about 50-Indicators seems to do a
better job that the 20-indicators. The blog is also confusing with several
different indicator ensemble indicators.
LONG-TERM INDICATOR: The Long Term NTSM indicator remained
HOLD: VOLUME, SENTIMENT, PRICE & VIX are neutral.
(One warning: The Long-Term Indicator is not a good
top-indicator. It can signal BUY at a top.)
(The important major BUY in this indicator was on 21
October 2022, 7-days after the bear-market bottom. For my NTSM overall signal,
I suggested that a short-term buying opportunity occurred on 27 September
(based on improved market internals on the retest), although without market
follow-thru, I was unwilling to call a buy; however, I did close shorts and
increased stock holdings. I issued a Buy-Signal on 4 October, 6-days before the
final bottom, based on stronger market action that confirmed the market
internals signal. The NTSM sell-signal was issued 21 December, 9 sessions
before the high of this recent bear market, based on the bearish “Friday Rundown”
of indicators.)
BOTTOM LINE
I remain bullish.
ETF - MOMENTUM ANALYSIS:
TODAY’S RANKING OF 15 ETFs (Ranked Daily)
ETF ranking follows:
The top ranked ETF receives
100%. The rest are then ranked based on their momentum relative to the leading
ETF.
*For additional background on
the ETF ranking system see NTSM Page at…
http://navigatethestockmarket.blogspot.com/p/exchange-traded-funds-etf-ranking.html
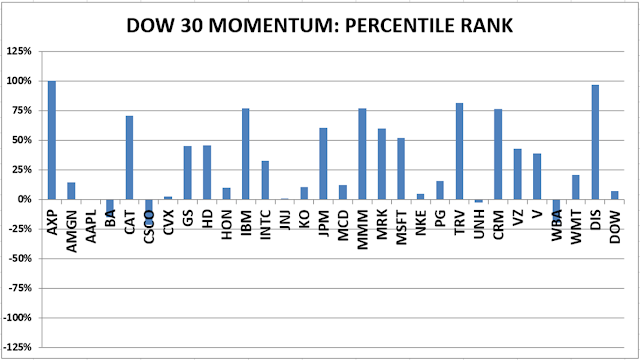
DOW STOCKS - TODAY’S MOMENTUM RANKING
OF THE DOW 30 STOCKS (Ranked Daily)
DOW 30 momentum ranking
follows:
The top ranked Stock receives
100%. The rest are then ranked based on their momentum relative to the leading Stock.
For more details, see NTSM
Page at…
https://navigatethestockmarket.blogspot.com/p/a-system-for-trading-dow-30-stocks-my_8.html
FRIDAY MARKET INTERNALS (NYSE
DATA)
My basket of Market Internals remained BUY. (My basket of Market
Internals is a decent trend-following analysis of current market action, but
should not be used alone for short term trading. They are most useful when they
diverge from the Index.)
...My current invested
position is about 65% stocks, including stock mutual funds and ETFs. I’m
usually about 50% invested in stocks. I’m “over invested” now expecting
continuation of bullish market action.
I trade about 15-20% of the total portfolio using the
momentum-based analysis I provide here. When I see a definitive bottom, I add a
lot more stocks to the portfolio using an S&P 500 ETF as I did back in
October.
“Trade what you see; not what you think.” – The Old Fool,
Richard McCranie, trader extraordinaire.
“Far
more money has been lost by investors in preparing for corrections, or
anticipating corrections, than has been lost in the corrections themselves.” - Peter
Lynch, former manager of Fidelity’s Magellan® fund
“A conservative group has told a Georgia judge that it
doesn't have evidence to support its claims of illegal ballot stuffing during
the 2020 general election and a runoff two months later. Texas-based True the
Vote filed complaints with Georgia Secretary of State Brad Raffensperger in
2021, including one in which it said it had obtained “a detailed account of
coordinated efforts to collect and deposit ballots in drop boxes across metro
Atlanta” during the November 2020 election and a January 2021 runoff.” Story
at...
Conservative
group tells judge it has no evidence to back its claims of Georgia ballot
stuffing (msn.com)
My cmt: This means that the movie, “2000 Mules” is also a
complete fake. The GBI (Georgia Bureau
of Investigation) also stated that the claims of ballot stuffing by True the
Vote and the 2000 Mules movie were not supported by the evidence provided in
the movie. The crazy thing is that during the 2020 election, Georgia matched
absentee ballot signatures to registrations and signatures on file. Even if there had been ballot stuffing, the
fake ballots would have been thrown out due to lack of registration and/or
non-matching signatures.
“About one-third of U.S. adults say they believe President
Biden was not legitimately elected president of the
United States in 2020, according a poll released this week.” - The Hill at...
https://thehill.com/homenews/campaign/4384619-one-third-of-americans-say-biden-election-illegitimate/
My cmt: 20% of Americans are complete idiots for
believing there is a Government/Taylor Swift conspiracy to elect Joe Biden. Now
30% believe the Trump stolen election absurdity. Let’s hope the 20% crazies
fall within the 30% nut-jobs otherwise we’d have to add them together. 50% of Americans can’t be idiots, can they?
“Regarding your [WSJ] editorial “Dartmouth Sees the Value of the SAT” (Feb. 6): The original
intent of the Scholastic Aptitude Test was to pave the way for students from
lower- and middle-income households to attend upper-tier universities. Harvard
began using the SAT in the 1930s, and the test proved highly accurate in predicting
success in college. Around the turn of the 21st century, however, an antimerit
movement started...Merit, after all, is blind to race, wealth, gender, sexual
orientation and geography....Dartmouth is to be congratulated for leading us
back to the very old-fashioned concept that students who achieve much in high
school will probably do the same in college, graduate school and beyond.” - Dwight Oxley, WSJ Letter to the Editor.
JOBLESS CLAIMS (Morningstar)
“The number of Americans who applied for unemployment
benefits in early February fell to a one-month low of 212,000 indicating
layoffs remain low nationwide despite sharp job cuts at some big businesses
such as UPS.” Story at...
https://www.morningstar.com/news/marketwatch/20240215278/jobless-claims-fall-to-one-month-low-of-212000-layoffs-still-small
PHILADELPHIA FED INDEX (Sharecast)
“Factory sector activity in the mid-Atlantic region
improved significantly in February, the results of a closely-followed survey
revealed. The Federal Reserve Bank of Philadelphia's manufacturing sector gauge
jumped from a reading of -10.6 in January to 5.2 for February.” Story at...
https://www.sharecast.com/news/international-economic/philly-fed-index-jumps-in-february--16209582.html
RETAIL SALES (CNBC)
“Consumer spending fell sharply in January, presenting a
potential early danger sign for the economy, the Commerce Department reported
Thursday. Advance
retail sales declined 0.8% for the month following a downwardly
revised 0.4% gain in December...” Story at...
https://www.cnbc.com/2024/02/15/retail-sales-january-2024-.html
NY FED MANUFACTURING (Westfair Business Journal)
“A manufacturing survey released this morning by the
Federal Reserve Bank of New York finds that business activity edged slightly
lower in New York recently... ‘On the heels of a significant contraction last
month, manufacturing activity shrank further in New York state,’ the report
said. The survey results suggested that employment levels remained essentially
unchanged. The results also showed that capital spending plans remained
somewhat soft.” Story at...
https://westfaironline.com/combined/ny-fed-finds-lower-ny-business-activity/
INDUSTRIAL PRODUCTION (Floor Daily via Forexfactory)
“Industrial production edged down 0.1% in January after
recording no change in December, according to the Federal Reserve.” Story at...
https://www.forexfactory.com/news/1267347-industrial-production-declined-01-in-january
MARKET REPORT / ANALYSIS
-Thursday the S&P 500 rose about 0.6% to 5030.
-VIX fell about 3% to 14.01.
-The yield on the 10-year Treasury rose to 4.252%.
MY TRADING POSITIONS:
UWM – Added 1/22/2024.
XLK – Technology ETF (holding since the October 2022
lows).
INTC – Added 12/6/2023.
CRM – Added 1/22/2024
BA – Added 12/6/2023. I plan to hold Boeing for the time
being.
DWCPF - Dow Jones U.S. Completion Total Stock Market
Index. – Added 12/7/2023 when I sold the S&P 500. This is a large position
in my retirement account betting on Small Caps.
TODAY’S COMMENT:
Breadth is improving: The 10-dMA of issues advancing on
the NYSE bounced up to nearly 55% today.
Longer term measures (50-dMA, 100dMA and 150-dMA) are all above 50% and
improving. These are bullish signs and
there are more...
7.6% of all issues traded on the NYSE made new, 52-week
highs when the S&P 500 made a new all-time-high today, 15 February 2024.
The 5-year average was for this stat is roughly 6.7%. The new-high data at the
new all-time high is another indication that the rally is broadening out.
We saw several more, new bull-signs
today: There were back-to-back 80% up-volume days Wednesday and Thursday. That’s
a bullish sign that cancels out the 90% down volume day on Tuesday; Like
yesterday, the daily chart looked bullish with a strong finish into the close
so we may expect some follow-thru on Friday; My Friday Summary Indicator (more
than 50-indicators) moved sharply to the bullish side Thursday. I’ll give a run-down of those indicators
tomorrow, hence the “Friday Summary” title for the indicator.
Not all the news was good today:
The S&P 500 is once again more than 12% above its 200-dMA. That’s
cautionary, but many other indicators are bullish so I won’t worry too much
about this one. Historically, the Index
has been nearly 20% above the 200-dMA, but that was a rare event.
The daily spread of 20 short-term Indicators (Bulls minus
Bears) improved from -3 to +7 (a positive number is bullish; negatives
are bearish); the 10-day smoothed sum that smooths the daily fluctuations improved
from -4 to +1. (The trend direction is more important than the actual number
for the 10-day value.) These numbers sometimes change after I post the blog
based on data that comes in late. Most of these 20 indicators are short-term so
they tend to bounce around a lot. Still, the markets are getting stretched again
so I’ll follow the indicators.
LONG-TERM INDICATOR: The Long Term NTSM indicator declined
to HOLD: VOLUME is bullish; SENTIMENT, PRICE & VIX are neutral.
(One warning: The Long-Term Indicator is not a good
top-indicator. It can signal BUY at a top.)
(The important major BUY in this indicator was on 21
October 2022, 7-days after the bear-market bottom. For my NTSM overall signal,
I suggested that a short-term buying opportunity occurred on 27 September
(based on improved market internals on the retest), although without market
follow-thru, I was unwilling to call a buy; however, I did close shorts and
increased stock holdings. I issued a Buy-Signal on 4 October, 6-days before the
final bottom, based on stronger market action that confirmed the market
internals signal. The NTSM sell-signal was issued 21 December, 9 sessions
before the high of this recent bear market, based on the bearish “Friday Rundown”
of indicators.)
BOTTOM LINE
I remain bullish.
ETF - MOMENTUM ANALYSIS:
TODAY’S RANKING OF 15 ETFs (Ranked Daily)
ETF ranking follows:
The top ranked ETF receives
100%. The rest are then ranked based on their momentum relative to the leading
ETF.
*For additional background on
the ETF ranking system see NTSM Page at…
http://navigatethestockmarket.blogspot.com/p/exchange-traded-funds-etf-ranking.html
DOW STOCKS - TODAY’S MOMENTUM RANKING
OF THE DOW 30 STOCKS (Ranked Daily)
DOW 30 momentum ranking
follows:
The top ranked Stock receives
100%. The rest are then ranked based on their momentum relative to the leading Stock.
For more details, see NTSM
Page at…
https://navigatethestockmarket.blogspot.com/p/a-system-for-trading-dow-30-stocks-my_8.html
THURSDAY MARKET INTERNALS
(NYSE DATA)
My basket of Market Internals improved to BUY. (My basket of Market Internals
is a decent trend-following analysis of current market action, but should not
be used alone for short term trading. They are most useful when they diverge
from the Index.)
...My current invested
position is about 65% stocks, including stock mutual funds and ETFs. I’m
usually about 50% invested in stocks. I’m “over invested” now expecting
continuation of bullish market action.
I trade about 15-20% of the total portfolio using the
momentum-based analysis I provide here. When I see a definitive bottom, I add a
lot more stocks to the portfolio using an S&P 500 ETF as I did back in
October.
“Trade what you see; not what you think.” – The Old Fool,
Richard McCranie, trader extraordinaire.
“The survey, released Wednesday by Monmouth University, found that
18% of Americans “think that a covert government effort for Taylor Swift to
help Joe Biden win the presidential election actually exists.” – USA Today.
Story at...
Nearly
1 in 5 Americans believe Taylor Swift is part of a 2024 plot to help Joe Biden
(msn.com)
My cmt: Proving once again that 1 in 5 Americans are
complete idiots.
CRUDE INVENTORIES (EIA)
“U.S. commercial crude oil inventories (excluding those
in the Strategic Petroleum Reserve) increased by 12.0 million barrels from the
previous week. At 439.5 million barrels, U.S. crude oil inventories are about
2% below the five-year average for this time of year.” Report at...
https://ir.eia.gov/wpsr/wpsrsummary.pdf
MARKET REPORT / ANALYSIS
-Wednesday the S&P 500 rose about 1% to 5001.
-VIX fell about 9% to 14.38.
-The yield on the 10-year Treasury rose to 4.234%.
MY TRADING POSITIONS:
UWM – Added 1/22/2024.
XLK – Technology ETF (holding since the October 2022
lows).
INTC – Added 12/6/2023.
CRM – Added 1/22/2024
BA – Added 12/6/2023. I plan to hold Boeing for the time
being.
DWCPF - Dow Jones U.S. Completion Total Stock Market
Index. – Added 12/7/2023 when I sold the S&P 500. This is a large position
in my retirement account betting on Small Caps.
TODAY’S COMMENT:
We got the bounce we were
looking for today. Now let’s see if the
rally can continue. I think that it
will. The Friday Summary of indicators (about 50-indicators) improved to
bullish with 12 Bull and 8 Bear indicators.
The daily chart looked bullish
with a strong finish into the close so we may expect some follow-thru on
Thursday.
The daily spread of 20 short-term Indicators (Bulls minus
Bears) improved from -8 to -3 (a positive number is bullish; negatives
are bearish); the 10-day smoothed sum that smooths the daily fluctuations declined
from +2 to -4. (The trend direction is more important than the actual number
for the 10-day value.) These numbers sometimes change after I post the blog
based on data that comes in late. Most of these 20 indicators are short-term so
they tend to bounce around a lot.
LONG-TERM INDICATOR: The Long Term NTSM indicator improved
to BUY: VOLUME & PRICE are bullish; SENTIMENT & VIX are neutral.
(One warning: The Long-Term Indicator is not a good
top-indicator. It can signal BUY at a top.)
(The important major BUY in this indicator was on 21
October 2022, 7-days after the bear-market bottom. For my NTSM overall signal,
I suggested that a short-term buying opportunity occurred on 27 September
(based on improved market internals on the retest), although without market
follow-thru, I was unwilling to call a buy; however, I did close shorts and
increased stock holdings. I issued a Buy-Signal on 4 October, 6-days before the
final bottom, based on stronger market action that confirmed the market internals
signal. The NTSM sell-signal was issued 21 December, 9 sessions before the high
of this recent bear market, based on the bearish “Friday Rundown” of
indicators.)
BOTTOM LINE
I remain bullish.
ETF - MOMENTUM ANALYSIS:
TODAY’S RANKING OF 15 ETFs (Ranked Daily)
ETF ranking follows:
The top ranked ETF receives
100%. The rest are then ranked based on their momentum relative to the leading
ETF.
*For additional background on
the ETF ranking system see NTSM Page at…
http://navigatethestockmarket.blogspot.com/p/exchange-traded-funds-etf-ranking.html
DOW STOCKS - TODAY’S MOMENTUM RANKING
OF THE DOW 30 STOCKS (Ranked Daily)
DOW 30 momentum ranking
follows:
The top ranked Stock receives
100%. The rest are then ranked based on their momentum relative to the leading Stock.
For more details, see NTSM
Page at…
https://navigatethestockmarket.blogspot.com/p/a-system-for-trading-dow-30-stocks-my_8.html
WEDNESDAY MARKET INTERNALS
(NYSE DATA)
My basket of Market Internals improved to HOLD. (My basket of Market
Internals is a decent trend-following analysis of current market action, but
should not be used alone for short term trading. They are most useful when they
diverge from the Index.)
...My current invested
position is about 65% stocks, including stock mutual funds and ETFs. I’m
usually about 50% invested in stocks. I’m “over invested” now expecting
continuation of bullish market action.
I trade about 15-20% of the total portfolio using the
momentum-based analysis I provide here. When I see a definitive bottom, I add a
lot more stocks to the portfolio using an S&P 500 ETF as I did back in
October.
“Trade what you see; not what you think.” – The Old Fool,
Richard McCranie, trader extraordinaire.
"Maybe the problem isn't that America isn't worth defending.
Maybe the problem is that lots of people today are entitled whiners who have no
perspective and no idea how good they have it... In 2016, Eddie Griffin
said, 'If Trump wins I'm moving to Africa' - apparently very slowly because in
Trump's four years, he only got as far as Van Nuys.... "The New Republic
just ran a story about the vulnerable minorities who want to flee America,
including the author- a gay man trapped in the dystopian homophobic hellscape
that is New York City. I wonder if he knows that there are 66 countries where
just being gay is a crime." – “Real Time” host, Bill Mahr.
https://www.foxnews.com/media/bill-maher-rips-america-bashing-celebs-vowed-flee-country-under-trump-still-here
“At the Super Bowl, the world watched as Kansas City
Chiefs superstar Travis Kelce screamed and then purposely bumped into the head
of his coach, Andy Reid. This behavior by Kelce, one of the team captains,
reminded me of a recent reflection I had on too many of today’s “leaders” as
compared to those of not very long ago. Consider the leaders from our past:
Andrew Carnegie. Henry Ford. FDR. Harry Truman. Billy Graham. Ronald Reagan.
Within a few generations, our model of good leadership has changed dramatically.”
- Brian Hamilton, Opinion.
https://fortune.com/2024/02/13/travis-kelce-super-bowl-behavior-coach-emblematic-rise-of-the-jerk-culture-success/
CPI / CORE CPI (WSJ)
“Inflation cooled again in January but came in above Wall
Street’s expectations, another sign that the Federal Reserve’s path to
interest-rate cuts is far from settled. The Labor Department reported
Tuesday that consumer prices rose 3.1% in January from a year
earlier... Core prices, which exclude food and energy items in an effort to
better track inflation’s underlying trend, were up 3.9% in January.” Story
at...
https://www.wsj.com/economy/consumers/what-to-watch-in-the-cpi-report-will-inflation-fall-below-3-ffc5859a
BUSINESS OPTIMISM (NFIB)
“The NFIB
Small Business Optimism Index decreased two points in
January to 89.9, marking the 25th consecutive month below the 50-year
average of 98. The net percent of owners who expect real sales to be higher
declined 12 points from December to a net negative 16% (seasonally adjusted), a
very negative shift in expectations.” Press release at...
https://www.nfib.com/content/press-release/economy/small-business-owners-expectations-for-higher-sales-declined-in-january/
MARKET REPORT / ANALYSIS
-Tuesday the S&P 500 dropped about 1.4% to 4953.
-VIX rose about 13% to 15.78.
-The yield on the 10-year Treasury rose to 4.316%.
MY TRADING POSITIONS:
UWM – Added 1/22/2024.
XLK – Technology ETF (holding since the October 2022
lows).
INTC – Added 12/6/2023.
CRM – Added 1/22/2024
BA – Added 12/6/2023. I plan to hold Boeing for the time
being.
DWCPF - Dow Jones U.S. Completion Total Stock Market
Index. – Added 12/7/2023 when I sold the S&P 500. This is a large position
in my retirement account betting on Small Caps.
TODAY’S COMMENT:
Both CPI and Core CPI disappointed the markets today. I
had hoped for some cooling in the markets, but not this much! (Be careful what
you wish for.) We had been watching the Russell 2000 outperform the S&P 500
recently as investors expected a “good” CPI report today. That was not the case as the interest
sensitive Russell gave up its recent gains.
Today, more than 90% of volume
was down-volume. That’s a bearish sign. Lowry Research says, “A single,
isolated 90% Downside Day does not, by itself, have any long-term trend
implications, since they often occur at the end of short-term corrections. But,
because they show that investors are in a mood to panic, even an isolated 90%
Downside Day should be viewed as an important warning that more could follow.“
If more do follow, the downtrend is likely to continue until we see a 90%
up-volume day.
The Friday Summary of indicators (about 50-indicators) dropped
to a neutral 50-50 position.
Not all the news was bad today...
Tuesday was a statistically significant down-day. That
just means that the price-volume move exceeded my statistical parameters.
Statistics show that a statistically-significant, down-day is followed by an
up-day about 60% of the time.
The Index was very close to lower trend line at the close
and that level may hold.
The S&P 500 is 10.8% above its 200-dMA so that
bearish indicator (>12%) has cleared.
There was a good bounce higher at the end of the day so
there could be follow-thru dip buying tomorrow. I did buy some more UWM (2x Russell 2000) late
in the day. (Glutton for punishment.)
The daily spread of 20 short-term Indicators (Bulls minus
Bears) declined from +3 to -8 (a positive number is bullish; negatives
are bearish); the 10-day smoothed sum that smooths the daily fluctuations declined
from +16 to +2. (The trend direction is more important than the actual number
for the 10-day value.) These numbers sometimes change after I post the blog
based on data that comes in late. Most of these 20 indicators are short-term so
they tend to bounce around a lot.
LONG-TERM INDICATOR: The Long Term NTSM indicator remained
HOLD: PRICE is bullish; SENTIMENT, VOLUME & VIX are neutral.
(One warning: The Long-Term Indicator is not a good
top-indicator. It can signal BUY at a top.)
(The important major BUY in this indicator was on 21
October 2022, 7-days after the bear-market bottom. For my NTSM overall signal,
I suggested that a short-term buying opportunity occurred on 27 September
(based on improved market internals on the retest), although without market
follow-thru, I was unwilling to call a buy; however, I did close shorts and
increased stock holdings. I issued a Buy-Signal on 4 October, 6-days before the
final bottom, based on stronger market action that confirmed the market
internals signal. The NTSM sell-signal was issued 21 December, 9 sessions
before the high of this recent bear market, based on the bearish “Friday Rundown”
of indicators.)
BOTTOM LINE
I remain bullish, but we’ll see. Indicators are neutral so it’s watch and
wait.
ETF - MOMENTUM ANALYSIS:
TODAY’S RANKING OF 15 ETFs (Ranked Daily)
ETF ranking follows:
The top ranked ETF receives
100%. The rest are then ranked based on their momentum relative to the leading
ETF.
*For additional background on
the ETF ranking system see NTSM Page at…
http://navigatethestockmarket.blogspot.com/p/exchange-traded-funds-etf-ranking.html
DOW STOCKS - TODAY’S MOMENTUM RANKING
OF THE DOW 30 STOCKS (Ranked Daily)
DOW 30 momentum ranking
follows:

The top ranked Stock receives
100%. The rest are then ranked based on their momentum relative to the leading Stock.
For more details, see NTSM
Page at…
https://navigatethestockmarket.blogspot.com/p/a-system-for-trading-dow-30-stocks-my_8.html
TUESDAY MARKET INTERNALS (NYSE
DATA)
My basket of Market Internals declined to SELL. (My basket of Market
Internals is a decent trend-following analysis of current market action, but
should not be used alone for short term trading. They are most useful when they
diverge from the Index.)
...My current invested
position is about 65% stocks, including stock mutual funds and ETFs. I’m
usually about 50% invested in stocks. I’m “over invested” now expecting
continuation of bullish market action.
I trade about 15-20% of the total portfolio using the
momentum-based analysis I provide here. When I see a definitive bottom, I add a
lot more stocks to the portfolio using an S&P 500 ETF as I did back in
October.
“A man who can't even be held responsible for mishandling
classified information properly has absolutely no business occupying the Oval
Office.” – House GOP Tweet on “X”.
My cmt: Hmmmmm...Are they talking about Biden? Trump? or
both?
“Trade what you see; not what you think.” – The Old Fool,
Richard McCranie, trader extraordinaire.
“Far
more money has been lost by investors in preparing for corrections, or
anticipating corrections, than has been lost in the corrections themselves.” - Peter
Lynch, former manager of Fidelity’s Magellan® fund
“The Demographic sweet spot says the secular bull market
could last until 2035.” – Chris and Kathy Ciovacco, Ciovacco Capital
Management.
MARKET REPORT / ANALYSIS
-Monday the S&P 500 dipped about 0.1% to 5022.
-VIX rose about 8% to 13.93.
-The yield on the 10-year Treasury rose to 4.179%.
MY TRADING POSITIONS:
UWM – Added 1/22/2024.
XLK – Technology ETF (holding since the October 2022
lows).
INTC – Added 12/6/2023.
CRM – Added 1/22/2024
BA – Added 12/6/2023. I plan to hold Boeing for the time
being.
DWCPF - Dow Jones U.S. Completion Total Stock Market
Index. – Added 12/7/2023 when I sold the S&P 500. This is a large position
in my retirement account betting on Small Caps.
TODAY’S COMMENT:
The Friday Summary of indicators (about 50-indicators) improved
today and now is 3 to 1 Bull indicators.
The S&P 500 is still >12% above its 200-dMA, 12.4%
to be more exact. It would be good to see some more days like today where the
S&P 500 is down a little or close to flat.
That would give the rising 200-dMA time to catch up a little and cancel
the most significant worry now. When the Index is more than 12% above its 200-dMMA
it is a sign that markets are stretched and may be more likely to undergo weakness.
Still, I am not predicting weakness now – most indicators look good.
The daily spread of 20 short-term Indicators (Bulls minus
Bears) remained +3 (a positive number is bullish; negatives are
bearish); the 10-day smoothed sum that smooths the daily fluctuations declined
from +22 to +16. (The trend direction is more important than the actual number
for the 10-day value.) These numbers sometimes change after I post the blog
based on data that comes in late. Most of these 20 indicators are short-term so
they tend to bounce around a lot.
LONG-TERM INDICATOR: The Long Term NTSM indicator declined
to HOLD: PRICE are bullish; SENTIMENT, VOLUME & VIX are neutral. – It’s
been bouncing back and forth so it’s still close to BUY.
(One warning: The Long-Term Indicator is not a good
top-indicator. It can signal BUY at a top.)
(The important major BUY in this indicator was on 21
October 2022, 7-days after the bear-market bottom. For my NTSM overall signal,
I suggested that a short-term buying opportunity occurred on 27 September
(based on improved market internals on the retest), although without market
follow-thru, I was unwilling to call a buy; however, I did close shorts and
increased stock holdings. I issued a Buy-Signal on 4 October, 6-days before the
final bottom, based on stronger market action that confirmed the market internals
signal. The NTSM sell-signal was issued 21 December, 9 sessions before the high
of this recent bear market, based on the bearish “Friday Rundown” of
indicators.)
BOTTOM LINE
I remain bullish.
ETF - MOMENTUM ANALYSIS:
TODAY’S RANKING OF 15 ETFs (Ranked Daily)
ETF ranking follows:
The top ranked ETF receives
100%. The rest are then ranked based on their momentum relative to the leading
ETF.
*For additional background on
the ETF ranking system see NTSM Page at…
http://navigatethestockmarket.blogspot.com/p/exchange-traded-funds-etf-ranking.html
DOW STOCKS - TODAY’S MOMENTUM RANKING
OF THE DOW 30 STOCKS (Ranked Daily)
DOW 30 momentum ranking
follows:
The top ranked Stock receives
100%. The rest are then ranked based on their momentum relative to the leading Stock.
For more details, see NTSM
Page at…
https://navigatethestockmarket.blogspot.com/p/a-system-for-trading-dow-30-stocks-my_8.html
MONDAY MARKET INTERNALS (NYSE
DATA)
My basket of Market Internals improved to BUY. (My basket of Market
Internals is a decent trend-following analysis of current market action, but
should not be used alone for short term trading. They are most useful when they
diverge from the Index.)
...My current invested
position is about 65% stocks, including stock mutual funds and ETFs. I’m
usually about 50% invested in stocks. I’m “over invested” now expecting
continuation of bullish market action.
I trade about 15-20% of the total portfolio using the
momentum-based analysis I provide here. When I see a definitive bottom, I add a
lot more stocks to the portfolio using an S&P 500 ETF as I did back in
October.
“Trade what you see; not what you think.” – The Old Fool,
Richard McCranie, trader extraordinaire.
CPI REVISIONS (Yahoo Finance)
“U.S. monthly consumer prices rose less than initially
estimated in December, revised government data showed on Friday. The consumer
price index rose 0.2% in December instead of 0.3% as reported last month,
annual revisions of the CPI data published by the Labor Department's Bureau of
Labor Statistics (BLS) showed. But data for November was revised up to show the
CPI increasing 0.2% rather than 0.1% as previously estimated.” Story at...
https://finance.yahoo.com/news/revised-us-december-cpi-gives-142214685.html
GOP SELF SABOTAGE (WSJ)
“Watching Republican lawmakers sit idle as border havoc
grows is a bit like watching the DC Universe dawdle as it waits for Superman to
save the day. Only Donald
Trump never wore tights, and the border is now kryptonite. Sen. James
Lankford (R., Okla.) this weekend unveiled the most substantive policy
improvements to border security in a century... There was a day when
Republicans would have jumped on such border restrictions... Mr. Trump will
inherit a problem that could well be insoluble without the sort of enforcement
tools Congress is debating now. Here’s the catch: While they could pass now,
they won’t under his watch. Should Mr. Trump win, Democrats will immediately
oppose them, making it impossible to win the 60 Senate votes necessary to
overcome a filibuster... Mr. Trump is doing neither himself nor his party any
favors in deep-sixing his best shot at fulfilling the core GOP promise of
border security.” – Kimberley Strassel, WSJ Editorial Board. Commentary at...
https://www.wsj.com/articles/the-gops-border-self-sabotage-immigration-c21d88c5?mod=opinion_recentauth_pos2
My cmt: Yup. If Republicans win the Senate with a veto
proof majority; retain the House; and win the Presidency, they can go on
offense on the Border Bill. Now, they should kick the field goal. As John Madden
said, “You can't win a game if
you don't score any points.”
MARKET REPORT / ANALYSIS
-Friday the S&P 500 rose about 0.6% to 5027.
-VIX rose about 1% to 12.93.
-The yield on the 10-year Treasury rose to 4.177%.
MY TRADING POSITIONS:
UWM – Added 1/22/2024.
XLK – Technology ETF (holding since the October 2022
lows).
INTC – Added 12/6/2023.
CRM – Added 1/22/2024
BA – Added 12/6/2023. I plan to hold Boeing for the time
being.
DWCPF - Dow Jones U.S. Completion Total Stock Market
Index. – Added 12/7/2023 when I sold the S&P 500. This is a large position
in my retirement account betting on Small Caps.
TODAY’S COMMENT:
We look at a Summary of indicators on Friday (about
50-indicators). These indicators tend to be both long-term and short-term, so
they are different than the 20 that I report on daily. The weekly rundown of
indicators remained Bullish this week: now 7-bear and 15-bull.
BULL SIGNS
-The smoothed advancing volume on the NYSE is rising.
-The 10-dMA percentage of issues advancing on
the NYSE (Breadth) is above 50%.
-The 50-dMA percentage of issues advancing on the NYSE
(Breadth) is above 50%.
-The
100-dMA percentage of issues advancing on the NYSE (Breadth) is above 50%
-MACD of S&P 500 price made a bullish crossover 22
Jan.
-Long-term new-high/new-low data.
-McClellan Oscillator.
-Slope of the 40-dMA of New-highs is rising.
-The graph of the 100-day Count (the 100-day sum of
up-days).
-On average, the size of up-moves has been larger than
the size of down-moves over the last month.
-There
was a high up-volume day on 21 December canceling the High down-volume day on
20 December. In addition, there were back-to-back, high up-volume days (80%+)
on the NYSE 13 & 14 Dec.
-S&P 500 spread vs. Utilities (XLU-ETF).
-The 5-10-20 Timer System is BUY.
-The short-term momentum is bullish.
-60% of the 15-ETFs that I track have been up over the
last 10-days. (45-55% is neutral.)
NEUTRAL
-There have been 2 Distribution Days since 19 Jan, but not
enough to send a signal.
-There have been 2 Statistically-Significant days (big
moves in price-volume) in the last 15-days.
-Sentiment. (Sentiment got very bearish recently due to
the continued march higher. Too much bearishness is bullish, but it is back to
neutral now.)
-Bollinger
Bands.
-The Bollinger Squeeze has cleared.
-Overbought/Oversold Index (Advance/Decline Ratio).
-The 50-dMA percentage of issues advancing on the NYSE
(Breadth) has not been below 50% for more than 3 days in a row.
-Issues advancing on the NYSE (Breadth) compared to the
S&P 500.
-6% of all issues traded on the NYSE made new, 52-week
highs when the S&P 500 made a new all-time-high, 2 February 2024. (There is
no bullish signal for this indicator.)
-The short-term, 10-day EMA, Fosback Hi-Low Logic Index.
-The long-term, 50-dEMA, Fosback Hi-Low Logic Index.
-There
was a New-high/New-low spread reversal on 4 October (based on std deviation of
spread). Expired
-There have been 14 up-days over the last 20 sessions.
-There have been 7 up-days over the last 10 sessions.
-RSI.
-The Calm-before-the-Storm/Panic Indicator flashed a top
warning signal 15 Sept., but it may well have been a bottom signal. - Expired
-VIX indicator.
-There was a Hindenburg Omen signal 6 Feb 2024 – expired.
The McClellan Oscillator turned positive 9 February.
-20 December there was a Bearish Outside Reversal Day,
but the S&P 500 closed above the high for 20 December, 4778, on 27 & 28
December so this one is now neutral.
-There was a Zweig Breadth Thrust 3 November. That’s a
rare, very-bullish sign, but the McClellan Oscillator turned negative ending
this signal.
BEAR SIGNS
-The S&P 500 is 12.5% above its 200-dMA. (The Bear
indicator is 12% above the 200-day.)
-MACD of the percentage of issues advancing on the NYSE
(breadth) made a bearish crossover 12 January.
-Smoothed
Buying Pressure minus Selling Pressure.
-My Money Trend indicator.
-Short-term new-high/new-low data.
-The Smart Money (late-day action).
-XLI-ETF (Cyclical Industrials) vs the S&P 500.
On Monday’s update of the Friday Summary of indicators (20
December 2021), 9 days before the top of the 2-year long 25% correction, there
were 21 bear-signs and zero bull-signs. Now there are 7 bear-signs and 15-Bull.
Last week, there were 5 bear-sign and 18 bull-signs.
The daily spread of 20 short-term Indicators (Bulls minus
Bears) declined from +4 to +1 (a positive number is bullish; negatives
are bearish); the 10-day smoothed sum that smooths the daily fluctuations declined
from +23 to +20. (The trend direction is more important than the actual number
for the 10-day value.) These numbers sometimes change after I post the blog
based on data that comes in late. Most of these 20 indicators are short-term so
they tend to bounce around a lot.
LONG-TERM INDICATOR: The Long Term NTSM indicator improved
to BUY: PRICE & VOLUME are bullish; SENTIMENT & VIX are neutral.
(One warning: The Long-Term Indicator is not a good
top-indicator. It can signal BUY at a top.)
(The important major BUY in this indicator was on 21
October 2022, 7-days after the bear-market bottom. For my NTSM overall signal,
I suggested that a short-term buying opportunity occurred on 27 September
(based on improved market internals on the retest), although without market
follow-thru, I was unwilling to call a buy; however, I did close shorts and
increased stock holdings. I issued a Buy-Signal on 4 October, 6-days before the
final bottom, based on stronger market action that confirmed the market
internals signal. The NTSM sell-signal was issued 21 December, 9 sessions
before the high of this recent bear market, based on the bearish “Friday Rundown”
of indicators.)
BOTTOM LINE
I remain bullish.
I am closely watching indicators.
ETF - MOMENTUM ANALYSIS:
TODAY’S RANKING OF 15 ETFs (Ranked Daily)
ETF ranking follows:
The top ranked ETF receives
100%. The rest are then ranked based on their momentum relative to the leading
ETF.
*For additional background on
the ETF ranking system see NTSM Page at…
http://navigatethestockmarket.blogspot.com/p/exchange-traded-funds-etf-ranking.html
DOW STOCKS - TODAY’S MOMENTUM RANKING
OF THE DOW 30 STOCKS (Ranked Daily)
DOW 30 momentum ranking
follows:
The top ranked Stock receives
100%. The rest are then ranked based on their momentum relative to the leading Stock.
For more details, see NTSM
Page at…
https://navigatethestockmarket.blogspot.com/p/a-system-for-trading-dow-30-stocks-my_8.html
FRIDAY MARKET INTERNALS
(NYSE DATA)
My basket of Market Internals slipped to HOLD. (My basket of Market
Internals is a decent trend-following analysis of current market action, but
should not be used alone for short term trading. They are most useful when they
diverge from the Index.)
...My current invested
position is about 65% stocks, including stock mutual funds and ETFs. I’m
usually about 50% invested in stocks. I’m “over invested” now expecting
continuation of bullish market action.
I trade about 15-20% of the total portfolio using the
momentum-based analysis I provide here. When I see a definitive bottom, I add a
lot more stocks to the portfolio using an S&P 500 ETF as I did back in
October.