Friday, October 22, 2021

IHS Markit Composite PMI … Coronavirus (Covid-19) … Stock Market Analysis … ETF Trading … Dow 30 Ranking

“Trade what you see; not what you think.” – The Old Fool, Richard McCranie, trader extraordinaire.


IHS MARKIT COMPOSITE  PMI (Markit Economics)

“Adjusted for seasonal factors, the IHS Markit Flash U.S. Composite PMI Output Index posted 57.3 in October, rising from 55.0 in September to signal the fastest uplift in activity for three months and one that was sharp overall. Stronger growth was driven by the services sector, which registered the quickest rate of expansion since July. Meanwhile, the latest rise in factory production was the softest since July 2020 and only mild, as goods producers continued to be severely hampered by material shortages and supply chain delays.” Report at...

https://www.markiteconomics.com/Public/Home/PressRelease/291a6f7539534735b69350b6e4e0f921


CORONAVIRUS (NTSM)

Here’s the latest from the COVID19 Johns Hopkins website as of 4:30 PM Friday. U.S. total case numbers are on the left axis; daily numbers are on the right side of the graph in Red with the 10-dMA of daily numbers in Green. I added the smoothed 10-dMA of new cases (in purple) to the chart.


I noted that almost 15% of the entire US population has had Covid. Actually, that counts only those who went to a doctor.  The actual number is at least twice as high due to mild cases and those asymptomatic. We can probably safely say that one-third of the US population has had Covid.


MARKET REPORT / ANALYSIS

-Friday the S&P 500 slipped about 0.1% to 4545.

-VIX rose about 3% to 15.43.

-The yield on the 10-year Treasury slipped to 1.636%.


The Friday run-down of some important indicators remains well to the bull side (3-bear and 15-bull). These indicators tend to be both long-term and short-term, so they are different than the 20 that I report on daily. Details follow:


BULL SIGNS

-The 10-dMA % of issues advancing on the NYSE (Breadth) is above 50%.

-The 50-dMA % of issues advancing on the NYSE (Breadth) is above 50%.

-The 100-dMA % of issues advancing on the NYSE (Breadth) is above 50%.

-Non-crash Sentiment indicator has turned bearish and that is a bullish signal.

-MACD of the percentage of issues advancing on the NYSE (breadth) made a bullish crossover 23 September.

-MACD of S&P 500 price made a bullish crossover, 13 October.

-McClellan Oscillator.

-Short-term new-high/new-low data is trending higher.

-Long-term new-high/new-lows are rising.

-Slope of the 40-dMA of New-highs is up. This is one of my favorite trend indicators.

-The Smart Money (late-day action) indicates the Pros are leaning bullish. (This indicator is based on the Smart Money Indicator developed by Don Hayes).

-Cyclical Industrials (XLI-ETF) are under-performing the S&P 500, but the curve is sharply rising so this goes in the bull category.

-The 5-10-20 Timer System is BUY; the 5-dEMA and 10-dEMA are both above the 20-dEMA.

-The S&P 500 is out-performing the Utilities ETF (XLU).

-63% of the 15-ETFs that I track have been up over the last 10-days.


NEUTRAL

-There was a Hindenburg Omen signal 28 September.  The McClellan Oscillator turned positive afterward, so the Omen has been cancelled.

-There have been 2 Statistically-Significant days in the last 15-days – too low to send a signal. This can be a bull or bear.

-Bollinger Bands

-Breadth on the NYSE compared to the S&P 500 index is neutral.

-The size of up-moves has been smaller than the size of down-moves over the last month, but not quite enough to give a signal.

-The S&P 500 is 8.5% above its 200-dMA (Bear indicator is 12%.). This value was 15.9% above the 200-dMA when the 10% correction occurred in Sep 2020.

-Calm-before-the-Storm Indicator – expired.

-The Fosback High-Low Logic Index is neutral.

-There have been 11 up-days over the last 20 days. Neutral

-There have been 7 up-days over the last 10-days. Neutral

-5.1% of all issues traded on the NYSE made new, 52-week highs when the S&P 500 made a new all-time-high 21 October. (There is no bullish signal for this indicator.) This is above the average for all-time highs and suggests that if we do have a pullback, it is likely to be less than 10%.

-Statistically, the S&P 500 gave a panic-signal 17 Sept. Signal has expired.

-14 October, the 52-week, New-high/new-low ratio improved by 0.45 standard deviations, somewhat bullish, but neutral.

-Distribution Days.  There had been 7 in the last 25-days. The Index almost had a Follow-Through-Day 14 Oct – well...let’s just say it was close enough to cancel the Distribution Days. Since the Follow-thru day was not clear cut, I’ll include it in the Neutral category.

-VIX is falling, but not enough to send a  signal.


BEAR SIGNS

-Overbought/Oversold Index (Advance/Decline Ratio) is overbought.

-My Money Trend indicator turned down.

-RSI.

-The smoothed advancing volume on the NYSE is falling.


On Friday, 21 February, 2 days after the top of the Coronavirus pullback, there were 10 bear-signs and 1 bull-sign. Now there are 3 bear-signs and 15 bull-signs. Last week, there were 2 bear-signs and 16 bull-signs.


The daily sum of 20 Indicators slipped from +3 to +1 (a positive number is bullish; negatives are bearish); the 10-day smoothed sum that smooths the daily fluctuations slipped from +45 to +44 (These numbers sometimes change after I post the blog based on data that comes in late.) Most of these indicators are short-term and many are trend following.


The Long Term NTSM indicator ensemble remained BUY. Volume and Sentiment are bullish; Price and VIX indicators are neutral.


Nice to finally see a down day to take a little of the froth out of the market in the short-term. For now, I remain bullish. 


MOMENTUM ANALYSIS:

TODAY’S RANKING OF 15 ETFs (Ranked Daily)

The top ranked ETF receives 100%. The rest are then ranked based on their momentum relative to the leading

ETF.

*For additional background on the ETF ranking system see NTSM Page at…

http://navigatethestockmarket.blogspot.com/p/exchange-traded-funds-etf-ranking.html


TODAY’S RANKING OF THE DOW 30 STOCKS (Ranked Daily)

Here’s the revised DOW 30 and its momentum analysis. The top ranked stock receives 100%. The rest are then ranked based on their momentum relative to the leading stock.

For more details, see NTSM Page at…

https://navigatethestockmarket.blogspot.com/p/a-system-for-trading-dow-30-stocks-my_8.html


FRIDAY MARKET INTERNALS (NYSE DATA)

Market Internals remained NEUTRAL.


Market Internals are a decent trend-following analysis of current market action, but should not be used alone for short term trading. They are usually right, but they are often late.  They are most useful when they diverge from the Index. 


My stock-allocation in the portfolio is now about 65% invested in stocks; this is above my “normal” fully invested stock-allocation of 50% stocks. Indicators are very bullish, so I am holding a short-term position in additional Index Funds to boost returns.


You may wish to have a higher or lower % invested in stocks depending on your risk tolerance. 50% is a conservative position that I consider fully invested for most retirees.


As a general rule, some suggest that the % of portfolio invested in the stock market should be one’s age subtracted from 100.  So, a 30-year-old person would have 70% of the portfolio in stocks, stock mutual funds and/or stock ETFs.  That’s ok, but for older investors, I usually don’t recommend keeping less than 50% invested in stocks (as a fully invested position) since most people need some growth in the portfolio to keep up with inflation.

Thursday, October 21, 2021

Jobless Claims ... Philadelphia FED Index ... Leading Economic Indicators ... Existing Home Sales … Coronavirus (Covid-19) … Stock Market Analysis … ETF Trading … Dow 30 Ranking

“Trade what you see; not what you think.” – The Old Fool, Richard McCranie, trader extraordinaire.


JOBLESS CLAIMS (Fox Business)

“The number of Americans filing for unemployment benefits slipped to a pandemic-era low last week as more workers found jobs following the expiration of supplemental payments. Data released Thursday by the Labor Department showed initial jobless claims in the week ended Oct. 16 fell by 6,000 to 290,000...” Story at...

https://www.foxbusiness.com/economy/initial-jobless-claims-october-16


PHILADELPHIA FED INDEX (FX Street)

“The Federal Reserve Bank of Philadelphia reported on Thursday that the headline Manufacturing Activity Index of the Manufacturing Business Outlook Survey declined to 23.8 in October from 30.7 in September.” Story at...

https://www.fxstreet.com/news/us-philadelphia-fed-manufacturing-index-drops-to-238-in-october-vs-25-expected-202110211238


LEADING ECONOMIC INDICATORS (Conference Board via PR Newswire)

“The Conference Board Leading Economic Index® (LEI) for the U.S. increased by 0.2 percent in September to 117.5 (2016 = 100), following a 0.8 percent increase in August and a 0.9 percent increase in July. "The U.S. LEI rose again in September, though at a slower rate, suggesting the economy remains on a more moderate growth trajectory compared to the first half of the year," said Ataman Ozyildirim, Senior Director of Economic Research at The Conference Board.” Press release at...

https://www.prnewswire.com/news-releases/the-conference-board-leading-economic-index-lei-for-the-us-increased-in-september-301405875.html


EXISTING HOME SALES (YahooFinance)

“Existing home sales rose 7% to a seasonally adjusted 6.29 million units in September from a month earlier, according to the National Association of Realtors (NAR). The results outpaced analyst expectations...” Story at...

https://finance.yahoo.com/news/existing-home-sales-september-2021-140035537.html


CORONAVIRUS (NTSM)

Here’s the latest from the COVID19 Johns Hopkins website as of 10:30 PM Thursday. U.S. total case numbers are on the left axis; daily numbers are on the right side of the graph in Red with the 10-dMA of daily numbers in Green. I added the smoothed 10-dMA of new cases (in purple) to the chart.


Almost 15% of the entire US population has had Covid.


MARKET REPORT / ANALYSIS

-Thursday the S&P 500 rose about 0.3% to 4550.

-VIX dropped about 3% to 15.01.

-The yield on the 10-year Treasury rose to 1.702%.


Not much change today, but still no down day!


The S&P 500 made a new all-time high today. 5.1% of issues on the NYSE made new 52-week highs today. That’s below average, but nothing to worry about. I get concerned if this stat is too low because it would suggest that too few stocks are participating in the advance.


Today marks 7 days in a row that the S&P 500 finished in positive territory!  On longer terms, the numbers are not particularly bearish and haven’t changed – 12-days have been up over the last 20-days; and 7-days have been up over the last 10-days.


The daily sum of 20 Indicators slipped from +9 to +3 (a positive number is bullish; negatives are bearish); the 10-day smoothed sum that smooths the daily fluctuations improved from +37 to +45 (These numbers sometimes change after I post the blog based on data that comes in late.) Most of these indicators are short-term and many are trend following.


The Long Term NTSM indicator ensemble improved to BUY. Volume and Sentiment are bullish; Price and VIX indicators are neutral.


Markets are almost looking too bulish, but not quite. For now, I remain bullish. 


MOMENTUM ANALYSIS:

TODAY’S RANKING OF 15 ETFs (Ranked Daily)

The top ranked ETF receives 100%. The rest are then ranked based on their momentum relative to the leading

ETF.

*For additional background on the ETF ranking system see NTSM Page at…

http://navigatethestockmarket.blogspot.com/p/exchange-traded-funds-etf-ranking.html


I almost recommended Intel last week.  Glad I didn’t. It fell almost 9% after hours today on a poor earnings report.


TODAY’S RANKING OF THE DOW 30 STOCKS (Ranked Daily)

Here’s the revised DOW 30 and its momentum analysis. The top ranked stock receives 100%. The rest are then ranked based on their momentum relative to the leading stock.

For more details, see NTSM Page at…

https://navigatethestockmarket.blogspot.com/p/a-system-for-trading-dow-30-stocks-my_8.html


THURSDAY MARKET INTERNALS (NYSE DATA)

Market Internals slipped to NEUTRAL.


Market Internals are a decent trend-following analysis of current market action, but should not be used alone for short term trading. They are usually right, but they are often late.  They are most useful when they diverge from the Index. 


My stock-allocation in the portfolio is now about 65% invested in stocks; this is above my “normal” fully invested stock-allocation of 50% stocks. Indicators are very bullish, so I am holding a short-term position in additional Index Funds to boost returns.


You may wish to have a higher or lower % invested in stocks depending on your risk tolerance. 50% is a conservative position that I consider fully invested for most retirees.


As a general rule, some suggest that the % of portfolio invested in the stock market should be one’s age subtracted from 100.  So, a 30-year-old person would have 70% of the portfolio in stocks, stock mutual funds and/or stock ETFs.  That’s ok, but for older investors, I usually don’t recommend keeping less than 50% invested in stocks (as a fully invested position) since most people need some growth in the portfolio to keep up with inflation.

Wednesday, October 20, 2021

Fed Beige Book ... EIA Crude Inventories ... Inflation is a Threat … Coronavirus (Covid-19) … Stock Market Analysis … ETF Trading … Dow 30 Ranking

“Trade what you see; not what you think.” – The Old Fool, Richard McCranie, trader extraordinaire.


FED BEIGE BOOK (Federal Reserve)

“Economic activity grew at a modest to moderate rate, according to the majority of Federal Reserve Districts. Several Districts noted, however, that the pace of growth slowed this period, constrained by supply chain disruptions, labor shortages, and uncertainty around the Delta variant of COVID-19... Outlooks for near-term economic activity remained positive, overall, but some Districts noted increased uncertainty and more cautious optimism than in previous months.” Report at...

https://www.federalreserve.gov/monetarypolicy/beigebook202110.htm


EIA CRUDE OIL INVENTORIES (EIA)

“U.S. commercial crude oil inventories (excluding those in the Strategic Petroleum Reserve) decreased by 0.4 million barrels from the previous week. At 426.5 million barrels, U.S. crude oil inventories are about 6% below the five year average for this time of year.” Story at...

https://ir.eia.gov/wpsr/wpsrsummary.pdf


INFLATION POSES A REAL THREAT TO STOCKS (Real Investment Advice)

“Persistent Inflation Poses a Real Threat to Stock Prices...

...The Fed is running policy as if the economy were in a depression when it is booming. More inflation is probable, at least in the short run, and we best appreciate how inflation can wreak havoc on stock prices.

Given record profit margins and valuations, there appears little upside, especially if inflation remains problematic. Throw stagflation into the formula, and the outlook is bleak.

We urge you carefully consider the risks and rewards in various inflation environments and trade accordingly. This time is different!

https://realinvestmentadvice.com/persistent-inflation-poses-a-real-threat-to-stock-prices


CORONAVIRUS (NTSM)

Here’s the latest from the COVID19 Johns Hopkins website as of 4:30 PM Wednesday. U.S. total case numbers are on the left axis; daily numbers are on the right side of the graph in Red with the 10-dMA of daily numbers in Green. I added the smoothed 10-dMA of new cases (in purple) to the chart.


Almost 15% of the entire US population has had Covid.


MARKET REPORT / ANALYSIS

-Wednesday the S&P 500 rose about 0.4% to 4536.

-VIX dropped about 1% to 15.50.

-The yield on the 10-year Treasury rose to 1.660%.


The S&P 500 came within a point or two of an all-time high today. It wasn’t hard – the Index only dropped about 5% from its prior all-time high on 2 September. Although the pullback wasn’t large, it was about average length for a real correction. Now, we have screaming bullishness; however, there are a few bear signs cropping up.


Bear signs:

-Overbought/oversold ratio is “overbought”.

-Bollinger Bands are within a whisker of “overbought,” but without confirmation from RSI I usualy don’t pay attention to this indicator anyway.  RSI is high but not overbought yet.

-Utilities (XLU-ETF) have been outperforming the S&P 500 index recently and on a longer term measure, the trend is toward the bear side. If this keeps up it would be quite bearsish.


Today marks 6 days in a row that the S&P 500 finished in positive territory!  On longer terms, the numbers are not particularly bearish – 12-days have been up over the last 20-days; and 7-days have been up over the last 10-days. Will the markets go up forever? Doubtful. As I have said for several days, I expect a down-day tomorrow.


The daily sum of 20 Indicators improved from +6 to +9 (a positive number is bullish; negatives are bearish); the 10-day smoothed sum that smooths the daily fluctuations improved from +23 to +37 (These numbers sometimes change after I post the blog based on data that comes in late.) Most of these indicators are short-term and many are trend following.


The Long Term NTSM indicator ensemble remained HOLD (but it was almost a buy). Volume is bullish; Price, VIX and & Sentiment indicators are neutral. Surprisingly, sentiment is nearly a buy since Rydex traders have gotten bearish. I’d hate to be betting against this market.  I think they are counting up-days betting that the market can’t go up forever. Sooner or later they’ll be right.


I remain bullish. 


MOMENTUM ANALYSIS:

TODAY’S RANKING OF 15 ETFs (Ranked Daily)

The top ranked ETF receives 100%. The rest are then ranked based on their momentum relative to the leading

ETF.

*For additional background on the ETF ranking system see NTSM Page at…

http://navigatethestockmarket.blogspot.com/p/exchange-traded-funds-etf-ranking.html


TODAY’S RANKING OF THE DOW 30 STOCKS (Ranked Daily)

Here’s the revised DOW 30 and its momentum analysis. The top ranked stock receives 100%. The rest are then ranked based on their momentum relative to the leading stock.

For more details, see NTSM Page at…

https://navigatethestockmarket.blogspot.com/p/a-system-for-trading-dow-30-stocks-my_8.html


WEDNESDAY MARKET INTERNALS (NYSE DATA)

Market Internals remained BULLISH on the market.


Market Internals are a decent trend-following analysis of current market action, but should not be used alone for short term trading. They are usually right, but they are often late.  They are most useful when they diverge from the Index. 


My stock-allocation in the portfolio is now about 65% invested in stocks; this is above my “normal” fully invested stock-allocation of 50% stocks. Indicators are very bullish, so I am holding a short-term position in additional Index Funds to boost returns.


You may wish to have a higher or lower % invested in stocks depending on your risk tolerance. 50% is a conservative position that I consider fully invested for most retirees.


As a general rule, some suggest that the % of portfolio invested in the stock market should be one’s age subtracted from 100.  So, a 30-year-old person would have 70% of the portfolio in stocks, stock mutual funds and/or stock ETFs.  That’s ok, but for older investors, I usually don’t recommend keeping less than 50% invested in stocks (as a fully invested position) since most people need some growth in the portfolio to keep up with inflation.
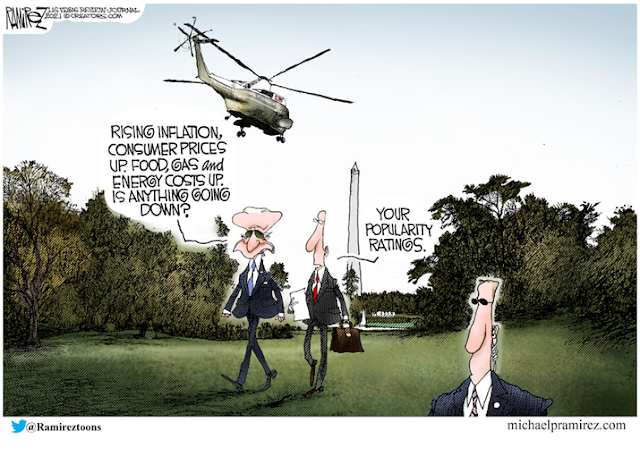
Tuesday, October 19, 2021

Housing Starts / Building Permits … Coronavirus (Covid-19) … Stock Market Analysis … ETF Trading … Dow 30 Ranking

“Trade what you see; not what you think.” – The Old Fool, Richard McCranie, trader extraordinaire.


HOUSING STARTS / BUILDING PERMITS (YahooFinance/Reuters))

“U.S. homebuilding unexpectedly fell in September and permits dropped to a one-year low amid acute shortages of raw materials and labor, strengthening expectations that economic growth slowed sharply in the third quarter.” Story at...

https://finance.yahoo.com/news/u-housing-starts-permits-tumble-123711801.html


THE DISMAL TRUTH ABOUT THE CRUSADE AGAINST CLIMATE CHANGE (ZeroHedge)

“Last week, Bank of America sparked a firestorm of reaction amid both the pro and contra climate change camps...The bottom line: no less than a stunning $150 trillion in new capital investment would be required to reach a "net zero" world over 30 years - equating to some $5 trillion in annual investments - and amounting to twice current global GDP. Needless to say, the private sector has nowhere near the capital required to complete this investment which is why...the bill would have to be footed by central banks in the form of tens of trillions in QE.” Story at...

https://www.zerohedge.com/energy/one-bank-reveals-dismal-truth-about-150-trillion-crusade-against-climate-change

My cmt: Spending such large sums by QE would lead to massive inflation. In the climate change book, “Unsettled”, Steven Koonin, PhD, concluded that a combination of strategies would be required: making smaller reductions to CO2 outputs; adapting to the changed conditions; and, if necessary, changing the reflectivity of the Earth. That last one seems like a crazy idea, but it is technically the easiest. Putting additives in fuels would reflect more sunlight and cool the planet. The problem is that some areas might benefit, while others would be harmed. How would equity be achieved?


CORONAVIRUS (NTSM)

Here’s the latest from the COVID19 Johns Hopkins website as of 4:30 PM Tuesday. U.S. total case numbers are on the left axis; daily numbers are on the right side of the graph in Red with the 10-dMA of daily numbers in Green. I added the smoothed 10-dMA of new cases (in purple) to the chart.


Almost 15% of the entire US population has had Covid.


MARKET REPORT / ANALYSIS

-Tuesday the S&P 500 rose about 0.7% to 4520.

-VIX dropped about 4% to 15.68.

-The yield on the 10-year Treasury rose to 1.663%.


I noted yesterday that I didn’t see any bear indicators and that wouldn’t last long.  Well, it didn’t. Bollinger Bands are “overbought,” but without confirmation from RSI I usually don’t pay attention to this indicator.  It is not surprising considering the level of bullishness the markets are showing. 


Today was the fifth day in a row that the S&P 500 finished in positive territory.  That’s unusual and a lot of bears got burned today betting on a down-day in the Rydex funds I track for sentiment. On longer terms, the numbers are not particularly bearish – 12-days have been up over the last 20-days; and 6-days have been up over the last 10-days. Still, I would expect a down-day tomorrow.


The daily sum of 20 Indicators slipped from +10 to +6 (a positive number is bullish; negatives are bearish); the 10-day smoothed sum that smooths the daily fluctuations improved from +19 to +23 (These numbers sometimes change after I post the blog based on data that comes in late.) Most of these indicators are short-term and many are trend following.


The Long Term NTSM indicator ensemble slipped to HOLD (but it was almost a buy). Volume is bullish; Price, VIX and & Sentiment indicators are neutral.


I remain bullish. 


MOMENTUM ANALYSIS:

TODAY’S RANKING OF 15 ETFs (Ranked Daily)

The top ranked ETF receives 100%. The rest are then ranked based on their momentum relative to the leading

ETF.

*For additional background on the ETF ranking system see NTSM Page at…

http://navigatethestockmarket.blogspot.com/p/exchange-traded-funds-etf-ranking.html

TODAY’S RANKING OF THE DOW 30 STOCKS (Ranked Daily)

Here’s the revised DOW 30 and its momentum analysis. The top ranked stock receives 100%. The rest are then ranked based on their momentum relative to the leading stock.

For more details, see NTSM Page at…

https://navigatethestockmarket.blogspot.com/p/a-system-for-trading-dow-30-stocks-my_8.html


TUESDAY MARKET INTERNALS (NYSE DATA)

Market Internals remained BULLISH on the market.


Market Internals are a decent trend-following analysis of current market action, but should not be used alone for short term trading. They are usually right, but they are often late.  They are most useful when they diverge from the Index. 


My stock-allocation in the portfolio is now about 65% invested in stocks; this is above my “normal” fully invested stock-allocation of 50% stocks. Indicators are very bullish, so I am taking a short-term position in additional stocks to boost returns.


You may wish to have a higher or lower % invested in stocks depending on your risk tolerance. 50% is a conservative position that I consider fully invested for most retirees.


As a general rule, some suggest that the % of portfolio invested in the stock market should be one’s age subtracted from 100.  So, a 30-year-old person would have 70% of the portfolio in stocks, stock mutual funds and/or stock ETFs.  That’s ok, but for older investors, I usually don’t recommend keeping less than 50% invested in stocks (as a fully invested position) since most people need some growth in the portfolio to keep up with inflation.


Monday, October 18, 2021

Industrial Production … Coronavirus (Covid-19) … Stock Market Analysis … ETF Trading … Dow 30 Ranking

“Trade what you see; not what you think.” – The Old Fool, Richard McCranie, trader extraordinaire.


5 MB HARD DRIVE - 1956

My laptop has about 100,000 times more storage. Amazing.


INDUSTRIAL PRODUCTION (WSJ)

“Industrial production in the U.S. declined in September as supply-chain disruptions in the auto industry and lingering effects of Hurricane Ida weighed on manufacturing and mining output during the month.

Industrial production—which includes output at factory, mining and utility companies—fell at a seasonally adjusted 1.3% in September...” Story at...

https://www.wsj.com/articles/auto-supply-constraints-weighed-on-septembers-industrial-production-11634574392


REGARDING COLIN POWELL’S COVID DEATH WHILE VACCINATED

Colin Powell had multiple myeloma, a cancer of a type of white blood cell, which can harm the body's immune system. Here’s an article from the Leukemia-Lymphoma Society on the subject of blood cancers and Covid.

“About one in four blood cancer patients fail to produce detectable antibodies after COVID-19 vaccination, but results vary substantially by type of blood cancer, according to a new study from The Leukemia & Lymphoma Society (LLS) that was published today in the journal Cancer Cell (see full paper and tables).” Story at...

https://www.lls.org/news/study-leukemia-lymphoma-society-shows-covid-19-vaccine-safe-25-blood-cancer-patients-do-not

The numbers are much worse for patients treated with certain cancer drugs that affect B-cells.  80% of CLL patients treated with Rituxan had no detectable anti-bodies if treated in the previous 2 years.


CORONAVIRUS (NTSM)

Here’s the latest from the COVID19 Johns Hopkins website as of 5:00 PM Monday. U.S. total case numbers are on the left axis; daily numbers are on the right side of the graph in Red with the 10-dMA of daily numbers in Green. I added the smoothed 10-dMA of new cases (in purple) to the chart.


MARKET REPORT / ANALYSIS

-Monday the S&P 500 rose about 0.3% to 4486.

-VIX rose about 1% to 16.31.

-The yield on the 10-year Treasury rose to 1.596%.


More Bull signs are popping up. 

-The 5-10-20 Timer System switched to BUY. The 5-dEMA and 10-dEMA are both above the 20-dEMA.

-The size of up-moves has been bigger than the size of down-moves over the last month, and this indicator has switched to Buy.

-I’d probably add that a follow-through day did occur 14 October. It was very close when I looked at it earlier; but if I assume “close enough,” that would cancel the Distribution Days I noted on Friday.

-The overbought/oversold ratio is neutral today. 


These changes show that currently I have NO bear signals! That won’t last long, but the markets look very bullish right now.


The daily sum of 20 Indicators rose from +9 to +10 (a positive number is bullish; negatives are bearish); the 10-day smoothed sum that smooths the daily fluctuations improved from +10 to +19 (These numbers sometimes change after I post the blog based on data that comes in late.) Most of these indicators are short-term and many are trend following.


The Long Term NTSM indicator ensemble improved to BUY. Volume and Price are bullish; VIX and & Sentiment indicators are neutral.


I am bullish.  As previously noted, it’s hard not be with the Friday rundown of indicators looking so bullish.


MOMENTUM ANALYSIS:

TODAY’S RANKING OF 15 ETFs (Ranked Daily)

The top ranked ETF receives 100%. The rest are then ranked based on their momentum relative to the leading

ETF.

*For additional background on the ETF ranking system see NTSM Page at…

http://navigatethestockmarket.blogspot.com/p/exchange-traded-funds-etf-ranking.html


TODAY’S RANKING OF THE DOW 30 STOCKS (Ranked Daily)

Here’s the revised DOW 30 and its momentum analysis. The top ranked stock receives 100%. The rest are then ranked based on their momentum relative to the leading stock.

For more details, see NTSM Page at…

https://navigatethestockmarket.blogspot.com/p/a-system-for-trading-dow-30-stocks-my_8.html


MONDAY MARKET INTERNALS (NYSE DATA)

Market Internals remained BULLISH on the market.


Market Internals are a decent trend-following analysis of current market action, but should not be used alone for short term trading. They are usually right, but they are often late.  They are most useful when they diverge from the Index. 


My stock-allocation in the portfolio is now about 65% invested in stocks; this is above my “normal” fully invested stock-allocation of 50% stocks. See my previous post for reasons.


You may wish to have a higher or lower % invested in stocks depending on your risk tolerance. 50% is a conservative position that I consider fully invested for most retirees.


As a general rule, some suggest that the % of portfolio invested in the stock market should be one’s age subtracted from 100.  So, a 30-year-old person would have 70% of the portfolio in stocks, stock mutual funds and/or stock ETFs.  That’s ok, but for older investors, I usually don’t recommend keeping less than 50% invested in stocks (as a fully invested position) since most people need some growth in the portfolio to keep up with inflation.