“Trade what you see; not what you think.” – The Old Fool, Richard McCranie, trader extraordinaire.
“A watchdog organization with a focus on higher education released video this week showing an operative from an outside communist group taking part in an anti-Israel protest on the campus of the University of California, Los Angeles. ‘I'm a revolutionary organizer,’ a woman named ‘Annie’ tells an undercover journalist with Accuracy in Media in a video released on Wednesday. ‘I'm an outside agitator,’ she adds with a smile…’We're a little bit different because we're about getting organized for an actual revolution.’ Revcom, led by political activist Bob Avakian, is described by Influence Watch...continues to spread its message of communist ideas and replacing the government system in the United States." Story at...
'An actual revolution': Communist Party organizer reveals true mission at UCLA anti-Israel rally (msn.com)
"Inflation eased slightly in April, providing at least a bit of relief for consumers while still holding above levels that would suggest a cut in interest rates is imminent. The consumer price index, a broad measure of how much goods and services cost at the cash register, increased 0.3% from March... On a 12-month basis, however, the CPI increased 3.4%, in line with expectations...” Story at...
https://www.cnbc.com/2024/05/15/cpi-inflation-april-2024-consumer-prices-rose-0point3percent-in-april.html
Core CPI came in as expected.
“The US consumer showed signs of slowing in April. Retail sales were flat in the month, according to data from the Commerce Department, furthering concerns about the state of the consumer amid sticky inflation and higher interest rates." Story at...
https://finance.yahoo.com/news/retail-sales-flat-in-april-falling-short-of-wall-streets-expectations-123315122.html
Sales were below expectations.
“Business activity continued to decline in New York State, according to firms responding to the May 2024 Empire State Manufacturing Survey. The headline general business conditions index was little changed at -15.6. New orders declined significantly, while shipments held steady. Unfilled orders continued to decline. Delivery times shortened, and inventories were little changed. Labor market conditions remained weak, with employment and hours worked continuing to move lower. The pace of input and selling price increases moderated slightly. Though firms expect conditions to improve over the next six months, optimism was subdued.” Report at...
https://www.newyorkfed.org/survey/empire/empiresurvey_overview
“U.S. commercial crude oil inventories (excluding those in the Strategic Petroleum Reserve) decreased by 2.5 million barrels from the previous week. At 457.0 million barrels, U.S. crude oil inventories are about 4% below the five-year average for this time of year.” Report at...
https://ir.eia.gov/wpsr/wpsrsummary.pdf
This report shows strong demand continues for crude suggesting continued pricing strength.
-Wednesday the S&P 500 rose about 1.2% to 5308.
-VIX declined about 7% to 12.45.
-The yield on the 10-year Treasury declined to 4.342%.
UWM – Added 5/2/2024
QLD – Added 4/29/2024
SSO – Added 4/29/2024.
XLE – Added 4/24/2024
CRM – Added 1/22/2024.
“The Dow Jones U.S. Completion Total Stock Market Index, also known as the DWCPF, is a widely used financial index that provides a comprehensive measure of the US equity market. The DWCPF includes all US stocks that are not included in the Dow Jones US Total Stock Market Index, which comprises large-cap and mid-cap companies. As a result, the DWCPF provides a complete picture of the US stock market, including small-cap and micro-cap companies, which are often overlooked by other indexes.” From...
https://fi.money/blog/posts/what-is-dow-jones-u-s-completion-total-stock-market-index-dwcpf
The Bull/Bear Spread (Bull Indicators minus Bear Indicators) remained bullish at 7 Bear-signs and 18-Bull. (The rest are neutral. It is normal to have a lot of neutral indicators since many of those are top or bottom indicators that will signal only at extremes.) The 10-dMA of spread (purple line in the chart below) continues to improve, a bullish sign.
TODAY’S COMMENT:
It didn’t take long for the S&P 500 to make new highs. Wednesday, the S&P 500 made an all-time high about 1% higher than the March high. 10.1% of issues on the NYSE made new 52-week, all-time highs Wednesday. The average number for this stat is about 6.7% so this indicates that the advance has been healthy so far. If there were to be a correction now (and I am not predicting one), it is likely that it would be a normal, less than a 10% pullback.
(The Long-Term Indicator is not a good top-indicator. It can signal BUY at a top.)
I am bullish.
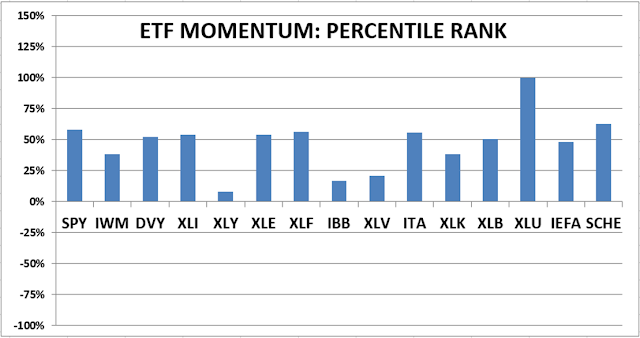
TODAY’S RANKING OF 15 ETFs (Ranked Daily) ETF ranking follows:
The top ranked ETF receives 100%. The rest are then ranked based on their momentum relative to the leading ETF.
*For additional background on the ETF ranking system see NTSM Page at…
http://navigatethestockmarket.blogspot.com/p/exchange-traded-funds-etf-ranking.html
I forgot to update this chart yesterday, but below is Friday’s chart. DOW 30 momentum ranking follows:
The top ranked Stock receives 100%. The rest are then ranked based on their momentum relative to the leading Stock.
For more details, see NTSM Page at…
https://navigatethestockmarket.blogspot.com/p/a-system-for-trading-dow-30-stocks-my_8.html
My basket of Market Internals remained BUY. (My basket of Market Internals is a decent trend-following analysis of current market action, but should not be used alone for short term trading. They are most useful when they diverge from the Index.)


