“Trade what you see; not what you think.” – The Old Fool,
Richard McCranie, trader extraordinaire.
“For decades we disagreed with [Supreme] Court rulings
when progressives held sway, but we never called the Court illegitimate. But
now that the left has lost the Court as a backup legislature for its policy
goals, the institution is supposedly broken. Tell us again who is the threat to
democratic institutions?” – WSJ Editorial Board.
A RALLY LASTING FOR MONTHS (msn.com)
“...stocks could rally for another few months before
hitting a bottom. Better-than-expected earnings this quarter are masking the
pain to come for the stock market, according to Morgan Stanley's top stock
picker.” Story at...
The
stock market could rally for another few months as upbeat earnings mask the
pain to come in 2023, Morgan Stanley's Mike Wilson says (msn.com)
My cmt: There is a possibility that the markets might get
back to old highs. In any event, further declines are always possible. Timing
is the issue. In 1998, there was a 20% correction that ended in August. A year
and a half later the stock market fell into one of its largest declines as the
dot.com bubble burst. Are declines coming this January...or 2 years from now?
FACTSET EARNINGS INSIGHT - EXCERPT (FactSet)
“On a year-over-year basis, the S&P 500 is reporting
its lowest earnings growth since Q3 2020. Overall, 20% of the companies in the
S&P 500 have reported actual results for Q3 2022 to date. Of these
companies, 72% have reported actual EPS above estimates, which is below the
5-year average of 77% and below the 10-year average of 73%. In aggregate,
companies are reporting earnings that are 2.3% above estimates, which is below
the 5-year average of 8.7% and below the 10-year average of 6.5%.” Report at...
https://insight.factset.com/sp-500-earnings-season-update-october-21-2022
MARKET REPORT / ANALYSIS
-Friday the S&P 500 rose about 2.4% to 3753.
-VIX dipped about 1% to 29.69. (Not much for a 2.4% gain
on the S&P 500.)
-The yield on the 10-year Treasury slipped to 4.228%.
PULLBACK DATA:
-Drop from Top: 21.8% as of today. 25.4% max (on a
closing basis).
-Trading Days since Top: 199-days.
The S&P 500 is 9.2% Below its 200-dMA & 3.5%
Below its 50-dMA.
*I won’t call the correction over until the S&P 500
makes a new-high; however, evidence suggests the bottom was / is in the 3600
area and I am fully invested with a higher percentage of stocks than normal.
MY TRADING POSITIONS:
XLI – Industrial ETF
QLD – 2x Nas 100
DDM – 2x Dow 30
XLK – Technology ETF
CVX – (I may hold this as a long-term position. I already
owned a small position in CVX.)
SPY – S&P 500 (This is really a long-term position.)
IWM - Russell 2000. (This is really a long-term
position.)
TODAY’S COMMENT:
10-dMA of Breadth (% of stocks advancing on NYSE)
improved today to 48%. That needs to
continue. We really need to see the 100-dMA move above 50%. That would be strong evidence of an end to
the Bear Market. We’d also need to see
the S&P 500 break above its 200-dMA.
There were some worrisome signs out there:
-There were few New-highs and a lot of new-lows.
-Friday, there was High unchanged volume.
-Today was a statistically significant up-day. That just means
that the price-volume move exceeded my statistical parameters. Statistics show
that a statistically-significant, up-day is followed by a down-day about 60% of
the time. Statistically-significant, up-days almost always coincide with tops,
but not all statistically-significant, up-days occur at tops. Today could be a
top, but there are no top indicators warning; further, I had a buy signal less
than a month ago so a top seems unlikely.
On the whole, indicators are bullish today.
On Fridays, I summarize a number of indicators to get a
weekly feel for trend. The Friday rundown of indicators improved and is now
bullish (10-bear and 18-bull). These indicators tend to be both long-term and
short-term, so they are different than the 20 that I report on daily.
BULL SIGNS
-MACD of S&P 500 price made a bullish crossover 13
Oct.
-14 October, the 52-week, New-high/new-low ratio improved by 3.5
standard deviations. More simply, the spread between new-highs and new-lows
improved by 716. That’s another solid bottom sign.
-Issues advancing on the NYSE (Breadth) compared to the
S&P 500 are bullish. (Breadth is ahead of the Index.)
-There have only been 7 up-days over the last 20
sessions.
-The longer-term, 50-dEMA, Fosback Hi-Low Logic Index is
Bullish.
-On average, the size of up-moves has been larger than
the size of down-moves over the last month.
-21 Oct was a Bullish Outside Reversal Day.
-Cyclical Industrials (XLI-ETF) are outpacing the S&P
500.
-17 and 18 Oct were back-to-back 80%+ up-volume days.
-S&P 500 is outperforming the Utilities (XLU).
-The smoothed advancing volume on the NYSE is rising.
-Smoothed Buying Pressure minus Selling Pressure is rising.
(There is a strong bullish divergence when today’s values
are compared to the June lows.)
-McClellan Oscillator.
-The Smart Money (late-day action). This suggests Pros are
buying.
-There
was a Follow-Thru Day 21 October that cancels prior Distribution Days.
-There have been 5 Statistically-Significant days (big
moves in price-volume) in the last 15-days. (The S&P 500 is comng off a bottom
and all of the days have been up.)
-My Money Trend indicator turned up today.
-Short-term new-high/new-low data.
NEUTRAL
-The S&P 500 is 9.2% below its 200-dMA. (Bull
indicator is 12% below the 200-day, although this is based on “normal”
pullbacks.)
-Bollinger Bands.
-RSI
-There have been 4 up-days over the last 10 sessions –
leaning bullish, but neutral.
-Overbought/Oversold Index (Advance/Decline Ratio).
-The short-term, 10-day, Fosback Hi-Low Logic Index.
-Sentiment.
-The Calm-before-the-Storm/Panic Indicator warned on 13
September - expired.
-There was an Inverse Zweig Breadth Collapse (negative
Breadth Thrust) 21 June. That’s a rare, very-bearish sign, but it was too long ago - expired.
-There was a Hindenburg Omen signal 8 April – it was
canceled when the McClellan Oscillator turned bullish.
-2.8% of all issues traded on the NYSE made new, 52-week
highs when the S&P 500 made a new all-time-high, 3 January. (There is no
bullish signal for this indicator.) This indicated that the advance was too
narrow and a correction was likely to be >10%. – It proved correct, but is
now Expired
- 51% of the 15-ETFs that I track have been up over the
last 10-days.
BEAR SIGNS
-The
10-dMA percentage of issues advancing on the NYSE (Breadth) is below 50%.
-The 50-dMA percentage of issues advancing on the NYSE
(Breadth) is below 50.
-The
100-dMA percentage of issues advancing on the NYSE (Breadth) is below 50%
-The 50-dMA percentage of issues advancing on the NYSE
(Breadth) has been below 50%, for 3 days in a row below 50% for my
“correction-now” signal. – It hardly matters now.
-Long-term new-high/new-low data.
-MACD of the percentage of issues advancing on the NYSE
(breadth) made a bearish crossover 30 Aug.
-The graph of the 100-day Count (the 100-day sum of
up-days) is falling.
-VIX is rising quickly.
-Slope of the 40-dMA of New-highs is falling.
-The 5-10-20 Timer System is SELL; the 5-dEMA and 10-dEMA
are both below the 20-dEMA. (The 5-day is below the 10-day so short-term
momentum is bearish too.)
On Friday, 21 February, 2 days after the top before the
Coronavirus pullback, there were 10 bear-signs and 1 bull-sign. Now there
are 10 bear-signs and 18-Bull. Last week, there were 15 bear-signs and 16
bull-signs. Friday indicators are leaning slightly to the bull side.
Today, the daily sum of 20 Indicators jumped from zero to
+11 (a positive number is bullish; negatives are bearish); the 10-day smoothed
sum that smooths the daily fluctuations improved from +46 to +53. (The trend
direction is more important than the actual number for the 10-day value.) These
numbers sometimes change after I post the blog based on data that comes in
late. Most of these 20 indicators are short-term so they tend to bounce
around a lot.
LONG-TERM INDICATOR: The Long
Term NTSM indicator remained to HOLD: VIX is bearish; PRICE & VOLUME are bullish;
SENTIMENT is neutral.
Bottom line: I’m a Bull: I’m now invested with about 75%
of the portfolio invested in stocks. (As a retiree, 50% invested in stocks is
my “normal” portfolio.) 75% stocks is uber-bullish and that’s as far as I’ll
go.
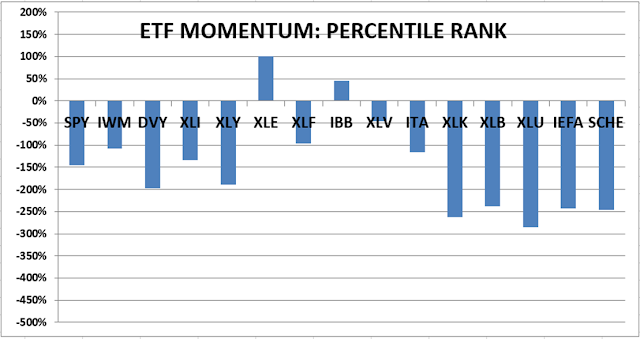
BEST ETFs - MOMENTUM ANALYSIS:
TODAY’S RANKING OF 15 ETFs
(Ranked Daily)
ETF ranking follows:
The top ranked ETF receives
100%. The rest are then ranked based on their momentum relative to the leading
ETF.
#1. XLE #2. ITA #3. IBB
*For additional background on
the ETF ranking system see NTSM Page at…
http://navigatethestockmarket.blogspot.com/p/exchange-traded-funds-etf-ranking.html
BEST DOW STOCKS - TODAY’S MOMENTUM
RANKING OF THE DOW 30 STOCKS (Ranked Daily)
DOW 30 momentum ranking
follows:
#1. CVX #2. MRK #3. AMGN
The top ranked Stock receives
100%. The rest are then ranked based on their momentum relative to the leading Stock.
For more details, see NTSM
Page at…
https://navigatethestockmarket.blogspot.com/p/a-system-for-trading-dow-30-stocks-my_8.html
FRIDAY MARKET INTERNALS (NYSE
DATA)
My basket of Market Internals remained SELL.
(Market Internals are a decent trend-following
analysis of current market action, but should not be used alone for short term
trading. They are most useful when they diverge from the Index.)
...My current invested
position is about 75% stocks, including stock mutual funds and ETFs. I’m
usually about 50% invested in stocks. I’ll cut back on stocks if we see serious
bear signs.
I trade about 15-20% of the
total portfolio using the momentum-based analysis I provide here. If I can see
a definitive bottom, I’ll add a lot more stocks to the portfolio using an
S&P 500 ETF.
“Trade what you see; not what you think.” – The Old Fool,
Richard McCranie, trader extraordinaire.
LEADING ECONOMIC INDEX (Conference Board vis prnewswire)
“The Conference Board Leading Economic
Index® (LEI) for the U.S. decreased by 0.4 percent in September 2022 to 115.9 (2016=100), after remaining
unchanged in August. The LEI is down 2.8 percent over the six-month period
between March and September 2022, a reversal
from its 1.4 percent growth over the previous six months. ‘The US LEI fell
again in September and its persistent downward trajectory in recent months
suggests a recession is increasingly likely before yearend,’ said Ataman
Ozyildirim, Senior Director, Economics, at The Conference Board.” Press release
at...
https://www.prnewswire.com/news-releases/the-conference-board-leading-economic-index-lei-for-the-us-declined-in-september-301654967.html
EXISTING HOME SALES (CNBC)
“Existing homes are selling at the slowest pace since
September 2012, with the exception of a brief drop at the start of the Covid 19
pandemic. Sales of previously owned homes fell 1.5% in September from
August...Sales were lower by 23.8% year-over-year. Sharply
higher mortgage rates are causing an abrupt slowdown in the
housing market.” Story at...
https://www.cnbc.com/2022/10/20/existing-home-sales-fall-to-a-10-year-low-in-september.html
JOBLESS CLAIMS (USNews)
“The number of Americans filing first-time claims for
unemployment benefits fell by 12,000 last week, the Labor Department reported
on Thursday. Claims totaled 214,000...” Story at...
https://www.usnews.com/news/economy/articles/2022-10-20/jobless-claims-fell-last-week
PHILADELPHIA FED INDEX (ShareCast)
“Manufacturing production in the Philadelphia region
deteriorated more than expected in October, according to a survey released on
Thursday. The Philadelphia Fed index for current manufacturing activity edged
up one point to -8.7, coming in below expectations for a reading of -5.0.” Story at...
https://www.sharecast.com/news/international-economic/philly-fed-index-ticks-up-but-remains-negative--11069240.html
MARKET REPORT / ANALYSIS
-Thursday the S&P 500 dipped about 0.8% to 3666.
-VIX bucked the trend and dipped about 2.5% to 29.98.
-The yield on the 10-year Treasury rose to 4.232%.
PULLBACK DATA:
-Drop from Top: 23.6% as of today. 25.4% max (on a
closing basis).
-Trading Days since Top: 199-days.
The S&P 500 is 11.4% Below its 200-dMA & 5.9%
Below its 50-dMA.
*I won’t call the correction over until the S&P 500
makes a new-high; however, evidence suggests the bottom was / is in the 3600
area and I am fully invested with a higher percentage of stocks than normal.
MY TRADING POSITIONS:
XLI – Industrial ETF
QLD – 2x Nas 100
DDM – 2x Dow 30
XLK – Technology ETF
CVX – (I may hold this as a long-term position. I already
owned a small position in CVX.)
SPY – S&P 500 (This is really a long-term position.)
IWM - Russell 2000. (This is really a long-term
position.)
TODAY’S COMMENT:
As I noted yesterday, the 10-dMA of Breadth is not
recovering so it appears that markets may retest prior lows, once again.
Earlier today indicators were very bullish; that changed
around mid-day as the markets fell in the afternoon. Utilities (XLU-ETF) are
being sold. Are the pros playing us? Are
they pushing the markets down; selling safe haven stocks (like utilities); and
planning to buy the high flyers (tech, etc.) after the market falls a few more
percent? I am not normally a conspiracy theorist; it’s just that it is very
unusual to see utilities sold (down more than 2.5%), the VIX fall, while
markets drop nearly 1 percent.
Here is the “S&P 500 Minus Utilities” spread presented
in a graph. The red curve is the spread; a rising red curve is bullish,
especially when combined with a high value.

Today, the daily sum of 20 Indicators dipped from +3 to zero
(a positive number is bullish; negatives are bearish); the 10-day smoothed sum
that smooths the daily fluctuations dropped from +52 to +46. (The trend
direction is more important than the actual number for the 10-day value.) These
numbers sometimes change after I post the blog based on data that comes in
late. Most of these 20 indicators are short-term so they tend to bounce
around a lot.
LONG-TERM INDICATOR: The Long
Term NTSM indicator remained to HOLD: VIX is bearish; PRICE is bullish; VOLUME &
SENTIMENT are neutral.
Bottom line: I’m a Bull: I’m now invested with about 75%
of the portfolio invested in stocks. (As a retiree, 50% invested in stocks is
my “normal” portfolio.) 75% stocks is uber-bullish and that’s as far as I’ll
go.
BEST ETFs - MOMENTUM ANALYSIS:
TODAY’S RANKING OF 15 ETFs
(Ranked Daily)
ETF ranking follows:
The top ranked ETF receives
100%. The rest are then ranked based on their momentum relative to the leading
ETF.
#1. XLE #2. IBB #3. ITA
*For additional background on
the ETF ranking system see NTSM Page at…
http://navigatethestockmarket.blogspot.com/p/exchange-traded-funds-etf-ranking.html
BEST DOW STOCKS - TODAY’S MOMENTUM
RANKING OF THE DOW 30 STOCKS (Ranked Daily)
DOW 30 momentum ranking
follows:
#1. CVX #2. MRK #3. AMGN
The top ranked Stock receives
100%. The rest are then ranked based on their momentum relative to the leading Stock.
For more details, see NTSM
Page at…
https://navigatethestockmarket.blogspot.com/p/a-system-for-trading-dow-30-stocks-my_8.html
THURSDAY MARKET INTERNALS
(NYSE DATA)
My basket of Market Internals remained SELL.
(Market Internals are a decent trend-following
analysis of current market action, but should not be used alone for short term
trading. They are most useful when they diverge from the Index.)
...My current invested
position is about 75% stocks, including stock mutual funds and ETFs. I’m
usually about 50% invested in stocks. I’ll cut back on stocks if we see serious
bear signs and I may be forced to sell leveraged long positions if the markets keep falling.
I trade about 15-20% of the
total portfolio using the momentum-based analysis I provide here. If I can see
a definitive bottom, I’ll add a lot more stocks to the portfolio using an
S&P 500 ETF.
“Trade what you see; not what you think.” – The Old Fool,
Richard McCranie, trader extraordinaire.
FED BEIGE BOOK (nasdaq.com)
“Economic activity in the U.S. has expanded modestly
since early September, according to the Federal Reserve's Beige Book, although
the report noted conditions varied across industries and districts. The Beige
Book, a compilation of anecdotal evidence on economic conditions in each of the
twelve Fed districts, said four districts saw flat activity and two cited
declines, with slowing or weak demand attributed to higher interest rates,
inflation, and supply disruptions.”
https://www.nasdaq.com/articles/feds-beige-book-says-u.s.-economy-expanded-modestly-notes-some-easing-of-price-growth
HOUSING STARTS / BUILDING PERMITS (HW Media)
“As mortgage rates rose to nearly 7% and builder sentiment dipped to painfully low levels in
September, housing starts also declined, dropping 8.1% from August... multifamily building permits were issued at a
seasonally adjusted annual rate of 644,000, up 8.2% month over month and 25.5%
year over year. Meanwhile, single-family building permits were issued at a rate
of 872,000, down 3.1% from August and 17.3% from a year ago.” Story at...
https://www.housingwire.com/articles/housing-starts-slide-but-there-are-reasons-for-optimism/
EIA CRUDE INVENTORIES (EIA)
“U.S. commercial crude oil inventories (excluding those
in the Strategic Petroleum Reserve) decreased by 1.7 million barrels from the
previous week. At 437.4 million barrels, U.S. crude oil inventories are about
2% below the five year average for this time of year.” Report at...
https://ir.eia.gov/wpsr/wpsrsummary.pdf
OPPENHEIMER BULLISH ON EQUITIES (CNBC)
“Those looking for positive signs will be glad to hear
Oppenheimer’s Chief Investment Strategist John Stoltzfus' take on the matter.
‘Our view remains bullish on equities as the stocks of
many solid companies look grossly oversold as a result of extreme negativity
that is evidenced in polls of investment professionals and private investors
and in the day to day volatility in the markets,’ Stoltzfus said.” Story at...
https://finance.yahoo.com/news/remain-bullish-equities-many-solid-231406804.html
My cmt: I’m glad someone agrees with me.
SUPREME COURT TO BLOCK BIDEN TRILLION DOLLAR STUDENT LOAN
GIVE AWAY? (CNBC)
“The Supreme Court on Wednesday was asked to block the
Biden administration’s student loan debt relief program, which is set to take
effect this weekend. The Brown County Taxpayers Association, a Wisconsin group,
directed the emergency application to delay implementation of the debt relief
plan to Justice Amy Coney Barrett, who is responsible for handling such
requests from the 7th federal appeals court circuit, which contains that state.” Story at...
https://www.cnbc.com/2022/10/19/supreme-court-asked-to-block-bidens-student-loan-forgiveness-plan.html
My cmt: The Executive Branch, including the President,
does not have the authority under the Constitution to unilaterally cancel debts
owed to the US. That is the purview of
Congress. This just continues a long line of Presidents who have tried to usurp
Congressional powers. The sad thing is that Congress has lacked the honesty to
challenge the President, because in recent cases, Congress has been held by the
same political party as the President. Biden’s illegal actions are no different
from when Trump illegally diverted funds to build the Border Wall, although
Congress did eventually fund the wall. For more, see here...
https://jonathanturley.org/2022/09/02/college-loan-forgiveness-plan-reveals-bidens-constitutional-cynicism/
BTW, the Wharton School of Business estimated the cost of
the give-away at a Trillion dollars; NPR estimates “only” $400 billion. Could NPR
be biased?????
MARKET REPORT / ANALYSIS
-Wednesday the S&P 500 dipped about 0.7% to 3695.
-VIX rose about 0.9% to 30.76.
-The yield on the 10-year Treasury was still 4.139%.
PULLBACK DATA:
-Drop from Top: 23% as of today. 25.4% max (on a closing
basis).
-Trading Days since Top: 199-days.
The S&P 500 is 10.9% Below its 200-dMA & 5.4%
Below its 50-dMA.
*I won’t call the correction over until the S&P 500
makes a new-high; however, evidence suggests the bottom was / is in the 3600
area and I am fully invested with a higher percentage of stocks than normal.
MY TRADING POSITIONS:
XLI – Industrial ETF
QLD – 2x Nas 100
DDM – 2x Dow 30
XLK – Technology ETF
CVX – (I may hold this as a long-term position. I already
owned a small position in CVX.)
SPY – S&P 500 (This is really a long-term position.)
IWM - Russell 2000. (This is really a long-term position.)
TODAY’S COMMENT:
While the bottom signal looked very strong on 27
September, there are concerns showing up now.
When looking a other major bottoms, specifically the March 2009 retest (Financial
Crisis bottom) and the Covid crash bottom in March of 2020, breath was higher
than it is now.
In 2009, the percentage of stocks advancing over the 10-days
prior to the retest bottom (10-day Breadth) was 50% at the bottom. During the
Covid Bear market, definitely an odd correction due to its speed down and back,
10-day Breadth recovered to 56% just 3 days after the bottom. Now the 10-day
breadth is languishing at 44% five trading-days after the bottom.
10-day Breadth is higher now than it was at the September
lows; that’s good, but we really need to see breadth improve, or we’ll have to
sweat a decline to the prior lows.
Curious that XLU (Utilities – ETF) was sold hard today. It
doesn’t look like investors are that worried. If they were, they wouldn’t
be selling XLU.
Today, the daily sum of 20 Indicators dipped from +4 to +3
(a positive number is bullish; negatives are bearish); the 10-day smoothed sum
that smooths the daily fluctuations dropped from +56 to +52. (The trend
direction is more important than the actual number for the 10-day value.) These
numbers sometimes change after I post the blog based on data that comes in
late. Most of these 20 indicators are short-term so they tend to bounce
around a lot.
LONG-TERM INDICATOR: The Long
Term NTSM indicator remained to HOLD: VIX is bearish; PRICE & SENTIMENT are
bullish; VOLUME is neutral.
Bottom line: I’m a Bull: I’m now invested with about 75%
of the portfolio invested in stocks. I added a leveraged long position (QLD –
2xNas 100) and XLI (Industrial ETF) 18 Oct based on strong bullish signs. (As a
retiree, 50% invested in stocks is my “normal” portfolio.) 75% stocks is
uber-bullish and that’s as far as I’ll go.
BEST ETFs - MOMENTUM ANALYSIS:
TODAY’S RANKING OF 15 ETFs
(Ranked Daily)
ETF ranking follows:
The top ranked ETF receives
100%. The rest are then ranked based on their momentum relative to the leading
ETF.
#1. XLE #2. IBB #3. ITA
*For additional background on
the ETF ranking system see NTSM Page at…
http://navigatethestockmarket.blogspot.com/p/exchange-traded-funds-etf-ranking.html
BEST DOW STOCKS - TODAY’S MOMENTUM
RANKING OF THE DOW 30 STOCKS (Ranked Daily)
DOW 30 momentum ranking
follows:
#1. AMGN #2. CVX #3. MRK
The top ranked Stock receives
100%. The rest are then ranked based on their momentum relative to the leading Stock.
For more details, see NTSM
Page at…
https://navigatethestockmarket.blogspot.com/p/a-system-for-trading-dow-30-stocks-my_8.html
WEDNESDAY MARKET INTERNALS
(NYSE DATA)
My basket of Market Internals remained SELL.
(Market Internals are a decent trend-following
analysis of current market action, but should not be used alone for short term
trading. They are most useful when they diverge from the Index.)
...My current invested
position is about 75% stocks, including stock mutual funds and ETFs. I’m
usually about 50% invested in stocks. I’ll cut back on stocks if we see serious
bear signs.
I trade about 15-20% of the
total portfolio using the momentum-based analysis I provide here. If I can see
a definitive bottom, I’ll add a lot more stocks to the portfolio using an
S&P 500 ETF.
“Trade what you see; not what you think.” – The Old Fool,
Richard McCranie, trader extraordinaire.
INDUSTRIAL PRODUCTION (Federal Reserve)
“Industrial production increased 0.4 percent in
September and 2.9 percent at an annual rate in the third quarter. In September,
manufacturing output rose 0.4 percent after advancing a similar amount in
the previous month.” Release at...
https://www.federalreserve.gov/releases/g17/current/default.htm
NAHB HOUSING MARKET INDEX (NAHB)
Chart from...
https://www.nahb.org/news-and-economics/housing-economics/indices/housing-market-index
“Builder sentiment fell for the ninth consecutive month
in September as elevated interest rates, persistent building material supply
chain disruptions, and high home prices continue to impact housing
affordability, according to the NAHB.” Story at...
https://www.builderonline.com/data-analysis/nahb-wells-fargo-housing-market-index-falls-for-ninth-consecutive-month_o
MARKET REPORT / ANALYSIS
-Tuesday the S&P 500 rose about 1.1% to 3720.
-VIX dipped about 3% to 30.5. (That’s still not much drop
given the big move up in the S&P 500. The VIX crowd remains skeptical,
although to be fair, a high VIX suggests big moves in price in EITHER
direction.)
-The yield on the 10-year Treasury was still 4.013%.
PULLBACK DATA:
-Drop from Top: 22.4% as of today. 25.4% max (on a
closing basis).
-Trading Days since Top: 199-days.
The S&P 500 is 10.4% Below its 200-dMA & 5% Below
its 50-dMA.
*I won’t call the correction over until the S&P 500
makes a new-high; however, evidence suggests the bottom was / is in the 3600
area and I am fully invested with a higher percentage of stocks than normal.
MY TRADING POSITIONS:
XLI – Industrial ETF
QLD – 2x Nas 100
DDM – 2x Dow 30
XLK – Technology ETF
CVX – (I may hold this as a long-term position. I already
owned a small position in CVX.)
SPY – S&P 500 (I may hold this as a long-term
position.)
IWM - Russell 2000. (I may hold this as a long-term
position.)
TODAY’S COMMENT:
I got the volume signal I was looking for – up-volume was
83% today. That’s a very bullish sign since it follows the 93% up-volume day
yesterday. As noted earlier, “In approximately half the cases in the past 69
years, the 90% Upside Day, or the back-to-back 80% Upside Days, which signaled
a major market reversal, occurred within five trading days or less of the
market low.” - Identifying Bear Market Bottoms - Lowry Research. The
bottom was 4 days ago. We also note that since my buy signal of 27 September,
there have been four 90% up-volume days and two back-to-back 80%+ up-volume
days. That’s strongly suggesting a durable rally.
Tuesday unchanged volume was high. As I’ve often said,
many believe that this indicator suggests investor confusion at market turning
points. My problem is that it is frequently a false signal, but I will say
this; this indicator has been correct the last four times we’ve seen it. Now, I
don’t know what it means. The S&P
500 is about the same level as it was when we saw the last signal, so is this
signal bullish or bearish? It is odd to see a high, unchanged volume-day when
83% of volume was up-volume.
Today, the daily sum of 20 Indicators dipped from +9 to
+4 (a positive number is bullish; negatives are bearish); the 10-day smoothed
sum that smooths the daily fluctuations remained +56. (The trend direction is
more important than the actual number for the 10-day value.) These numbers
sometimes change after I post the blog based on data that comes in late. Most
of these 20 indicators are short-term so they tend to bounce around a lot.
LONG-TERM INDICATOR: The Long
Term NTSM indicator remained to HOLD: VIX is bearish; PRICE & SENTIMENT are
bullish; VOLUME is neutral.
Bottom line: I’m a Bull: I’m now invested with about 75%
of the portfolio invested in stocks. I added a leveraged long position (QLD –
2xNas 100) and XLI (Industrial ETF) 18 Oct based on strong bullish signs. (As a
retiree, 50% invested in stocks is my “normal” portfolio.) 75% stocks is
uber-bullish and that’s as far as I’ll go.
BEST ETFs - MOMENTUM ANALYSIS:
TODAY’S RANKING OF 15 ETFs
(Ranked Daily)
ETF ranking follows:
The top ranked ETF receives
100%. The rest are then ranked based on their momentum relative to the leading
ETF.
#1. XLE #2. IBB #3. XLV
*For additional background on
the ETF ranking system see NTSM Page at…
http://navigatethestockmarket.blogspot.com/p/exchange-traded-funds-etf-ranking.html
BEST DOW STOCKS - TODAY’S MOMENTUM
RANKING OF THE DOW 30 STOCKS (Ranked Daily)
DOW 30 momentum ranking
follows:
#1. AMGN #2. MRK #3. CVX
The top ranked Stock receives
100%. The rest are then ranked based on their momentum relative to the leading Stock.
For more details, see NTSM
Page at…
https://navigatethestockmarket.blogspot.com/p/a-system-for-trading-dow-30-stocks-my_8.html
TUESDAY MARKET INTERNALS (NYSE
DATA)
My basket of Market Internals slipped to SELL, but just barely.
(Market Internals are a decent trend-following
analysis of current market action, but should not be used alone for short term
trading. They are most useful when they diverge from the Index.)
...My current invested
position is about 75% stocks, including stock mutual funds and ETFs. I’m
usually about 50% invested in stocks. I’ll cut back on stocks if we see serious
bear signs.
I trade about 15-20% of the
total portfolio using the momentum-based analysis I provide here. If I can see
a definitive bottom, I’ll add a lot more stocks to the portfolio using an
S&P 500 ETF.
“Trade what you see; not what you think.” – The Old Fool,
Richard McCranie, trader extraordinaire.
EMPIRE STATE MANUFACTURING (Advisor Perspectives)
“Business activity declined modestly in New York State,
according to firms responding to the October 2022 Empire State Manufacturing
Survey. The headline general business conditions index fell eight
points to -9.1.” Charts and analysis at...
https://www.advisorperspectives.com/dshort/commentaries/2022/10/17/empire-state-mfg-survey-activity-declined-in-october
NO BULLISH MESSAGE YET FROM BOND CEF A-D LINE (McClellan
Financial Publications)
“As stock prices were rebounding strongly on Oct. 13 from
an initial bad reaction to CPI data, there was no confirmation of that price
strength from the bond-related closed end funds (CEFs) which trade on the
NYSE... During the bear market of 2022, the Bond CEF A-D Line has continued to
point the way lower for the stock market.”
Charts & commentary at...
https://www.mcoscillator.com/learning_center/weekly_chart/no_bullish_message_yet_from_bond_cef_a-d_line/
My cmt: This is not my view. Let’s hope this indicator flips positive
soon.
MARKET REPORT / ANALYSIS
-Monday the S&P 500 rose about 2.7% to 3678.
-VIX dipped about 2% to 31.37. (That’s not much drop givven
the big move up in the S&P500. The VIX crowd is skeptical.)
-The yield on the 10-year Treasury slipped to 4.013%.
PULLBACK DATA:
-Drop from Top: 23.3% as of today. 25.4% max (on a
closing basis).
-Trading Days since Top: 198-days.
The S&P 500 is 11.5% Below its 200-dMA & 6.3%
Below its 50-dMA.
*I won’t call the correction over until the S&P 500
makes a new-high; however, evidence suggests the bottom was/is in the 3600 area
and I am fully invested with a higher percentage of stocks than normal.
MY TRADING POSITIONS:
DDM – 2x Dow 30
XLK – Technology ETF
CVX – (I may hold this as a long-term position. I already
owned a small position in CVX.)
SPY – S&P 500 (I may hold this as a long-term
position.)
IWM - Russell 2000. (I may hold this as a long-term
position.)
TODAY’S COMMENT:
There were some more bullish signs:
-Monday was a 90% up-volume day although the close wasn’t
high enough to give a strong, bull sign.
I’ll look for tomorrow to see if up-volume will be greater than 80%. Back-to-back
high up-volume days is a very bullish sign. BTW, that signal already occurred
once, on 3 and 4 October. The Index drifted down after that signal – more
back-to-back bull signs would likely signal a more durable bullish move this time.
-Junk Bond to S&P 500 spreads are positive and
getting more positive.
-The smoothed version of the Buying-Pressure minus Selling-Pressure
is flat and appears to be turning up. This has happened on previous rallies, but
this time, the turn is occurring at a much higher level than was true at the
June lows on the S&P 500. That is a bullish divergence I have mentioned
previously.
Today, the daily sum of 20 Indicators remained +6 (a
positive number is bullish; negatives are bearish); the 10-day smoothed sum
that smooths the daily fluctuations improved from +46 to +56. (The trend
direction is more important than the actual number for the 10-day value.) These
numbers sometimes change after I post the blog based on data that comes in
late. Most of these 20 indicators are short-term so they tend to bounce
around a lot.
LONG-TERM INDICATOR: The Long
Term NTSM indicator remained to HOLD: VIX is bearish; PRICE & SENTIMENT are
bullish; VOLUME is neutral.
Bottom line: I’m a Bull: I’m now invested with about 70%
of the portfolio invested in stocks. I added a leveraged long position (DDM –
2xDow) 13 Oct based on strong bullish signs. (As a retiree, 50% invested in
stocks is my “normal” portfolio.)
BEST ETFs - MOMENTUM ANALYSIS:
TODAY’S RANKING OF 15 ETFs
(Ranked Daily)
ETF ranking follows:
The top ranked ETF receives
100%. The rest are then ranked based on their momentum relative to the leading
ETF.
#1. XLE #2. IBB #3. XLV
*For additional background on
the ETF ranking system see NTSM Page at…
http://navigatethestockmarket.blogspot.com/p/exchange-traded-funds-etf-ranking.html
BEST DOW STOCKS - TODAY’S MOMENTUM
RANKING OF THE DOW 30 STOCKS (Ranked Daily)
DOW 30 momentum ranking
follows:
#1. AMGN #2. CVX #3. MRK
The top ranked Stock receives
100%. The rest are then ranked based on their momentum relative to the leading Stock.
For more details, see NTSM
Page at…
https://navigatethestockmarket.blogspot.com/p/a-system-for-trading-dow-30-stocks-my_8.html
MONDAY MARKET INTERNALS (NYSE
DATA)
My basket of Market Internals remained HOLD.
(Market Internals are a decent trend-following
analysis of current market action, but should not be used alone for short term
trading. They are most useful when they diverge from the Index.)
...My current invested
position is about 70% stocks, including stock mutual funds and ETFs. I’m
usually about 50% invested in stocks. I’ll cut back on stocks if we see serious
bear signs.
I trade about 15-20% of the
total portfolio using the momentum-based analysis I provide here. If I can see
a definitive bottom, I’ll add a lot more stocks to the portfolio using an
S&P 500 ETF.
“Trade what you see; not what you think.” – The Old Fool,
Richard McCranie, trader extraordinaire.
“For decades we disagreed with [Supreme] Court rulings
when progressives held sway, but we never called the Court illegitimate. But
now that the left has lost the Court as a backup legislature for its policy
goals, the institution is supposedly broken. Tell us again who is the threat to
democratic institutions?” – WSJ Editorial Board.
RETAIL SALES (CNBC)
“Retail and food services sales were little changed for
the month after rising 0.4% in August, according to the advance
estimate from the Commerce Department. That was below the Dow
Jones estimate for a 0.3% gain.” Story at...
https://www.cnbc.com/2022/10/14/retail-sales-september-2022.html
UNIV OF MICHIGAN SENTIMENT (Univ of Michigan)
“Consumer sentiment is essentially unchanged at 1.2 index
points above September, in spite of a 23% improvement in current buying
conditions for durables owing to an easing in supply constraints. Sentiment is
now 9.8 points above the all-time low reached in June but this improvement
remains tentative, as the expectations index declined by 3% from last month.”
Report at...
http://www.sca.isr.umich.edu/
HERITAGE CAPITAL COMMENTARY (Heritage Capital)
“I was looking for a big down opening that was rejected
and we sure got that [Thursday with wild market swings]...This is definitely
not normal behavior, but this kind of action is usually seen during the
bottoming process. Again, it’s a process not a point in time. And as you also
know I have been crystal clear both here and in the media that midterm election
years typically see major bottoms, especially in Q4 and mostly in October, when
they has been a significant decline. One single day will not dictate that, but
it just adds to evidence... Stock and bond market behavior in the coming days
will be important. Thursday’s low must, must, must hold. We need to see the
2-Year Note stop going up and then start to back off.” - Paul Schatz, President Heritage Capital. Commentary at...
https://investfortomorrow.com/blog/bells-may-not-be-ringing-but-they-are-being-polished/
MARKET REPORT / ANALYSIS
-Friday the S&P 500 fell about 2.4% to 3583.
-VIX rose about 0.3% to 32.02.
-The yield on the 10-year Treasury rose to 4.024%.
PULLBACK DATA:
-Drop from Top: 25.3% as of today. 25.4% max (on a
closing basis).
-Trading Days since Top: 196-days.
The S&P 500 is 13.9% Below its 200-dMA & 8.9%
Below its 50-dMA.
*I won’t call the correction over until the S&P 500
makes a new-high; however, evidence suggests the bottom was/is in the 3600 area
and I am fully invested with a higher percentage of stocks than normal.
MY TRADING POSITIONS:
DDM – 2x Dow 30
CVX – (I may hold this as a long-term position. I already
owned a small position in CVX.)
SPY – S&P 500 (I may hold this as a long-term
position.)
IWM - Russell 2000. (I may hold this as a long-term
position.)
TODAY’S COMMENT:
I would like to have seen some follow through from
Thursday’s big reversal (down in the AM and rally afterward), but the other
possibility was profit taking and that’s what we got. Still, today’s low didn’t
fall below yesterday’s intraday low, and that’s a positive on a bad day. We did
get a strong bull sign though and it was an important one.
The 52-week, New-high/new-low spread (new-highs minus new-lows)
improved by 3.5 standard deviations today. More simply, the spread between
new-highs and new-lows improved by 716 today. That big of a reversal has only
happened once before in this correction; generally, it tends to happen within a
few days after a bottom. VIX also gave us a perspective on the day’s action.
In spite of the big down-day Friday, the VIX was
essentially flat. The option crowd still
seems to think there is a rally coming.
The S&P 500 tested its 12 Oct low today. Internals
were not as good; that usually warns that there could be lower lows
coming. The good news is that today was another successful test when
compared to the June lows. The Index is
definitely in a bottoming pattern. I think we’ve seen the bottom, but we’ll have
to wait for more confirmation.
On Fridays, I summarize a number of indicators to get a
weekly feel for trend. The Friday rundown of indicators improved, but remained
slightly bullish to neutral (15-bear and 16-bull). These indicators tend to be
both long-term and short-term, so they are different than the 20 that I report
on daily.
Indicators have been slowly improving for the last three
weeks. Details follow:
BULL SIGNS
-There
was a Follow-Thru Day 13 October that canceled prior Distribution Days.
-MACD of S&P 500 price made a bullish crossover 13
Oct.
-My Money Trend indicator.
-Short-term new-high/new-low data.
-The 52-week, New-high/new-low ratio improved by 3.5
standard deviations. More simply, the spread between new-highs and new-lows
improved by 716 today. That’s another solid bottom sign.
-There have been 5 Statistically-Significant days (big
moves in price-volume) in the last 15-days. This can be bullish or bearish.
Since the Index is at a bottom, I’ll call it bullish.
-Issues advancing on the NYSE (Breadth) compared to the
S&P 500 are bullish. (Breadth is ahead of the Index.)
-The longer-term, 50-dEMA, Fosback Hi-Low Logic Index is
Bullish.
-There have only been 5 up-days over the last 20
sessions.
-On average, the size of up-moves has been larger than
the size of down-moves over the last month.
-13 Oct was a Bullish Outside Reversal Day.
-Cyclical Industrials (XLI-ETF) are outpacing the S&P
500.
-Sentiment.
-28 Sept and 3 and 4 Oct were all bullish 90% up-volume
days. (7 Oct there was a 90% down-volume day, but the close was not within the
lower 10% of the day’s range, so it won’t negate the bullish 90% up-volume day
on 4 October.)
-The S&P 500 is 13.9% below its 200-dMA. (Bull
indicator is 12% below the 200-day, although this is based on “normal”
pullbacks.)
-S&P 500 is outperforming the Utilities (XLU).
NEUTRAL
-Bollinger Bands.
-The short-term, 10-day, Fosback Hi-Low Logic Index.
-There have been 3 up-days over the last 10 sessions –
leaning bullish, but neutral.
-Overbought/Oversold Index (Advance/Decline Ratio).
-RSI
-The Calm-before-the-Storm/Panic Indicator warned on 13
September - expired.
-There was an Inverse Zweig Breadth Collapse (negative
Breadth Thrust) 21 June. That’s a rare, very-bearish sign, but it was
several-weeks ago - expired.
-There was a Hindenburg Omen signal 8 April – it was
canceled when the McClellan Oscillator turned bullish.
-2.8% of all issues traded on the NYSE made new, 52-week
highs when the S&P 500 made a new all-time-high, 3 January. (There is no
bullish signal for this indicator.) This indicated that the advance was too
narrow and a correction was likely to be >10%. – It proved correct, but is
now Expired
BEAR SIGNS
-The
10-dMA percentage of issues advancing on the NYSE (Breadth) is below 50%.
-The 50-dMA percentage of issues advancing on the NYSE
(Breadth) is below 50.
-The
100-dMA percentage of issues advancing on the NYSE (Breadth) is below 50%
-The 50-dMA percentage of issues advancing on the NYSE
(Breadth) has been below 50%, for 3 days in a row below 50% for my
“correction-now” signal. – It hardly matters now.
-Long-term new-high/new-low data.
-The smoothed advancing volume on the NYSE is falling.
-MACD of the percentage of issues advancing on the NYSE
(breadth) made a bearish crossover 30 Aug.
-Smoothed Buying Pressure minus Selling Pressure is falling.
(While it’s falling, there is a strong bullish divergence when today’s values
are compared to the June lows.)
-McClellan Oscillator is negative.
-The graph of the 100-day Count (the 100-day sum of up-days)
is falling.
-The Smart Money (late-day action) is headed down.
-VIX is rising quickly.
-Slope of the 40-dMA of New-highs is falling.
-The 5-10-20 Timer System is SELL; the 5-dEMA and 10-dEMA
are both below the 20-dEMA. (The 5-day is below the 10-day so short-term
momentum is bearish too.)
- Only 42% of the 15-ETFs that I track have been up over
the last 10-days.
On Friday, 21 February, 2 days after the top before the
Coronavirus pullback, there were 10 bear-signs and 1 bull-sign. Now there
are 15 bear-signs and 16-Bull. Last week, there were 15 bear-signs and 11
bull-signs. Friday indicators are leaning slightly to the bull side.
Today, the daily sum of 20 Indicators improved from +6 to
+9 (a positive number is bullish; negatives are bearish); the 10-day smoothed
sum that smooths the daily fluctuations improved from +35 to +46. (The trend
direction is more important than the actual number for the 10-day value.) These
numbers sometimes change after I post the blog based on data that comes in
late. Most of these 20 indicators are short-term so they tend to bounce
around a lot.
LONG-TERM INDICATOR: The Long
Term NTSM indicator remained to HOLD: VIX is bearish; PRICE & SENTIMENT are
bullish; VOLUME is neutral.
Bottom line: I’m a Bull: I’m now invested with about 70%
of the portfolio invested in stocks. I added a leveraged long position (DDM –
2xDow) 13 Oct based on strong bullish signs. (As a retiree, 50% invested in
stocks is my “normal” portfolio.)
BEST ETFs - MOMENTUM ANALYSIS:
TODAY’S RANKING OF 15 ETFs
(Ranked Daily)
ETF ranking follows:
The top ranked ETF receives
100%. The rest are then ranked based on their momentum relative to the leading
ETF.
#1. XLE #2. IBB #3. XLV
*For additional background on
the ETF ranking system see NTSM Page at…
http://navigatethestockmarket.blogspot.com/p/exchange-traded-funds-etf-ranking.html
BEST DOW STOCKS - TODAY’S MOMENTUM
RANKING OF THE DOW 30 STOCKS (Ranked Daily)
DOW 30 momentum ranking
follows:
#1. CVX #2. AMGN #3. MRK
The top ranked Stock receives
100%. The rest are then ranked based on their momentum relative to the leading Stock.
For more details, see NTSM
Page at…
https://navigatethestockmarket.blogspot.com/p/a-system-for-trading-dow-30-stocks-my_8.html
FRIDAY MARKET INTERNALS (NYSE
DATA)
My basket of Market Internals remained HOLD.
(Market Internals are a decent trend-following
analysis of current market action, but should not be used alone for short term
trading. They are most useful when they diverge from the Index.)
...My current invested
position is about 70% stocks, including stock mutual funds and ETFs. I’m
usually about 50% invested in stocks. I’ll cut back on stocks if we see serious
bear signs.
I trade about 15-20% of the
total portfolio using the momentum-based analysis I provide here. If I can see
a definitive bottom, I’ll add a lot more stocks to the portfolio using an S&P
500 ETF.