“Trade what you see; not what you think.” – The Old Fool, Richard McCranie, trader extraordinaire.
https://michaelpramirez.com/index.html
Yes, it’s very weird. California was a free state, not a slave state, so slavery reparations in California?
“Private sector hiring decelerated in March, flashing another potential sign that U.S. economic growth is heading for a sharp slowdown or recession, payroll processing firm ADP reported Wednesday. Company payrolls rose by just 145,000 for the month, down from an upwardly revised 261,000 in February...” Story at...
https://www.cnbc.com/2023/04/05/adp-march-2023.html
“Economic activity in the services sector expanded in March for the third consecutive month as the Services PMI® registered 51.2 percent, say the nation's purchasing and supply executives in the latest Services ISM® Report On Business®. The sector has grown in 33 of the last 34 months, with the lone contraction in December...There has been a pullback in the rate of growth for the services sector, attributed mainly to (1) a cooling off in the new orders growth rate, (2) an employment environment that varies by industry and (3) continued improvements in capacity and logistics, a positive impact on supplier performance. The majority of respondents report a positive outlook on business conditions.” Report at...
https://www.ismworld.org/supply-management-news-and-reports/reports/ism-report-on-business/services/march/
“U.S. commercial crude oil inventories (excluding those in the Strategic Petroleum Reserve) decreased by 3.7 million barrels from the previous week. At 470.0 million barrels, U.S. crude oil inventories are about 4% above the five year average for this time of year.” Report at...
https://ir.eia.gov/wpsr/wpsrsummary.pdf
-Wednesday the S&P 500 dropped about 0.3% to 4090.
-VIX rose about 0.4% to 19.08.
-The yield on the 10-year Treasury slipped to 3.302%.
-Drop from Top: 14.8% as of today. 25.4% max (on a closing basis).
-Trading Days since Top: 315-days.
The S&P 500 is 3.7% ABOVE its 200-dMA and 1.5% ABOVE its 50-dMA.
*I won’t call the correction over until the S&P 500 makes a new-high; however, evidence suggests the bottom was in the 3600 area.
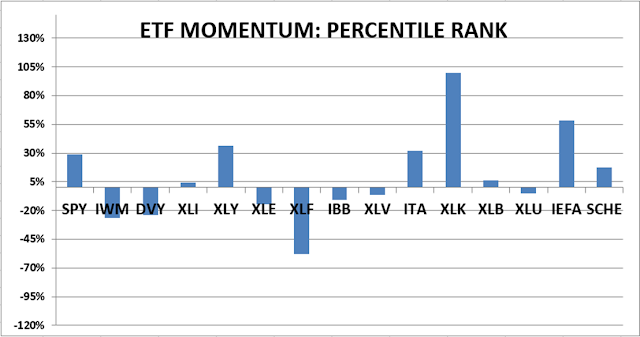
I am not trading as much as in the past. You may wish to use the momentum charts and/or the Monday 40-day gain charts for trading the Dow stocks and ETFs.
XLK – Technology ETF.
XLE – Energy Sector ETF. It hasn’t been doing much recently, but Russia is cutting production and that should help the sector. We have a good dividend in the meantime.
BA – (Boeing) I am late on this one, but we’ll see. They have more work than they can handle and are hiring. They should do well going forward. Boeing reports earnings 4/26/2023. Boeing was downgraded 4/4/2023 based on fears that they will not be able to ramp up production to meet demand.
XLY - Consumer Discretionary ETF.
KRE – Regional Banking ETF. This is a small position for me. I have no cash left.
50-dMA of issues advancing on the NYSE dropped below 50% yesterday and was again below 50% today. Buying pressure minus selling pressure is falling into negative territory indicating that selling pressure is greater now. My Money Trend indicator is a similar indicator, but it is currently looking bullish so no smoking gun. Nothing really stands out as overly bearish. I sold leveraged positions due to an abundance of caution. The WSJ reported today that retail investors are pulling back. If that continues, markets may see some more trouble.
ETF - MOMENTUM ANALYSIS:
TODAY’S RANKING OF 15 ETFs (Ranked Daily)
ETF ranking follows:

*For additional background on the ETF ranking system see NTSM Page at…
http://navigatethestockmarket.blogspot.com/p/exchange-traded-funds-etf-ranking.html
DOW 30 momentum ranking follows:
For more details, see NTSM Page at…
https://navigatethestockmarket.blogspot.com/p/a-system-for-trading-dow-30-stocks-my_8.html
My basket of Market Internals remained HOLD. (Market Internals are a decent trend-following analysis of current market action, but should not be used alone for short term trading. They are most useful when they diverge from the Index.)


