NY FED MANUFACTURING (NY Fed)
“Business activity held steady in New York State in December, according to firms responding to the Empire State Manufacturing Survey. After rising sharply last month, the headline general business conditions index retreated thirty-one points to 0.2. New orders and shipments increased modestly. Delivery times shortened somewhat, and supply availability was little changed. Inventories increased at a substantial clip. Labor market indicators pointed to small decline in employment and a slightly shorter average workweek. Both input and selling price increases moderated. Firms remained optimistic about the six-month outlook, though somewhat less so than in November.” Report at...
https://www.newyorkfed.org/survey/empire/empiresurvey_overview
-Monday the S&P 500 rose about 0.4% to 6074.
-VIX was up about 6% to 14.69.
-The yield on the 10-year Treasury was unchanged (compared to about this time, prior trading day) at 4.395%.
XLK – Holding since the October 2022 lows. Added more 9/20.
SSO – added 10/16.
SPY – added 9/19 & more 10/16
QLD – added 11/5.
UWM – added 11/11
Today, of the 50-Indicators I track, 18 gave Bear-signs and 8 were Bullish. The rest are neutral. (It is normal to have a lot of neutral indicators since many of the indicators are top or bottom indicators that will signal only at extremes.)
The daily Bull/Bear, 50-Indicator spread (Bull Indicators minus Bear Indicators, red curve in the chart above) remained -10 (10 more Bear indicators than Bull indicators).
There was another Hindenburg Omen today...
Hindenburg Omen: (https://www.investopedia.com/terms/h/hindenburgomen.asp). As we’ve noted before, the Omen sends a lot of false warnings, but there have been 2 Omens in the last 3 days. Clusters of Omens are supposed to be more reliable than a single warning. The short-term Fosback New-high/new-low Logic indicator uses a similar analytic approach; it is not close to giving a sell warning so no need to panic yet. Unfortunately, there are other bearish signs.
I thought this market weakness would end by now. There was an 8.5% correction back in October – it seems too soon for another. Indicators are not confirming my optimism. It may be time to take profits in my retirement accounts (to avoid paying taxes on the gains). If I do make changes I’ll post before the close.
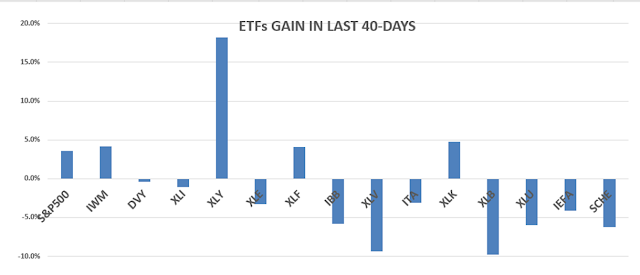
TODAY’S RANKING OF 15 ETFs (Ranked Daily) ETF ranking follows:
*For additional background on the ETF ranking system see NTSM Page at…
http://navigatethestockmarket.blogspot.com/p/exchange-traded-funds-etf-ranking.html
DOW STOCKS - TODAY’S MOMENTUM RANKING OF THE DOW 30 STOCKS (Ranked Daily)
For more details, see NTSM Page at…
https://navigatethestockmarket.blogspot.com/p/a-system-for-trading-dow-30-stocks-my_8.html
MONDAY MARKET INTERNALS (NYSE DATA)
My basket of Market Internals remained SELL. (My basket of Market Internals is a decent trend-following analysis that is most useful when it diverges from the Index.)


