"Bipartisan' usually means that a larger-than-usual deception is being carried out." - George Carlin
“Index Suggests Economic Growth Increased in November:
The Chicago Fed National Activity Index (CFNAI) increased to –0.12 in November from –0.50 in October. Three of the four broad categories of indicators used to construct the index increased from October, but all four categories made negative contributions in November. The index's three-month moving average, CFNAI-MA3, decreased to –0.31 in November from –0.27 in October.” Report at...
https://www.chicagofed.org/research/data/cfnai/current-data
“New orders for U.S. manufactured durable goods slumped by much more than expected in the month of November, according to a report released by the Commerce Department on Monday. The report said durable goods orders tumbled by 1.1 percent in November after climbing by an upwardly revised 0.8 percent in October.” Story at...
https://www.nasdaq.com/articles/us-durable-goods-orders-pull-back-more-expected-november
“Consumer sentiment confirmed its early-month reading, rising for the fifth consecutive month and reaching its highest value since April 2024. Buying conditions exhibited a particularly strong 32% improvement, primarily due to a surge in consumers expecting future price increases for large purchases.” Report at...
http://www.sca.isr.umich.edu/
“Sales of new U.S. single-family homes rebounded in November after being depressed by hurricanes in the prior month, but rising mortgage rates could hamper sales next year. New home sales jumped 5.9%...” Story at...
https://finance.yahoo.com/news/us-home-sales-rebound-november-153802284.html
-Monday the S&P 500 rose about 0.7% to 5974.
-VIX declined about 8% to 16.93.
-The yield on the 10-year Treasury rose (compared to about this time, prior trading day) to 4.589%.
XLK – Holding since the October 2022 lows. Added more 9/20.
SPY – added 12/20. (IRA acct.)
QLD – added 12/20. (IRA acct.)
Today, of the 50-Indicators I track, 21 gave Bear-signs and 4 were Bullish. The rest are neutral. (It is normal to have a lot of neutral indicators since many of the indicators are top or bottom indicators that will signal only at extremes.)
Today’s Bull-Bear spread of -17 is bearish. The worrisome sign is that the spread declined. There were 2 fewer bull-signals and 1 fewer bear-signal. We don’t like to see indicators falling after it appeared that markets made a bottom. Let’s hope the indicators improve tomorrow.
100-dMA – S&P 500, 5743
October lows: S&P 500, 5700
200-dMA: about S&P 500, 5520
Since price action was good today, I’ll stay with last week’s call; the weakness appears to be over, or close to over.
TODAY’S RANKING OF 15 ETFs (Ranked Daily) ETF ranking follows:
*For additional background on the ETF ranking system see NTSM Page at…
http://navigatethestockmarket.blogspot.com/p/exchange-traded-funds-etf-ranking.html
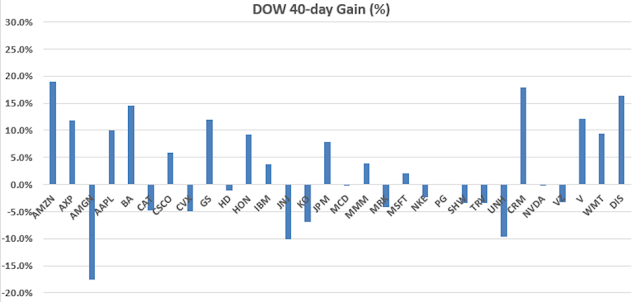
DOW STOCKS - TODAY’S MOMENTUM RANKING OF THE DOW 30 STOCKS (Ranked Daily)
For more details, see NTSM Page at…
https://navigatethestockmarket.blogspot.com/p/a-system-for-trading-dow-30-stocks-my_8.html
MONDAY MARKET INTERNALS (NYSE DATA)

My basket of Market Internals remained HOLD. (My basket of Market
Internals is a decent trend-following analysis that is most useful when it
diverges from the Index.)


