“Trade what you see; not what you think.” – The Old Fool,
Richard McCranie, trader extraordinaire.
“For decades we disagreed with [Supreme] Court rulings
when progressives held sway, but we never called the Court illegitimate. But
now that the left has lost the Court as a backup legislature for its policy
goals, the institution is supposedly broken. Tell us again who is the threat to
democratic institutions?” – WSJ Editorial Board.
SMALL BUSINESS OPTIMISM (NFIB)
“NFIB’s Small Business Optimism Index declined 0.8 points
in October to 91.3, which is the 10th consecutive month below the 49-year
average of 98. Thirty-three percent of owners reported that inflation was their
single most important problem in operating their business, three points higher
than September’s reading and four points lower than July’s highest reading
since the fourth quarter of 1979. ‘Owners continue to show a dismal view about
future sales growth and business conditions, but are still looking to hire new
workers,’ said NFIB
Chief Economist Bill Dunkelberg. ‘Inflation, supply chain
disruptions, and labor shortages continue to limit the ability of many small
businesses to meet the demand for their products and services.’” Press release
at...
https://www.nfib.com/surveys/small-business-economic-trends/
MARKET REPORT / ANALYSIS
-Tuesday the S&P 500 rose about 0.6% to 3828.
-VIX went the wrong way and rose about 5% to 25.54.
-The yield on the 10-year Treasury dipped to 4.134%.
PULLBACK DATA:
-Drop from Top: 20.2% as of today. 25.4% max (on a
closing basis).
-Trading Days since Top: 214-days.
The S&P 500 is 6.4% Below its 200-dMA & 0.9% ABOVE
its 50-dMA. (It’s good to see the Index above its 50-day.)
*I won’t call the correction over until the S&P 500
makes a new-high; however, evidence suggests the bottom was in the 3600 area
and I am fully invested with a higher percentage of stocks than normal.
MY TRADING POSITIONS:
XLI – Industrial ETF
QLD – 2x Nas 100
DDM – 2x Dow 30
XLK – Technology ETF
CVX – (I may hold this as a long-term position. I already
owned a small position in CVX.)
TODAY’S COMMENT:
Election day rally continues. The mid-term, Presidential
cycle suggests a significant rally at least though the end of the year.
Today, the daily sum of 20 Indicators slipped from +9 to
+8 (a positive number is bullish; negatives are bearish); the 10-day smoothed
sum that smooths the daily fluctuations slipped from +110 to +101. (The trend
direction is more important than the actual number for the 10-day value.) These
numbers sometimes change after I post the blog based on data that comes in
late. Most of these 20 indicators are short-term so they tend to bounce
around a lot.
LONG-TERM INDICATOR: The Long
Term NTSM indicator remained HOLD: VOLUME, SENTIMENT & VIX are neutral;
PRICE is bullish.
Bottom line: I’m a still a Bull. I haven’t seen many
signs that would change my mind. I think the bottom was 3577 on 12 October.
I’m now invested with about 75% of the portfolio invested
in stocks. (As a retiree, 50% invested in stocks is my “normal” portfolio.) 75%
stocks is uber-bullish and that’s as far as I’ll go.
BEST ETFs - MOMENTUM ANALYSIS:
TODAY’S RANKING OF 15 ETFs
(Ranked Daily)
ETF ranking follows:
The top ranked ETF receives
100%. The rest are then ranked based on their momentum relative to the leading
ETF.
*For additional background on
the ETF ranking system see NTSM Page at…
http://navigatethestockmarket.blogspot.com/p/exchange-traded-funds-etf-ranking.html
BEST DOW STOCKS - TODAY’S MOMENTUM
RANKING OF THE DOW 30 STOCKS (Ranked Daily)
DOW 30 momentum ranking
follows:
The top ranked Stock receives
100%. The rest are then ranked based on their momentum relative to the leading Stock.
For more details, see NTSM
Page at…
https://navigatethestockmarket.blogspot.com/p/a-system-for-trading-dow-30-stocks-my_8.html
TUESDAY MARKET INTERNALS (NYSE
DATA)
My basket of Market Internals slipped to HOLD.
(Market Internals are a decent trend-following
analysis of current market action, but should not be used alone for short term
trading. They are most useful when they diverge from the Index.)
...My current invested
position is about 75% stocks, including stock mutual funds and ETFs. I’m
usually about 50% invested in stocks. I’ll cut back on stocks if we see serious
bear signs. It may be time to take profits...we’ll see.
I trade about 15-20% of the
total portfolio using the momentum-based analysis I provide here. If I can see
a definitive bottom, I’ll add a lot more stocks to the portfolio using an
S&P 500 ETF.
“Trade what you see; not what you think.” – The Old Fool,
Richard McCranie, trader extraordinaire.
“For decades we disagreed with [Supreme] Court rulings
when progressives held sway, but we never called the Court illegitimate. But
now that the left has lost the Court as a backup legislature for its policy
goals, the institution is supposedly broken. Tell us again who is the threat to
democratic institutions?” – WSJ Editorial Board.
I have disagreed with [Justice Clarence Thomas] more than
with any other justice. Which means we don’t come together on many cases. And
yet I can tell you that I spend time with him, understanding that he is one of
the few justices who knows practically everybody in our building. He knows
their name, he knows the things about their life, what their family is
suffering. He’ll tell me, you know that person’s wife is sick right now, or
that person’s child is having difficulty.
There’s no other justice who does that. I try, but he
does it better. He cares about people. Now, he cares on legal interests
differently. And he sees those legal issues much differently than I do. I tell
people, you know Clarence believes, just like him, because he grew up very,
very poor, that everyone is capable of picking themselves up by their
bootstraps. I understand that some people can’t reach their bootstraps. That’s
a fundamental difference in how we view what the law can or should or does do
for people. But I can appreciate him.- Supreme Court Justice Sonia Sotomayor,
lecture at Roosevelt University in Chicago.
As a former engineer and manager in Government, I can
relate.
CENSORING IN THE NAME OF FREE SPEECH (Jonathon Turley
Blog)
“The latest (and one of the most disturbing) examples [of
censorship] is a letter signed
by hundreds of “literary figures” last week to get companies to block
publication of a book by Supreme Court
Justice Amy Coney Barrett because they disagree with her
judicial philosophy. After all, why burn
books when you can effectively ban them? The public
letter entitled “We Dissent” makes the usual absurd
protestation that, just because we are seeking to ban books of those with
opposing views, we still “care deeply about freedom of speech.” They simply
justify their anti-free speech position by insisting that any harm “in the form
of censorship” is less than “the form of assault on inalienable human rights”
in opposing
abortion or other constitutional rights. Yet, the letter is not
simply dangerous. It is perfectly delusional. While calling for the book to be
blocked, the writers bizarrely insist “we are not calling for censorship.”...
For a writer to be against free speech is like an athlete being against
exercise. It is the defining right for our country and an existential right for
writers and academics. Commentary at...
https://jonathanturley.org/2022/11/03/censoring-in-the-name-of-free-speech-publishers-and-editors-call-for-banning-barrett-book/#more-196057
Jonathan Turley is the Shapiro professor of public
interest law at George Washington University and a practicing criminal defense
attorney.
EARNINGS INSIGHT EXCERPT (FactSet)
“Overall,
85% of the companies in the S&P 500 have reported actual results for Q3
2022 to date. Of these companies, 70% have reported actual EPS above estimates,
which is below the 5-year average of 77% and below the 10-year average of 73%.
In aggregate, companies are reporting earnings that are 1.9% above estimates,
which is well below the 5-year average of 8.7% and well below the 10-year
average of 6.5%. If 1.9% is the final percentage for the quarter, it will mark
the second-lowest surprise percentage reporting by the index in the past nine
years. The lower earnings surprise percentage is due to a number of companies
reporting actual earnings below estimates by unusually wide margins.” Report
at...
https://insight.factset.com/sp-500-earnings-season-update-november-4-2022
STRONG EVIDENCE OF A STOCK MARKET RALLY (msn.com)
“For the moment, contrarian analysis suggests that a
strong rally is likely in coming weeks.” - Mark Hulbert, Hulbert Ratings newsletter and MarketWatch contributor.
Story at...
Here’s
strong new evidence that a U.S. stock-market rally is coming soon (msn.com)
B OF A SELL SIDE INDICATOR CLOSE TO A BUY SIGNAL
(msn.com)
“While the Sell Side Indicator does not catch every rally
or decline in the stock market, the indicator has historically had some
predictive capability with respect to subsequent 12-month S&P 500 total
returns.” The indicator isn’t flashing a ‘buy’ signal right now. But it hasn’t
gotten this close since 2017...The bank noted that when the indicator was at
current levels or lower, the subsequent 12-month returns for the S&P 500
were positive 94% of the time with the median 12-month return being 22%.” Story
at...
Ignore
the doom-n-gloom: BofA's reliable 'Sell-Side' contrarian indicator is very
close to flashing a buy signal — here are 2 top stocks to consider when it does
(msn.com)
MARKET REPORT / ANALYSIS
-Monday the S&P 500 rose about 1% to 3807.
-VIX dipped about 1% to 24.35. (I’d like to see VIX fall
more sharply for more confirmation of the bullish case.).
-The yield on the 10-year Treasury rose to 4.216%.
PULLBACK DATA:
-Drop from Top: 21.4% as of today. 25.4% max (on a
closing basis).
-Trading Days since Top: 212-days.
The S&P 500 is 7.9% Below its 200-dMA & 0.9%
BELOW its 50-dMA.
*I won’t call the correction over until the S&P 500
makes a new-high; however, evidence suggests the bottom was in the 3600 area
and I am fully invested with a higher percentage of stocks than normal.
MY TRADING POSITIONS:
XLI – Industrial ETF
QLD – 2x Nas 100
DDM – 2x Dow 30
XLK – Technology ETF
CVX – (I may hold this as a long-term position. I already
owned a small position in CVX.)
TODAY’S COMMENT:
So, it seems that Wall Street is lining up to embrace a
rally, based on the above articles and others I have seen. I hope so.
My initial bottom signal was on 27 September. We got a 90% up-volume day
the day after and another 90% up-volume day 5-days later all confirming the
bottom. What now looks like it may have been the final bottom occurred 2 weeks
later on 12 October. The S&P 500 is more than 6% up since the low, but has
been backing and filing along the way. There’s no guarantee that the final
bottom is in, but we can hope. There is always the possibility that the index
could retest the prior low or even dip somewhat below it. I’d be surprised if markets fall appreciably
below the prior lows this year.
The market bounce now may be telling us that investors
are convinced that Republicans will take the House. Markets like divided Government and the
gridlock that comes with it, so the politicians can’t screw things up.
Today, the daily sum of 20 Indicators improved from +4 to
+9 (a positive number is bullish; negatives are bearish); the 10-day smoothed
sum that smooths the daily fluctuations slipped from +117 to +110. (The trend
direction is more important than the actual number for the 10-day value.) These
numbers sometimes change after I post the blog based on data that comes in
late. Most of these 20 indicators are short-term so they tend to bounce
around a lot.
LONG-TERM INDICATOR: The Long
Term NTSM indicator remained HOLD: VOLUME, SENTIMENT & VIX are neutral;
PRICE is bullish.
Bottom line: I’m a still a Bull. I haven’t seen many
signs that would change my mind. I think the bottom was 3577 on 12 October.
I’m now invested with about 75% of the portfolio invested
in stocks. (As a retiree, 50% invested in stocks is my “normal” portfolio.) 75%
stocks is uber-bullish and that’s as far as I’ll go.
BEST ETFs - MOMENTUM ANALYSIS:
TODAY’S RANKING OF 15 ETFs
(Ranked Daily)
ETF ranking follows:
The top ranked ETF receives
100%. The rest are then ranked based on their momentum relative to the leading
ETF.
*For additional background on
the ETF ranking system see NTSM Page at…
http://navigatethestockmarket.blogspot.com/p/exchange-traded-funds-etf-ranking.html
BEST DOW STOCKS - TODAY’S MOMENTUM
RANKING OF THE DOW 30 STOCKS (Ranked Daily)
DOW 30 momentum ranking
follows:
The top ranked Stock receives
100%. The rest are then ranked based on their momentum relative to the leading Stock.
For more details, see NTSM
Page at…
https://navigatethestockmarket.blogspot.com/p/a-system-for-trading-dow-30-stocks-my_8.html
MONDAY MARKET INTERNALS (NYSE
DATA)
My basket of Market Internals improved to BUY.
(Market Internals are a decent trend-following
analysis of current market action, but should not be used alone for short term
trading. They are most useful when they diverge from the Index.)
...My current invested
position is about 75% stocks, including stock mutual funds and ETFs. I’m
usually about 50% invested in stocks. I’ll cut back on stocks if we see serious
bear signs. It may be time to take profits...we’ll see.
I trade about 15-20% of the
total portfolio using the momentum-based analysis I provide here. If I can see
a definitive bottom, I’ll add a lot more stocks to the portfolio using an
S&P 500 ETF.
“Trade what you see; not what you think.” – The Old Fool,
Richard McCranie, trader extraordinaire.
“For decades we disagreed with [Supreme] Court rulings
when progressives held sway, but we never called the Court illegitimate. But
now that the left has lost the Court as a backup legislature for its policy
goals, the institution is supposedly broken. Tell us again who is the threat to
democratic institutions?” – WSJ Editorial Board.
PAYROLL REPORT / UNEMPLOYMENT RATE / AVG HOURLY EARNINGS
The U.S. economy added more jobs than expected in October
even as the Federal
Reserve pressed on with the central bank's most aggressive
monetary tightening campaign in decades.
-Non-farm payrolls: +261,000 vs.
+195,000 expected
-Unemployment rate: 3.7% vs. 3.6%
expected
-Average hourly earnings, month-over-month: +0.4%
vs. +0.3% expected
-Average hourly earnings, year-over-year: +4.7%
vs. +4.7%
expected
https://finance.yahoo.com/news/october-jobs-report-november-4-2022-202231255.html
ED YARDENI SAYS THE BOTTOM IS IN (CNBC)
“I thought June 16th was the low...That turned out not to
be the case...We’re in a bottoming process, but I do think the bottom is in. The
market has discounted what the FED is going to do...I agree with Jim Bullard;
they are going to do 75-basis points (hike) in December and stop there...5% is already
in the market...The market reaction has not been much this week given all the
hawkish talk from Powell...The economy is in a rolling recession.” Ed Yardeni,
Phd, President, Yardeni Research.
Paraphrased from a CNBC interview 11/4/2022.
To Ed’s point, here are other dovish FED governors suggesting
slower rate hikes as noted below.
FED OFFICIALS SEE POSSIBILITY OF SLOWER RATEHIKES AHEAD
(CNBC)
“Two Federal Reserve officials indicated Friday that they
expect further interest rate increases but will be looking closely at whether
those moves need to be as aggressive as they’ve been this year. Regional
president Thomas Barkin of Richmond and Susan Collins separately
said that the Fed is moving into a new phase that will be examining how much
more restrictive policy needs to be.” Story at...
https://www.cnbc.com/2022/11/04/fed-officials-barkin-and-collins-see-possibility-for-slower-rate-hikes-ahead.html
MARKET REPORT / ANALYSIS
-Friday the S&P 500 rose about 1.4% to 3771.
-VIX dipped about 3% to 24.55.
-The yield on the 10-year Treasury rose to 4.164%.
PULLBACK DATA:
-Drop from Top: 21.4% as of today. 25.4% max (on a
closing basis).
-Trading Days since Top: 212-days.
The S&P 500 is 7.9% Below its 200-dMA & 0.9%
BELOW its 50-dMA.
*I won’t call the correction over until the S&P 500
makes a new-high; however, evidence suggests the bottom was / is in the 3600
area and I am fully invested with a higher percentage of stocks than normal.
MY TRADING POSITIONS:
XLI – Industrial ETF
QLD – 2x Nas 100
DDM – 2x Dow 30
XLK – Technology ETF
CVX – (I may hold this as a long-term position. I already
owned a small position in CVX.)
TODAY’S COMMENT:
Patience...I have held trading positions while watching
markets. Today, I feel a little better
with that decision.
On Fridays, I summarize a number of indicators to get a
weekly feel for trend. The Friday rundown of indicators is less bullish this
week, but is still quite bullish (6-bear and 16-bull). These indicators tend to
be both long-term and short-term, so they are different than the 20 that I
report on daily.
BULL SIGNS
-The
10-dMA percentage of issues advancing on the NYSE (Breadth) is above 50%.
-MACD of S&P 500 price made a bullish crossover 13
Oct.
-MACD of the percentage of issues advancing on the NYSE
(breadth) made a bullish crossover 26 Oct.
-The 52-week, New-high/new-low ratio improved by 3.5
standard deviations. More simply, the spread between new-highs and new-lows
improved by 716 on 14 October. That’s another solid bottom sign at a retest.
-Issues advancing on the NYSE (Breadth) compared to the
S&P 500 are bullish. (Breadth is ahead of the Index.)
-Short-term new-high/new-low data.
-Long-term new-high/new-low data.
-McClellan Oscillator.
-Smoothed Buying Pressure minus Selling Pressure is rising.
-On average, the size of up-moves has been larger than
the size of down-moves over the last month.
-21 Oct was a Bullish Outside Reversal Day.
-Cyclical Industrials (XLI-ETF) are outpacing the S&P
500.
-17 and 18 Oct were back-to-back 80%+ up-volume days.
-Slope of the 40-dMA of New-highs is rising.
-S&P 500 is outperforming the Utilities (XLU).
-62% of the 15-ETFs that I track have been up over the
last 10-days.
NEUTRAL
-Sentiment.
-There
have been 2 Distribution Days 31 Oct and 2 Nov. Not enough to give a signal.
-Overbought/Oversold Index (Advance/Decline Ratio).
-The longer-term, 50-dEMA, Fosback Hi-Low Logic Index is
neutral.
-The 5-10-20 Timer System is HOLD; the 5-dEMA and 10-dEMA
are not both above the 20-dEMA. (The 5-day is below the 10-day so short-term
momentum is bearish.)
-There have been 8 up-days over the last 20 sessions.
-There have been 4 up-days over the last 10 sessions –
neutral.
-There have been 4 Statistically-Significant days (big
moves in price-volume) in the last 15-days.
-The S&P 500 is 7.9% below its 200-dMA. (Bull
indicator is 12% below the 200-day, although this is based on “normal”
pullbacks.)
-Bollinger Bands.
-RSI
-VIX indicator.
-The graph of the 100-day Count (the 100-day sum of up-days)
is flat.
-The Calm-before-the-Storm/Panic Indicator warned on 13
September - expired.
-There was an Inverse Zweig Breadth Collapse (negative
Breadth Thrust) 21 June. That’s a rare, very-bearish sign, but it was
several-weeks ago - expired.
-There was a Hindenburg Omen signal 8 April – expired.
-2.8% of all issues traded on the NYSE made new, 52-week
highs when the S&P 500 made a new all-time-high, 3 January. (There is no
bullish signal for this indicator.) This indicated that the advance was too
narrow and a correction was likely to be >10%. – It proved correct, but is
now Expired
-The Smart Money (late-day action) is flat.
BEAR SIGNS
-The short-term, 10-day, Fosback Hi-Low Logic Index.
-The 50-dMA percentage of issues advancing on the NYSE
(Breadth) is below 50.
-The
100-dMA percentage of issues advancing on the NYSE (Breadth) is below 50%
-The 50-dMA percentage of issues advancing on the NYSE
(Breadth) has been below 50%, for 3 days in a row below 50% for my
“correction-now” signal. – It hardly matters now.
-The smoothed advancing volume on the NYSE is falling.
-My Money Trend indicator turned down.
On Friday, 21 February, 2 days after the top before the
Coronavirus pullback, there were 10 bear-signs and 1 bull-sign. Now there
are 6 bear-signs and 16-Bull. Last week, there were 4 bear-signs and 23
bull-signs. Friday indicators are leaning slightly to the bull side.
Today, the daily sum of 20 Indicators declined from +6 to
+4 (a positive number is bullish; negatives are bearish); the 10-day smoothed
sum that smooths the daily fluctuations slipped from +125 to +117. (The trend
direction is more important than the actual number for the 10-day value.) These
numbers sometimes change after I post the blog based on data that comes in
late. Most of these 20 indicators are short-term so they tend to bounce
around a lot.
LONG-TERM INDICATOR: The Long
Term NTSM indicator remained HOLD: VOLUME, SENTIMENT & VIX are neutral;
PRICE is bullish.
Bottom line: I’m a still a Bull. I haven’t seen many
signs this week that would change my mind. I think the bottom was 3577 on 12
October.
I’m now invested with about 75% of the portfolio invested
in stocks. (As a retiree, 50% invested in stocks is my “normal” portfolio.) 75%
stocks is uber-bullish and that’s as far as I’ll go.
BEST ETFs - MOMENTUM ANALYSIS:
TODAY’S RANKING OF 15 ETFs
(Ranked Daily)
ETF ranking follows:
The top ranked ETF receives
100%. The rest are then ranked based on their momentum relative to the leading
ETF.
*For additional background on
the ETF ranking system see NTSM Page at…
http://navigatethestockmarket.blogspot.com/p/exchange-traded-funds-etf-ranking.html
BEST DOW STOCKS - TODAY’S MOMENTUM
RANKING OF THE DOW 30 STOCKS (Ranked Daily)
DOW 30 momentum ranking follows:
The top ranked Stock receives
100%. The rest are then ranked based on their momentum relative to the leading Stock.
For more details, see NTSM
Page at…
https://navigatethestockmarket.blogspot.com/p/a-system-for-trading-dow-30-stocks-my_8.html
FRIDAY MARKET INTERNALS (NYSE
DATA)
My basket of Market Internals remained HOLD.
(Market Internals are a decent trend-following
analysis of current market action, but should not be used alone for short term
trading. They are most useful when they diverge from the Index.)
...My current invested
position is about 75% stocks, including stock mutual funds and ETFs. I’m
usually about 50% invested in stocks. I’ll cut back on stocks if we see serious
bear signs. It may be time to take profits...we’ll see.
I trade about 15-20% of the
total portfolio using the momentum-based analysis I provide here. If I can see
a definitive bottom, I’ll add a lot more stocks to the portfolio using an
S&P 500 ETF.
“Trade what you see; not what you think.” – The Old Fool,
Richard McCranie, trader extraordinaire.
"In 2024, the Republican Party might present the
nation with a presidential nominee whose unfitness has been
demonstrated...After next Tuesday’s sobering election results, Democrats should
resolve not to insult and imperil the nation by doing likewise... Regarding
Biden and Harris, the national Democratic Party faces two tests of stewardship:
Its imprimatur cannot again be bestowed on either of them...Biden is not just
past his prime; even adequacy is in his past. And this is Harris’s prime."
– George Will.
Political commentary at...
https://michaelpramirez.com/index.html
JOBLESS CLAIMS / PRODUCTIVITY (YahooFinance)
“New weekly jobless claims are out this morning,
with Initial Jobless Claims reaching
217K, beneath expectations and 1000 fewer claims than the upwardly revised 218K
the previous week. Continuing
Claims reached 1.485 million -- higher than recent reads,
but historically still pretty low... Productivity numbers
are out this morning, as well. A headline of +0.3% is 10 basis points (bps)
lower than expectations...” Story at...
https://finance.yahoo.com/news/economic-data-gradually-dwindles-jobless-143302146.html
ISM NON-MANUFACTURING INDEX (ISM via prNewswire)
“Economic activity in the services sector grew
in October for the 29th month in a row — with the Services
PMI® registering 54.4 percent — say the nation's purchasing and supply executives
in the latest Services ISM® Report On Business®...‘In October, the
Services PMI® registered 54.4 percent, 2.3 percentage points lower than
September's reading of 56.7 percent. This is the lowest reading since May 2020, when the index registered 45.2 percent.’” Press
release at...
https://www.prnewswire.com/news-releases/services-pmi-at-54-4-october-2022-services-ism-report-on-business-301666703.html
FACTORY ORDERS (Reuters)
“New orders for U.S.-manufactured goods increased
moderately in September as a surge in bookings for civilian aircraft was
partially offset by declines elsewhere, suggesting a loss of momentum in
manufacturing amid rapidly rising borrowing costs. The Commerce Department said
on Thursday that factory orders rose 0.3% after gaining 0.2% in August.” Story
at...
https://www.reuters.com/markets/us/us-factory-orders-rise-moderately-september-2022-11-03/
MARKET REPORT / ANALYSIS
-Thursday the S&P 500 dropped about 1.1% to 3720.
-VIX dipped about 2% to 25.30.
-The yield on the 10-year Treasury rose to 4.150%. (It
was 1.631% at the beginning of 2022.)
PULLBACK DATA:
-Drop from Top: 22.4% as of today. 25.4% max (on a
closing basis).
-Trading Days since Top: 211-days.
The S&P 500 is 9.2% Below its 200-dMA & 2.5%
BELOW its 50-dMA.
*I won’t call the correction over until the S&P 500
makes a new-high; however, evidence suggests the bottom was / is in the 3600
area and I am fully invested with a higher percentage of stocks than normal.
MY TRADING POSITIONS:
XLI – Industrial ETF
QLD – 2x Nas 100
DDM – 2x Dow 30
XLK – Technology ETF
CVX – (I may hold this as a long-term position. I already
owned a small position in CVX.)
TODAY’S COMMENT:
VIX dropped again as the S&P 500 fell more than 1%.
There was a piece on CNN that said the VIX was not good at predicting market
moves. Ok, but a falling VIX is suggesting smaller moves ahead with less
volatility. That usually means a more bullish S&P 500. Now the Options folks may just be confused
like the rest of the markets.
The 10-day Fosback New-Hi/New-low Logic Index is still
giving a bearish signal. Basically, this indicator is bearish because both
new-highs and new-lows are elevated. This is a short-term indicator and is not
suggesting that there is a crash coming, but possibly, a return to the prior
lows.
The S&P 500 is lagging Breadth even more than
Wednesday giving a stronger buy signal. This indicator called the recent
bottoms in June and September.
Today, the daily sum of 20 Indicators declined from +7 to
+6 (a positive number is bullish; negatives are bearish); the 10-day smoothed
sum that smooths the daily fluctuations improved from +119 to +125. (The trend
direction is more important than the actual number for the 10-day value.) These
numbers sometimes change after I post the blog based on data that comes in
late. Most of these 20 indicators are short-term so they tend to bounce
around a lot.
LONG-TERM INDICATOR: The Long
Term NTSM indicator remained HOLD: VOLUME, SENTIMENT & VIX are neutral;
PRICE is bullish.
Bottom line: I’m a still a Bull, but let’s see what
happens in the next few sessions.
I should be selling XLK and QLD. Technology was the last
sector standing and investors are taking it down now. Steve Grasso said on
CNBC’s fast Money that the market will bottom when Apple bottoms and Apple isn’t
there yet. He may be right, but I still think the bottom is in the 3600 zone.
I’m now invested with about 75% of the portfolio invested
in stocks. (As a retiree, 50% invested in stocks is my “normal” portfolio.) 75%
stocks is uber-bullish and that’s as far as I’ll go.
BEST ETFs - MOMENTUM ANALYSIS:
TODAY’S RANKING OF 15 ETFs
(Ranked Daily)
ETF ranking follows:
The top ranked ETF receives
100%. The rest are then ranked based on their momentum relative to the leading
ETF.
*For additional background on
the ETF ranking system see NTSM Page at…
http://navigatethestockmarket.blogspot.com/p/exchange-traded-funds-etf-ranking.html
BEST DOW STOCKS - TODAY’S MOMENTUM
RANKING OF THE DOW 30 STOCKS (Ranked Daily)
DOW 30 momentum ranking
follows:
The top ranked Stock receives
100%. The rest are then ranked based on their momentum relative to the leading Stock.
For more details, see NTSM
Page at…
https://navigatethestockmarket.blogspot.com/p/a-system-for-trading-dow-30-stocks-my_8.html
THURSDAY MARKET INTERNALS
(NYSE DATA)
My basket of Market Internals remained HOLD.
(Market Internals are a decent trend-following
analysis of current market action, but should not be used alone for short term
trading. They are most useful when they diverge from the Index.)
...My current invested
position is about 75% stocks, including stock mutual funds and ETFs. I’m
usually about 50% invested in stocks. I’ll cut back on stocks if we see serious
bear signs. It may be time to take profits...we’ll see.
I trade about 15-20% of the
total portfolio using the momentum-based analysis I provide here. If I can see
a definitive bottom, I’ll add a lot more stocks to the portfolio using an
S&P 500 ETF.
FOMC RATE DECISION (CNBC)
“Federal Reserve Chair Jerome Powell’s comments were
quite hawkish, which means the Fed still has a way to go to fight inflation,
said Jack McIntyre, portfolio manager at Brandywine Global. The level of
interest rates will also be higher than previously expected, he said. ‘There
were no hints of dovishness to indicate the Fed may be poised to pause,’
McIntyre pointed out.” Story at...
https://www.cnbc.com/2022/11/02/real-time-updates-of-big-fed-rate-hike-and-jerome-powells-news-conference.html
The language in the FED press release was slightly dovish
and markets moved higher by 1% or so after the initial release. Chairman Powell squashed the optimism during
his press conference. He said, “It is very premature to be thinking about
pausing. People when they hear ‘lags’ think about a pause. It is very
premature, in my view, to think about or be talking about pausing our rate
hikes. We have a ways to go...”
ADP EMPLOYMENT (ADP)
“Employers created 239,000 jobs in October, up from a
revised 192,000 in September as restaurants, retailers and the travel sector
ramped up hiring in advance of the year-end holidays. ‘This is a really strong
number given the maturity of the economic recovery, but the hiring was not
broad-based. Goods producers, which are sensitive to interest rates, are
pulling back, and job changers are commanding smaller pay gains. While we're
seeing early signs of Fed-driven demand destruction, it's affecting only
certain sectors of the labor market.’” Press release from ADP at...
https://adpemploymentreport.com/
EIA CRUDE INVENTORIES (EIA)
“U.S. commercial crude oil inventories (excluding those
in the Strategic Petroleum Reserve) decreased by 3.1 million barrels from the
previous week. At 436.8 million barrels, U.S. crude oil inventories are about
3% below the five-year average for this time of year...” Report at...
https://ir.eia.gov/wpsr/wpsrsummary.pdf
MARKET REPORT / ANALYSIS
-Wednesday the S&P 500 dropped about 2.5% to 3760.
-VIX was little changed to 25.86.
-The yield on the 10-year Treasury rose to 4.105%.
PULLBACK DATA:
-Drop from Top: 21.6% as of today. 25.4% max (on a
closing basis).
-Trading Days since Top: 210-days.
The S&P 500 is 8.3% Below its 200-dMA & 1.6%
BELOW its 50-dMA.
*I won’t call the correction over until the S&P 500
makes a new-high; however, evidence suggests the bottom was / is in the 3600
area and I am fully invested with a higher percentage of stocks than normal.
MY TRADING POSITIONS:
XLI – Industrial ETF
QLD – 2x Nas 100
DDM – 2x Dow 30
XLK – Technology ETF
CVX – (I may hold this as a long-term position. I already
owned a small position in CVX.)
TODAY’S COMMENT:
VIX was unchanged.
Let me get this straight. The S&P 500 was down 2.5% and the VIX was
unchanged?!! The Options crowd is not buying (or should I say selling?) today’s
selloff. We’ll have to see market action in the next couple of days to decide
whether to take some chips off the table. VIX certainly didn’t confirm that the
rally is over.
Still, it was not a good day on several fronts:
-The S&P 500 dropped below its 50-dMA.
-Another bearish sign popped up that I didn’t like to
see. The 10-day Fosback New-Hi/New-low Logic Index gave a bearish signal. This indicator hasn’t been bearish since
April. It initially turned bearish 8 days after the top of this current
downturn. Basically, this indicator is bearish because both new-highs and
new-lows are elevated. This is a short-term indicator and is not suggesting
that there is a crash coming, but possibly, a return to the prior lows.
On a positive note, the S&P 500 is lagging Breadth enough
to give a buy signal. This indicator called the recent bottoms in June and
September. Further, today, Wednesday, was a statistically significant down-day.
That just means that the price-volume move exceeded my statistical parameters.
Statistics show that a statistically-significant, down-day is followed by an up-day
about 60% of the time.
Today, the daily sum of 20 Indicators declined from +8 to
+7 (a positive number is bullish; negatives are bearish); the 10-day smoothed
sum that smooths the daily fluctuations improved from +115 to +119. (The trend
direction is more important than the actual number for the 10-day value.) These
numbers sometimes change after I post the blog based on data that comes in
late. Most of these 20 indicators are short-term so they tend to bounce
around a lot.
LONG-TERM INDICATOR: The Long
Term NTSM indicator declined to HOLD: VOLUME, SENTIMENT & VIX are neutral;
PRICE is bullish.
Bottom line: I’m a still a Bull, but let’s see what
happens in the next few sessions. I may take profits in DDM and maybe CVX.
We’ll see.
I’m now invested with about 75% of the portfolio invested
in stocks. (As a retiree, 50% invested in stocks is my “normal” portfolio.) 75%
stocks is uber-bullish and that’s as far as I’ll go.
BEST ETFs - MOMENTUM ANALYSIS:
TODAY’S RANKING OF 15 ETFs
(Ranked Daily)
ETF ranking follows:
The top ranked ETF receives
100%. The rest are then ranked based on their momentum relative to the leading
ETF.
*For additional background on
the ETF ranking system see NTSM Page at…
http://navigatethestockmarket.blogspot.com/p/exchange-traded-funds-etf-ranking.html
BEST DOW STOCKS - TODAY’S MOMENTUM
RANKING OF THE DOW 30 STOCKS (Ranked Daily)
DOW 30 momentum ranking
follows:
The top ranked Stock receives
100%. The rest are then ranked based on their momentum relative to the leading Stock.
For more details, see NTSM
Page at…
https://navigatethestockmarket.blogspot.com/p/a-system-for-trading-dow-30-stocks-my_8.html
WEDNESDAY MARKET INTERNALS
(NYSE DATA)
My basket of Market Internals remained HOLD.
(Market Internals are a decent trend-following
analysis of current market action, but should not be used alone for short term
trading. They are most useful when they diverge from the Index.)
...My current invested
position is about 75% stocks, including stock mutual funds and ETFs. I’m
usually about 50% invested in stocks. I’ll cut back on stocks if we see serious
bear signs. It may be time to take profits...we’ll see.
I trade about 15-20% of the
total portfolio using the momentum-based analysis I provide here. If I can see
a definitive bottom, I’ll add a lot more stocks to the portfolio using an
S&P 500 ETF.
“Trade what you see; not what you think.” – The Old Fool,
Richard McCranie, trader extraordinaire.
“For decades we disagreed with [Supreme] Court rulings
when progressives held sway, but we never called the Court illegitimate. But
now that the left has lost the Court as a backup legislature for its policy
goals, the institution is supposedly broken. Tell us again who is the threat to
democratic institutions?” – WSJ Editorial Board.
“Where The New York Times has put the alleged
Pelosi assassination attempt on its front page for two days in a row, it buried
the story of the Kavanaugh murder plot on page A20. Three days later, none of
the Sunday morning political shows, such as NBC’s “Meet the Press,” even
mentioned the assassination attempt.” – Michael Shellenberger, author, former public
relations professional and 2018 Democratic candidate for Governor in
California.
“The U.S. Navy's
Ohio class ballistic missile submarine USS Rhode Island has made a very
uncommon public port visit to the British Overseas Territory of Gibraltar. The public
announcement about this stopover is also unusual...” Story at...
Second
U.S. Ballistic Missile Submarine Makes Unusual Appearance In Just Two Weeks
(msn.com)
Clear and simple...this is a warning to Russia. Using
nuclear weapons in Ukraine is not a good idea.
JOLTS JOB OPENINGS (CNBC)
“Job openings surged in September despite Federal Reserve
efforts aimed at loosening up a historically tight labor market that has helped
feed the highest inflation readings in four decades. Employment openings for
the month totaled 10.72 million... September’s data indicates that there are
1.9 job openings for every available worker.” Story at...
https://www.cnbc.com/2022/11/01/jolts-september-2022.html
ISM MANUFACTURING (ISM via prNewswire)
"The September Manufacturing
PMI® registered 50.9 percent, 1.9 percentage points lower than the 52.8
percent recorded in August. This figure indicates expansion in the overall
economy for the 28th month in a row after contraction in April and May 2020. The Manufacturing PMI® figure is the
lowest since May 2020, when it registered 43.5
percent.” Press release at...
https://www.prnewswire.com/news-releases/manufacturing-pmi-at-50-9-september-2022-manufacturing-ism-report-on-business-301638361.html
CONSTRUCTION SPENDING (Kitco / Reuters)
“U.S. construction spending unexpectedly rebounded in
September, amid a surge in investment in nonresidential structures that offset
a further decline in outlays on single-family homebuilding. The Commerce
Department said on Tuesday that construction spending rose 0.2% in September
after declining 0.6% in August.” Story at...
https://www.kitco.com/news/2022-11-01/U-S-construction-spending-unexpectedly-rebounds-in-September.html
MARKET REPORT / ANALYSIS
-Tuesday the S&P 500 dropped about 0.4% to 3856.
-VIX bucked the trend and dipped about 0.1% to 25.81.
-The yield on the 10-year Treasury was little changed at 4.050%.
PULLBACK DATA:
-Drop from Top: 19.6% as of today. 25.4% max (on a
closing basis).
-Trading Days since Top: 209-days.
The S&P 500 is 6.1% Below its 200-dMA & 0.7%
ABOVE its 50-dMA.
*I won’t call the correction over until the S&P 500
makes a new-high; however, evidence suggests the bottom was / is in the 3600
area and I am fully invested with a higher percentage of stocks than normal.
MY TRADING POSITIONS:
XLI – Industrial ETF
QLD – 2x Nas 100
DDM – 2x Dow 30
XLK – Technology ETF
CVX – (I may hold this as a long-term position. I already
owned a small position in CVX.)
TODAY’S COMMENT:
Advancers beat decliners; up-volume was more than double down-volume;
new-highs outpaced new-lows and the S&P 500 was down. That is another weird day. It really means
that the small cap stocks are outpacing the large-caps and we see that in the
Indices. The Russell 2000 and the NYSE Composite
were both up on the day while other major indices were down. Usually, the S&P 500 will follow the
majority so I’d expect the S&P 500 to move up tomorrow or Thursday. Wednesday could be a bad day depending on how
Mr. Market interprets the news from the Fed meeting.
Today, (Tuesday) unchanged volume was high. As I’ve often
said, many believe that this indicator suggests investor confusion at market
turning points. My problem is that it is frequently a false signal. This
indicator has been correct a couple times when we’ve seen it recently, but not
the most recent ones on 18 & 21 October. Mr. Market ignored those signals. The
jury is still out on the 28 October signal. Now, I’ll ignore it again due to
other more compelling bullish signs. Remember, the Friday run down of
indicators was extremely bullish.
Today, the daily sum of 20 Indicators declined from +13
to +8 (a positive number is bullish; negatives are bearish); the 10-day
smoothed sum that smooths the daily fluctuations improved from +111 to +115.
(The trend direction is more important than the actual number for the 10-day
value.) These numbers sometimes change after I post the blog based on data that
comes in late. Most of these 20 indicators are short-term so they tend to
bounce around a lot.
LONG-TERM INDICATOR: The Long
Term NTSM indicator remained BUY: SENTIMENT & VIX are neutral; PRICE &
VOLUME are bullish.
Bottom line: I’m a Bull: I’m now invested with about 75%
of the portfolio invested in stocks. (As a retiree, 50% invested in stocks is
my “normal” portfolio.) 75% stocks is uber-bullish and that’s as far as I’ll
go.
BEST ETFs - MOMENTUM ANALYSIS:
TODAY’S RANKING OF 15 ETFs
(Ranked Daily)
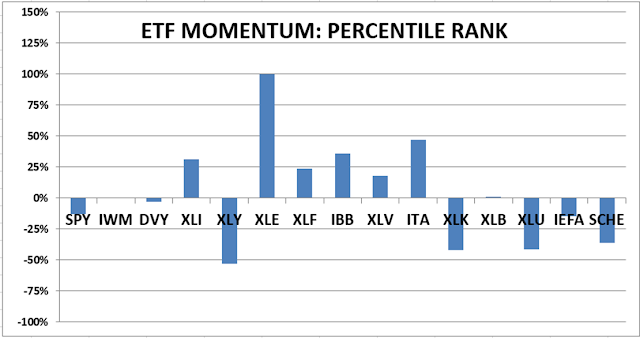
ETF ranking follows:
The top ranked ETF receives
100%. The rest are then ranked based on their momentum relative to the leading
ETF.
#1. XLE #2. ITA #3. IBB
*For additional background on
the ETF ranking system see NTSM Page at…
http://navigatethestockmarket.blogspot.com/p/exchange-traded-funds-etf-ranking.html
BEST DOW STOCKS - TODAY’S MOMENTUM
RANKING OF THE DOW 30 STOCKS (Ranked Daily)
DOW 30 momentum ranking
follows:
The top ranked Stock receives
100%. The rest are then ranked based on their momentum relative to the leading Stock.
For more details, see NTSM
Page at…
https://navigatethestockmarket.blogspot.com/p/a-system-for-trading-dow-30-stocks-my_8.html
TUESDAY MARKET INTERNALS (NYSE
DATA)
My basket of Market Internals remained HOLD.
(Market Internals are a decent trend-following analysis
of current market action, but should not be used alone for short term trading.
They are most useful when they diverge from the Index.)
...My current invested
position is about 75% stocks, including stock mutual funds and ETFs. I’m
usually about 50% invested in stocks. I’ll cut back on stocks if we see serious
bear signs.
I trade about 15-20% of the
total portfolio using the momentum-based analysis I provide here. If I can see
a definitive bottom, I’ll add a lot more stocks to the portfolio using an
S&P 500 ETF.
 *For additional background on
the ETF ranking system see NTSM Page at…
 The top ranked Stock receives
100%. The rest are then ranked based on their momentum relative to the leading Stock.
 My basket of Market Internals slipped to HOLD.





