Wednesday, July 12, 2023

Small Business Optimism ... Momentum Trading DOW Stocks & ETFs … Stock Market Analysis ...

 
“The problem isn't that Johnny can't read. The problem isn't even that Johnny can't think. The problem is that Johnny doesn't know what thinking is; he confuses it with feeling.” - Thomas Sowell, senior fellow at the Hoover Institution.
 
"These are the types of rulings that signal a dangerous creep toward authoritarianism and centralization of power in the courts...In fact, we have members of the court themselves with Justice Elena Kagan saying that the court is beginning to assume the power of a legislature." – Alexandria Ocasio-Cortez, United States Representative.
 
"They [Democrats] bemoan a conservative majority [in the Supreme Court] that puts jurisprudence above politics. Well, the evidence suggests that anyone who expects the court to function as a mere extension of legislative power is bound to be disappointed...This latest term demonstrates that no party wins or loses before the Supreme Court every time...The court adheres to the Constitution and weighs each case on its merits. It should continue to do exactly that." – Mitch McConnel, Minority Leader of the United States Senate

“For decades we disagreed with [Supreme] Court rulings when progressives held sway, but we never called the Court illegitimate. But now that the left has lost the Court as a backup legislature for its policy goals, the institution is supposedly broken. Tell us again who is the threat to democratic institutions?” – WSJ Editorial Board.
 
SMALL BUSINESS OPTIMISM (NFIB)
"NFIB’s Small Business Optimism Index increased 1.6 points in June to 91.0, however, it is the 18th consecutive month below the 49-year average of 98. Inflation and labor quality are tied as the top small business concerns with 24% of owners reporting each as their single most important problem... “Halfway through the year, small business owners remain very pessimistic about future business conditions and their sales prospects,” said NFIB Chief Economist Bill Dunkelberg.” Press release at...
https://www.nfib.com/surveys/small-business-economic-trends/?gclid=CjwKCAjw-7OlBhB8EiwAnoOEkzJTj7PrELTZLZwzN77EYj7an_hV6xj60nyoeey8yVtdnthUSlXrEBoCQDQQAvD_BwE
 
MARKET REPORT / ANALYSIS
-Tuesday the S&P 500 rose about 0.7% to 4439.
-VIX fell about 2% to 14.84.
-The yield on the 10-year Treasury dipped to 3.965%.
 
PULLBACK DATA:
-Drop from Top: 7.4%. 25.4% max (on a closing basis).
-Trading Days since Top: 380-days.
The S&P 500 is 10.5% ABOVE its 200-dMA and 4.1% ABOVE its 50-dMA.
*I won’t call the correction over until the S&P 500 makes a new-high; however, evidence suggests the bottom was in the 3600 area and we called a buy on 4 October 2022.
 
MY TRADING POSITIONS:
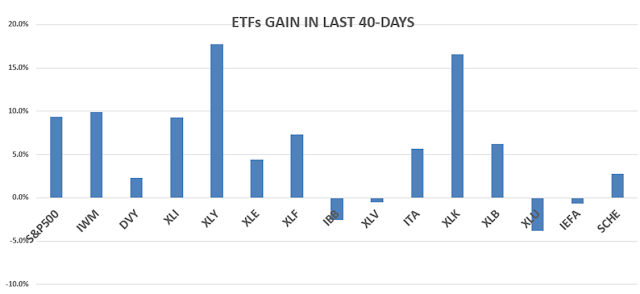
I am not trading as much as in the past. You may wish to use the momentum charts and/or the Monday, 40-day gain charts for trading the Dow stocks and ETFs.
 
MSFT – Microsoft.
XLK – Technology ETF.
XLY - Consumer Discretionary ETF.
 
KRE – Regional Banking ETF. This is a very small position for me. KRE tested the May 4 low of 36.08 on much lower volume 11 & 12 May.
I haven’t sold yet. On the positive side, it has not breached its recent low around 36.
 
SHY – Short term bonds. 30-day yield is 5.04% - 9 June 2023. (Trailing 1-year yield is 3.04%.) Once this weak period ends, I’ll sell SHY and buy stocks/stock ETFs.
 
TODAY’S COMMENT:
Not much new today.  Indicators are more bullish, both long and short term. All eyes are on the CPI report to be released at 8:30am Wednesday. Tom Lee urged investors to load up on stocks ahead of the report, because he expects lower inflation will fuel a rally. It could also fuel a blow-off top or a sell-the-news response starting that small pullback we have been expecting for a while.  We’ll see...
 
The daily spread of 20 Indicators (Bulls minus Bears) rose from +1 to +7 (a positive number is bullish; negatives are bearish); the 10-day smoothed sum that smooths the daily fluctuations improved from -5 to +4. (The trend direction is more important than the actual number for the 10-day value.) These numbers sometimes change after I post the blog based on data that comes in late. Most of these 20 indicators are short-term so they tend to bounce around a lot.
 
LONG-TERM INDICATOR: The Long Term NTSM indicator remained HOLD: PRICE is positive; SENTIMENT, VIX & VOLUME are neutral.
 
(The important BUY in this indicator was on 21 October, 7-days after the bottom. For my NTSM overall signal, I suggested that a short-term buying opportunity occurred on 27 September (based on improved market internals on the retest), although without market follow-thru, I was unwilling to call a buy; however, I did close shorts and increased stock holdings. I issued a Buy-Signal on 4 October, 6-days before the final bottom, based on stronger market action that confirmed the market internals signal. The NTSM sell-signal was issued 20 December, 8 sessions before the high of this recent bear market, based on the bearish “Friday Rundown” of indicators.)
 
Bottom line: I remain a cautious Bull, still expecting a decline of around 4-5% on the S&P 500 to start soon.
 
ETF - MOMENTUM ANALYSIS:
TODAY’S RANKING OF 15 ETFs (Ranked Daily)
ETF ranking follows:

The top ranked ETF receives 100%. The rest are then ranked based on their momentum relative to the leading ETF.
*For additional background on the ETF ranking system see NTSM Page at…
http://navigatethestockmarket.blogspot.com/p/exchange-traded-funds-etf-ranking.html
 
DOW STOCKS - TODAY’S MOMENTUM RANKING OF THE DOW 30 STOCKS (Ranked Daily)
DOW 30 momentum ranking follows:


The top ranked Stock receives 100%. The rest are then ranked based on their momentum relative to the leading Stock.
For more details, see NTSM Page at…
https://navigatethestockmarket.blogspot.com/p/a-system-for-trading-dow-30-stocks-my_8.html
 
TUESDAY MARKET INTERNALS (NYSE DATA)
My basket of Market Internals remained BUY.
(My basket of Market Internals is a decent trend-following analysis of current market action, but should not be used alone for short term trading. They are most useful when they diverge from the Index.) 
 
...My current invested position is about 55% stocks, including stock mutual funds and ETFs. I’m usually about 50% invested in stocks.
 
I trade about 15-20% of the total portfolio using the momentum-based analysis I provide here. If I can see a definitive bottom, I’ll add a lot more stocks to the portfolio using an S&P 500 ETF.

Monday, July 10, 2023

Momentum Trading DOW Stocks & ETFs … Stock Market Analysis ...

 
“Trade what you see; not what you think.” – The Old Fool, Richard McCranie, trader extraordinaire.
 
“When you want to help people, you tell them the truth. When you want to help yourself, you tell them what they want to hear... The fact that so many successful politicians are such shameless liars is not only a reflection on them, it is also a reflection on us. When the people want the impossible, only liars can satisfy.” ― Thomas Sowell, senior fellow at the Hoover Institution.
 
MARKET REPORT / ANALYSIS
-Monday the S&P 500 rose about 0.2% to 4412.
-VIX rose about 2% to 15.07.
-The yield on the 10-year Treasury rose to 4.004%.
 
PULLBACK DATA:
-Drop from Top: 8.1%. 25.4% max (on a closing basis).
-Trading Days since Top: 379-days.
The S&P 500 is 9.8% ABOVE its 200-dMA and 3.6% ABOVE its 50-dMA.
*I won’t call the correction over until the S&P 500 makes a new-high; however, evidence suggests the bottom was in the 3600 area and we called a buy on 4 October 2022.
 
MY TRADING POSITIONS:
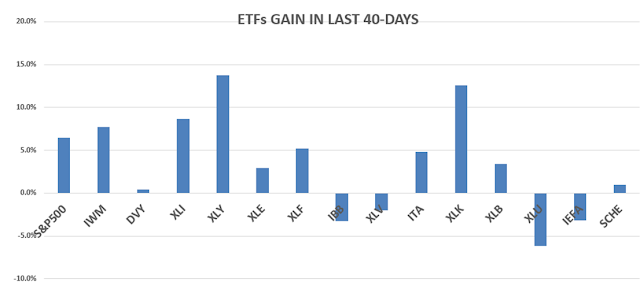
I am not trading as much as in the past. You may wish to use the momentum charts and/or the Monday, 40-day gain charts for trading the Dow stocks and ETFs.
 
MSFT – Microsoft.
XLK – Technology ETF.
XLY - Consumer Discretionary ETF.
 
KRE – Regional Banking ETF. This is a very small position for me. KRE tested the May 4 low of 36.08 on much lower volume 11 & 12 May.
I haven’t sold yet. On the positive side, it has not breached its recent low around 36.
 
SHY – Short term bonds. 30-day yield is 5.04% - 9 June 2023. (Trailing 1-year yield is 3.04%.) Once this weak period ends, I’ll sell SHY and buy stocks/stock ETFs.
 
TODAY’S COMMENT:
The black curve in the above chart shows the S&P 500 since last July 2022. The Index has been in an uptrend since the October lows and more recently, since mid-March. It bounced off its upper trendline on 15 June and again on 3 July. It is currently below its mid-June high when we said it looked like the Index had made a short-term high.  That call remains, but indicators, other than the chart, are much more positive.  Mr. Market may ignore my indicator (It wouldn’t be unusual.) and the Index could continue higher along its upper trend line. That’s a good reason for not shorting the advance right now. I am still expecting the S&P 500 to retreat to its lower trend line, sooner rather than later.
 
The red and green lines represent buying pressure minus selling pressure so the upward trending lines are bullish.  We can also see why this indicator was instrumental in calling the October 2022 bottom.
 
The daily spread of 20 Indicators (Bulls minus Bears) remained +1 (a positive number is bullish; negatives are bearish); the 10-day smoothed sum that smooths the daily fluctuations improved from -14 to -5. (The trend direction is more important than the actual number for the 10-day value.) These numbers sometimes change after I post the blog based on data that comes in late. Most of these 20 indicators are short-term so they tend to bounce around a lot.
 
LONG-TERM INDICATOR: The Long Term NTSM indicator remained HOLD: PRICE is positive; SENTIMENT, VIX & VOLUME are neutral.
 
(The important BUY in this indicator was on 21 October, 7-days after the bottom. For my NTSM overall signal, I suggested that a short-term buying opportunity occurred on 27 September (based on improved market internals on the retest), although without market follow-thru, I was unwilling to call a buy; however, I did close shorts and increased stock holdings. I issued a Buy-Signal on 4 October, 6-days before the final bottom, based on stronger market action that confirmed the market internals signal. The NTSM sell-signal was issued 20 December, 8 sessions before the high of this recent bear market, based on the bearish “Friday Rundown” of indicators.)
 
Bottom line: I remain a cautious Bull, still expecting a decline of around 4-5% on the S&P 500 to start soon.
 
ETF - MOMENTUM ANALYSIS:
TODAY’S RANKING OF 15 ETFs (Ranked Daily)
ETF ranking follows:
The top ranked ETF receives 100%. The rest are then ranked based on their 
momentum relative to the leading ETF.

*For additional background on the ETF ranking system see NTSM Page at…

http://navigatethestockmarket.blogspot.com/p/exchange-traded-funds-etf-ranking.html


DOW STOCKS - TODAY’S MOMENTUM RANKING OF THE DOW 30 STOCKS (Ranked Daily)
DOW 30 momentum ranking follows:
 

The top ranked Stock receives 100%. The rest are then ranked based on their momentum relative to the leading Stock.
For more details, see NTSM Page at…
https://navigatethestockmarket.blogspot.com/p/a-system-for-trading-dow-30-stocks-my_8.html

MONDAY MARKET INTERNALS (NYSE DATA)
My basket of Market Internals remained BUY.
(My basket of Market Internals is a decent trend-following analysis of current market action, but should not be used alone for short term trading. They are most useful when they diverge from the Index.) 
 
...My current invested position is about 55% stocks, including stock mutual funds and ETFs. I’m usually about 50% invested in stocks.
 
I trade about 15-20% of the total portfolio using the momentum-based analysis I provide here. If I can see a definitive bottom, I’ll add a lot more stocks to the portfolio using an S&P 500 ETF.
 

Friday, July 7, 2023

Here’s the rest of Friday’s Stock Market Commentary

TODAY’S COMMENT:


That’s not a very encouraging daily chart for the bulls.  Since I am expecting a relatively small pullback, it is not unexpected. Surprisingly, breadth continued to improve this week as more stocks participated in the market even as the S&P 500 declined. On longer term measures, that trend has not improved enough to correct the Breadth vs the S&P 500 indicator; it is still calling for a pullback, although it does not have to be a big pullback to clear this indicator. This indicator first warned on 12 December 2022, about 5-weeks before the top of the current 25% correction. This time it first warned on 19 May, 6-weeks ago.
 
                                                                                                                                                                   
We look at a summary of indicators on Friday: The weekly rundown of indicators moved more strongly to the Bull side (now 6-bear and 15-bull). (These indicators tend to be both long-term and short-term, so they are different than the 20 that I report on daily.)
 
BULL SIGNS
-The smoothed advancing volume on the NYSE is rising.
-The 10-dMA percentage of issues advancing on the NYSE (Breadth) is above 50%.
-The 50-dMA percentage of issues advancing on the NYSE (Breadth) is above 50%.
-The 100-dMA percentage of issues advancing on the NYSE (Breadth) is above 50%.
-MACD of the percentage of issues advancing on the NYSE (breadth) made a bullish crossover 3 July.
-Smoothed Buying Pressure minus Selling Pressure is rising.
-Long-term new-high/new-low data.
-Short-term new-high/new-low data.
-McClellan Oscillator.
-The long-term, 50-dEMA, Fosback Hi-Low Logic Index.
-The graph of the 100-day Count (the 100-day sum of up-days).
-On average, the size of up-moves has been larger than the size of down-moves over the last month.
-The 5-10-20 Timer System is BUY.
-The 5-day EMA is above the 10-day EMA so short-term momentum is bullish.
-S&P 500 spread vs. Utilities (XLU-ETF) shows the Index outpacing Utilities.
 
NEUTRAL
-There was a Distribution Day 6 July.
-There have been no Statistically-Significant days (big moves in price-volume) in the last 15-days.
-Sentiment.
-Bollinger Band Squeeze 28 April - expired.
-Bollinger Bands.
-The 50-dMA percentage of issues advancing on the NYSE (Breadth) has not been below 50%, for more than 3 days in a row.
-Overbought/Oversold Index (Advance/Decline Ratio).
-There was a Zweig Breadth Thrust 31 March. That’s a rare, very-bullish sign, but the McClellan Oscillator subsequently turned negative, so this indicator has expired.
-The S&P 500 is 9.6% above its 200-dMA. (Bear indicator is 12% above the 200-day.)
-10 May there was a Bullish Outside Reversal Day – Expired.
-The short-term, 10-day EMA, Fosback Hi-Low Logic Index is neutral.
-There have been 4 up-days over the last 10 sessions – neutral.
-There have been 11 up-days over the last 20 sessions - neutral.
-RSI
-There was a 90% down-volume day 9 March.
-There was a Hindenburg Omen signal 3 May 2023. The McClellan Oscillator turned positive 18 May. – Expired.
-The Calm-before-the-Storm/Panic Indicator flashed a panic-buying signal 10 November - expired.
-2.8% of all issues traded on the NYSE made new, 52-week highs when the S&P 500 made a new all-time-high, 3 January 2022. (There is no bullish signal for this indicator.) This indicated that the advance was too narrow and a correction was likely to be >10%. It proved correct, but is now Expired.
-VIX indicator.
-51% of the 15-ETFs that I track have been up over the last 10-days.
 
BEAR SIGNS
-Issues advancing on the NYSE (Breadth) compared to the S&P 500. The Index is too far ahead of Breadth.
-MACD of S&P 500 price made a bearish crossover 6 July.
-My Money Trend indicator is falling.
-Slope of the 40-dMA of New-highs is falling.
-The Smart Money (late-day action).
-XLI-ETF (Cyclical Industrials) is underperforming the S&P 500; the trend direction is flat to slightly down.
 
On Friday, 21 February, 2 days after the top before the Coronavirus pullback, there were 10 bear-signs and 1 bull-sign. Now there are 6 bear-signs and 15-Bull. Last week, there were 8 bear-sign and 14 bull-signs.
 
The daily spread of 20 Indicators (Bulls minus Bears) improved from -6 to +1 (a positive number is bullish; negatives are bearish); the 10-day smoothed sum that smooths the daily fluctuations improved from -21 to -14. (The trend direction is more important than the actual number for the 10-day value.) These numbers sometimes change after I post the blog based on data that comes in late. Most of these 20 indicators are short-term so they tend to bounce around a lot.
 
LONG-TERM INDICATOR: The Long Term NTSM indicator remained HOLD: PRICE is positive; SENTIMENT, VIX & VOLUME are neutral.
 
(The important BUY in this indicator was on 21 October, 7-days after the bottom. For my NTSM overall signal, I suggested that a short-term buying opportunity occurred on 27 September (based on improved market internals on the retest), although without market follow-thru, I was unwilling to call a buy; however, I did close shorts and increased stock holdings. I issued a Buy-Signal on 4 October, 6-days before the final bottom, based on stronger market action that confirmed the market internals signal. The NTSM sell-signal was issued 20 December, 8 sessions before the high of this recent bear market, based on the bearish “Friday Rundown” of indicators.)

Bottom line: I remain a cautious Bull, still expecting a decline of around 3-4% on the S&P 500 (from today’s close) to start soon. Indicators are suggesting there may be enough buying to delay a pullback a bit further, but I am skeptical of that.
 
FRIDAY MARKET INTERNALS (NYSE DATA)
My basket of Market Internals improved to BUY.
(My basket of Market Internals is a decent trend-following analysis of current market action, but should not be used alone for short term trading. They are most useful when they diverge from the Index.) 
 

Momentum Trading DOW Stocks & ETFs … Stock Market Analysis ...

Most of my Market Internals data comes from the WSJ.  They are having technical issues; the data didn’t update during the day and is clearly wrong as I write this.  Therefore, I’ll present what I can, but my Friday Indicator Summary and other Market commentary will have to wait until today’s data is corrected.
 
“Trade what you see; not what you think.” – The Old Fool, Richard McCranie, trader extraordinaire.
 
“I'm a liberal. I've been a liberal for sixty years. I happen to agree with all of these three [recent Supreme Court] cases. I have been arguing against using race in affirmative action since 1974. I have always preferred free expression and the First Amendment over any other laws...and many civil libertarians also support the decision that says that in a democracy, important decisions about spending fortunes of money should be made by the legislature, not by the unelected executive...it's just extremists, both on the court and off the court, that are screaming and yelling that somehow this ends our democracy in America. - Alan Dershowitz, Harvard Law professor emeritus.
 
“It was Thomas Edison who brought us electricity, not the Sierra Club. It was the Wright brothers who got us off the ground, not the Federal Aviation Administration. It was Henry Ford who ended the isolation of millions of Americans by making the automobile affordable, not Ralph Nader. Those who have helped the poor the most have not been those who have gone around loudly expressing 'compassion' for the poor, but those who found ways to make industry more productive and distribution more efficient, so that the poor of today can afford things that the affluent of yesterday could only dream about.”
― Thomas Sowell
 
JUNE JOBS REPORT CONTRARY TO ADP EMPLOYMENT (Heritage Capital)
“You cannot have a recession when the jobs market is this strong. Period. Full stop. Don’t argue. While other segments of the economy may be weaker or even weak, recession ain’t here. It wasn’t here last year when we had back to back quarters of negative GDP growth and it ain’t coming right now. It is coming down the road.” – Paul Schatz, President Heritage Capital.  Commentary at...
https://investfortomorrow.com/blog/june-report-completely-contrary-to-adp-bears-want-it-both-ways/
 
MARKET REPORT / ANALYSIS
-Friday the S&P 500 dropped about 0.3% to 4399.
-VIX dipped about 4% to 14.83.
-The yield on the 10-year Treasury rose to 4.068%.
 
PULLBACK DATA:
-Drop from Top: 8.3%. 25.4% max (on a closing basis).
-Trading Days since Top: 378-days.
The S&P 500 is 9.6% ABOVE its 200-dMA and 3.5% ABOVE its 50-dMA.
*I won’t call the correction over until the S&P 500 makes a new-high; however, evidence suggests the bottom was in the 3600 area and we called a buy on 4 October 2022.
 
MY TRADING POSITIONS:
I am not trading as much as in the past. You may wish to use the momentum charts and/or the Monday 40-day gain charts for trading the Dow stocks and ETFs.
 
MSFT – Microsoft.
XLK – Technology ETF.
XLY - Consumer Discretionary ETF.
 
KRE – Regional Banking ETF. This is a very small position for me. KRE tested the May 4 low of 36.08 on much lower volume 11 & 12 May.
I haven’t sold yet. On the positive side, it has not breached its recent low around 36.
 
SHY – Short term bonds. 30-day yield is 5.04% - 9 June 2023. (Trailing 1-year yield is 3.04%.) Once this weak period ends, I’ll sell SHY and buy stocks/stock ETFs.
 
ETF - MOMENTUM ANALYSIS:
TODAY’S RANKING OF 15 ETFs (Ranked Daily)
ETF ranking follows:

The top ranked ETF receives 100%. The rest are then ranked based on their momentum relative to the leading ETF.
*For additional background on the ETF ranking system see NTSM Page at…
http://navigatethestockmarket.blogspot.com/p/exchange-traded-funds-etf-ranking.html
DOW STOCKS - TODAY’S MOMENTUM RANKING OF THE DOW 30 STOCKS (Ranked Daily)
DOW 30 momentum ranking follows:
 

The top ranked Stock receives 100%. The rest are then ranked based on their momentum relative to the leading Stock.
For more details, see NTSM Page at…
https://navigatethestockmarket.blogspot.com/p/a-system-for-trading-dow-30-stocks-my_8.html
 
 
...My current invested position is about 55% stocks, including stock mutual funds and ETFs. I’m usually about 50% invested in stocks.
 
I trade about 15-20% of the total portfolio using the momentum-based analysis I provide here. If I can see a definitive bottom, I’ll add a lot more stocks to the portfolio using an S&P 500 ETF.
 

Thursday, July 6, 2023

Jobless Claims ... ISM Non-Manufacturing Index ... JOLTS ... Crude Oil Inventories ... Momentum Trading DOW Stocks & ETFs … Stock Market Analysis ...

 
“Trade what you see; not what you think.” – The Old Fool, Richard McCranie, trader extraordinaire.
 
ADP EMPLOYMENT CHANGE (ADP via PR Newswire)
“Private employers added 497,000 jobs in June
Job creation surged in June, led by consumer-facing services. Leisure and hospitality, trade and transportation, and education and health services showed strong gains. Still, the market was fragmented, with manufacturing, information, and finance showing declines.” Press release at...
https://www.prnewswire.com/news-releases/adp-national-employment-report-private-sector-employment-increased-by-497-000-jobs-in-june-annual-pay-was-up-6-4-301871086.html
 
JOBLESS CLAIMS (Yahoo Finance)
“The number of Americans filing new claims for unemployment benefits increased moderately last week, pointing to only a gradual easing in labor market conditions.
Initial claims for state unemployment benefits rose 12,000 to a seasonally adjusted 248,000 for the week ended July 1...” Story at...
https://finance.yahoo.com/news/us-weekly-jobless-claims-rise-124623086.html
 
ISM NON-MANUFACTURING INDEX (PR Newswire)
“Economic activity in the services sector expanded in June for the sixth consecutive month as the Services PMI® registered 53.9 percent, say the nation's purchasing and supply executives in the latest Services ISM® Report On Business®. The sector has grown in 36 of the last 37 months, with the lone contraction in December of last year.” Story at...
https://www.prnewswire.com/news-releases/services-pmi-at-53-9-june-2023-services-ism-report-on-business-301870344.html
 
JOLTS JOB OPENINGS (CNN)
“The number of available jobs in the United States dropped in May after an uptick the month before, the Bureau of Labor Statistics reported Thursday. Job openings fell to 9.82 million at the end of May, dropping from an upwardly revised 10.3 million in April, according to the BLS’ latest Job Openings and Labor Turnover Survey report.” Story at...
https://www.cnn.com/2023/07/06/economy/jolts-job-openings-may/index.html
 
CRUDE OIL INVENTORIES (EIA)
“U.S. commercial crude oil inventories (excluding those in the Strategic Petroleum Reserve) decreased by 1.5 million barrels from the previous week. At 452.2 million barrels, U.S. crude oil inventories are approximately 1% below the five year average for this time of year.” Report at...
https://ir.eia.gov/wpsr/wpsrsummary.pdf
 
MARKET REPORT / ANALYSIS
-Thursday the S&P 500 dropped about 0.8% to 4412.
-VIX rose about 9% to 15.44.
-The yield on the 10-year Treasury rose to 4.051%.
 
PULLBACK DATA:
-Drop from Top: 8%. 25.4% max (on a closing basis).
-Trading Days since Top: 377-days.
The S&P 500 is 10% ABOVE its 200-dMA and 3.9% ABOVE its 50-dMA.
*I won’t call the correction over until the S&P 500 makes a new-high; however, evidence suggests the bottom was in the 3600 area and we called a buy on 4 October 2022.
 
MY TRADING POSITIONS:
I am not trading as much as in the past. You may wish to use the momentum charts and/or the Monday 40-day gain charts for trading the Dow stocks and ETFs.
 
MSFT – Microsoft.
XLK – Technology ETF.
XLY - Consumer Discretionary ETF.
 
KRE – Regional Banking ETF. This is a very small position for me. KRE tested the May 4 low of 36.08 on much lower volume 11 & 12 May.
I haven’t sold yet. On the positive side, it has not breached its recent low around 36.
 
SHY – Short term bonds. 30-day yield is 5.04% - 9 June 2023. (Trailing 1-year yield is 3.04%.) Once this weak period ends, I’ll sell SHY and buy stocks/stock ETFs.
 
TODAY’S COMMENT:
The expectation was that private employers would add 220,000 jobs. Today’s ADP report was more than twice that value, a stunning high in job creation.  This report was concerning for the markets (according to many) because it is not the direction desired by the FED and may give them impetus to hike rates. That’s possible, but we have been suggesting a pullback for a week or two so today could simply be a sign of that pullback. It doesn’t really matter. As noted yesterday, there is not much change in my view – I’m expecting a small, normal retreat of 4-5%.
 
The pundits were all about how a rise above 4% in the 10-year yield would be a disaster for stocks. It hasn’t been that long ago when the same pundits said a rise above 3% would spell disaster for stocks, so I won’t worry too much. Instead, I’ll wait for Mr. Market to give us more clues.
 
The daily spread of 20 Indicators (Bulls minus Bears) slipped from +3 to -6 (a positive number is bullish; negatives are bearish); the 10-day smoothed sum that smooths the daily fluctuations declined from -20 to -21. (The trend direction is more important than the actual number for the 10-day value.) These numbers sometimes change after I post the blog based on data that comes in late. Most of these 20 indicators are short-term so they tend to bounce around a lot.
 
LONG-TERM INDICATOR: The Long Term NTSM indicator remained HOLD: PRICE is positive; SENTIMENT, VIX & VOLUME are neutral.
 
(The important BUY in this indicator was on 21 October, 7-days after the bottom. For my NTSM overall signal, I suggested that a short-term buying opportunity occurred on 27 September (based on improved market internals on the retest), although without market follow-thru, I was unwilling to call a buy; however, I did close shorts and increased stock holdings. I issued a Buy-Signal on 4 October, 6-days before the final bottom, based on stronger market action that confirmed the market internals signal. The NTSM sell-signal was issued 20 December, 8 sessions before the high of this recent bear market, based on the bearish “Friday Rundown” of indicators.)
 
Bottom line: I remain a cautious Bull, still expecting a decline of around 4-5% on the S&P 500 to start soon.
 
ETF - MOMENTUM ANALYSIS:
TODAY’S RANKING OF 15 ETFs (Ranked Daily)
ETF ranking follows:

The top ranked ETF receives 100%. The rest are then ranked based on their momentum relative to the leading ETF.
*For additional background on the ETF ranking system see NTSM Page at…
http://navigatethestockmarket.blogspot.com/p/exchange-traded-funds-etf-ranking.html
DOW STOCKS - TODAY’S MOMENTUM RANKING OF THE DOW 30 STOCKS (Ranked Daily)
DOW 30 momentum ranking follows:
 
The top ranked Stock receives 100%. The rest are then ranked based on their momentum relative to the leading Stock.
For more details, see NTSM Page at…
https://navigatethestockmarket.blogspot.com/p/a-system-for-trading-dow-30-stocks-my_8.html
 
THURSDAY MARKET INTERNALS (NYSE DATA)
My basket of Market Internals remained HOLD.
(My basket of Market Internals is a decent trend-following analysis of current market action, but should not be used alone for short term trading. They are most useful when they diverge from the Index.) 
 
...My current invested position is about 55% stocks, including stock mutual funds and ETFs. I’m usually about 50% invested in stocks.
 
I trade about 15-20% of the total portfolio using the momentum-based analysis I provide here. If I can see a definitive bottom, I’ll add a lot more stocks to the portfolio using an S&P 500 ETF.
 

Wednesday, July 5, 2023

FED Minutes ... Factory Orders ... Momentum Trading DOW Stocks & ETFs … Stock Market Analysis ...

 
Thursday’s blog post is likely to be later in the  evening. It’s a busy day for me.


“Trade what you see; not what you think.” – The Old Fool, Richard McCranie, trader extraordinaire.
 
"I think we are at a point in our country's history where people are dying for a generational shift...The party that figures that out has the upper hand next year." – Karl Rove, Former White House Chief of Staff
 
Hottest Day Ever (CNBC)
“Scientists warned Tuesday’s temperature record was likely to be the first of many over the coming months, citing the combination of the climate crisis and the El Niño phenomenon.” Story at...
https://www.cnbc.com/2023/07/05/climate-crisis-world-registers-hottest-day-since-records-began.html
El Nino doesn’t increase Global Warming – it merely transfers heat from the warm Pacific Ocean to the atmosphere. On balance, global temperature will not change due to El Nino. Once again, El Nino is a weather event, not climate, but don’t expect the press to report it properly, or the global alarmists to present it honestly. None of this changes that the earth is warming (1 degree C over the past 100 years) due to human influences.
 
FOMC MINUTES (CNBC)
“Almost all Federal Reserve officials at their June meeting indicated further tightening is likely, if at a slower pace than the rapid-fire rate increases that had characterized monetary policy since early 2022, according to minutes released Wednesday.” Story at...
https://www.cnbc.com/2023/07/05/fed-minutes-july-2023-.html
 
FACTORY ORDERS (RTTnews)
“New orders for U.S. manufactured goods increased by much less than expected in the month of May, according to a report released by the Commerce Department on Wednesday. The Commerce Department said factory orders rose by 0.3 percent in May...” Story at...
https://www.rttnews.com/3373958/u-s-factory-orders-rise-much-less-than-expected-in-may.aspx
 
MARKET REPORT / ANALYSIS
-Wednesday the S&P 500 slipped about 0.2% to 4447.
-VIX rose about 5% to 14.18.
-The yield on the 10-year Treasury rose to 3.938%.
 
PULLBACK DATA:
-Drop from Top: 7.3%. 25.4% max (on a closing basis).
-Trading Days since Top: 376-days.
The S&P 500 is 11% ABOVE its 200-dMA and 4.9% ABOVE its 50-dMA.
*I won’t call the correction over until the S&P 500 makes a new-high; however, evidence suggests the bottom was in the 3600 area and we called a buy on 4 October 2022.
 
MY TRADING POSITIONS:
I am not trading as much as in the past. You may wish to use the momentum charts and/or the Monday 40-day gain charts for trading the Dow stocks and ETFs.
 
MSFT – Microsoft.
XLK – Technology ETF.
XLY - Consumer Discretionary ETF.
 
KRE – Regional Banking ETF. This is a very small position for me. KRE tested the May 4 low of 36.08 on much lower volume 11 & 12 May.
I haven’t sold yet. On the positive side, it has not breached its recent low around 36.
 
SHY – Short term bonds. 30-day yield is 5.04% - 9 June 2023. (Trailing 1-year yield is 3.04%.) Once this weak period ends, I’ll sell SHY and buy stocks/stock ETFs.
 
TODAY’S COMMENT:
Not much change in my view – I’m expecting a small, normal retreat of 4-5%.
 
The daily spread of 20 Indicators (Bulls minus Bears) slipped from +4 to +3 (a positive number is bullish; negatives are bearish); the 10-day smoothed sum that smooths the daily fluctuations improved from -24 to -20. (The trend direction is more important than the actual number for the 10-day value.) These numbers sometimes change after I post the blog based on data that comes in late. Most of these 20 indicators are short-term so they tend to bounce around a lot.
 
LONG-TERM INDICATOR: The Long Term NTSM indicator slipped to HOLD: PRICE is positive; SENTIMENT, VIX & VOLUME are neutral.
 
(The important BUY in this indicator was on 21 October, 7-days after the bottom. For my NTSM overall signal, I suggested that a short-term buying opportunity occurred on 27 September (based on improved market internals on the retest), although without market follow-thru, I was unwilling to call a buy; however, I did close shorts and increased stock holdings. I issued a Buy-Signal on 4 October, 6-days before the final bottom, based on stronger market action that confirmed the market internals signal. The NTSM sell-signal was issued 20 December, 8 sessions before the high of this recent bear market, based on the bearish “Friday Rundown” of indicators.)
 
Bottom line: I remain a cautious Bull, still expecting a decline of around 4-5% on the S&P 500 to start soon.
 
ETF - MOMENTUM ANALYSIS:
TODAY’S RANKING OF 15 ETFs (Ranked Daily)
ETF ranking follows:

The top ranked ETF receives 100%. The rest are then ranked based on their momentum relative to the leading ETF.
*For additional background on the ETF ranking system see NTSM Page at…
http://navigatethestockmarket.blogspot.com/p/exchange-traded-funds-etf-ranking.html
DOW STOCKS - TODAY’S MOMENTUM RANKING OF THE DOW 30 STOCKS (Ranked Daily)
DOW 30 momentum ranking follows:
 
The top ranked Stock receives 100%. The rest are then ranked based on their momentum relative to the leading Stock.
For more details, see NTSM Page at…
https://navigatethestockmarket.blogspot.com/p/a-system-for-trading-dow-30-stocks-my_8.html
 
WEDNESDAY MARKET INTERNALS (NYSE DATA)
My basket of Market Internals remained HOLD. (My basket of Market Internals is a decent trend-following analysis of current market action, but should not be used alone for short term trading. They are most useful when they diverge from the Index.) 
 
...My current invested position is about 55% stocks, including stock mutual funds and ETFs. I’m usually about 50% invested in stocks.
 
I trade about 15-20% of the total portfolio using the momentum-based analysis I provide here. If I can see a definitive bottom, I’ll add a lot more stocks to the portfolio using an S&P 500 ETF.
 

Monday, July 3, 2023

Supreme Court Blocks Student Loan Forgiveness ... ISM Manufacturing ... Momentum Trading DOW Stocks & ETFs … Stock Market Analysis ...

 
“Trade what you see; not what you think.” – The Old Fool, Richard McCranie, trader extraordinaire.
 
SUPREME COURT CONSERVATIVES BLOCK BIDEN’S STUDENT LOAN FORGIVENESS (Washington Post)
“The Supreme Court on Friday said President Biden does not have authority for his roughly $400 billion program to forgive student loan debt, the latest blow from a Supreme Court that has been dismissive of this administration’s bold claims of power.” Story at
https://www.washingtonpost.com/politics/2023/06/30/supreme-court-decision-student-loan-forgiveness/
My cmt: The Constitution is clear: Federal spending is controlled by the Legislative Branch, not the Executive Branch of Government. The most troubling fact in this decision is that 3 Justices of the Supreme Court don’t understand the Constitution, the very document they are enjoined to interpret. Didn’t they take Civics in high school? ...
... In reality, I think they understand the Constitution very well.  They just chose to ignore it (even though they swore an oath to uphold it) – the very definition of judicial hubris.
...Even Biden knew he didn’t have the authority to cancel the debt. Last year USA Today wrote, “During a weekend interview [in October 2022] with the progressive group NowThis News, President Joe Biden made the startling claim that he had ‘signed a law to forgive student debt.’  After going into some detail about how much the ‘law’ would offer 40 million Americans, he also said, ‘It’s passed. I got it passed by a vote or two, and it’s in effect.’” Story from USA Today at...
https://www.usatoday.com/story/opinion/columnist/2022/10/26/biden-student-debt-relief-gaffe-should-alarm-all-americans/10595785002/
Biden’s claim wasn’t true, of course. This is just another example of our President’s declining mental facilities; but at least he understands the Constitution, or did 8 months ago.
 
WHAT PRETEXT DID THE PRESIDENT USE FOR HIS AUTHORITY? (msn.com)
“President Biden was using the Higher Education Relief Opportunities for Students (HEROES) Act of 2003 to order the largest loan forgiveness program in U.S. history. The law is only a few pages long and was intended to assist military personnel deployed abroad in combat zones. The idea of using that law in order to avoid getting congressional approval for such a massive expenditure was laughable. The Office of Legal Counsel considered the theory and issued a memo stating that it would be unconstitutional.” Story at...
https://www.msn.com/en-us/news/politics/constitutional-cruelty-democrats-now-oppose-a-democratic-process-on-student-loans/ar-AA1dinu9?cvid=cfda53592d24465d9b79d31241846c7d&ei=18
 
ANHEUSER-BUSCH DISASTER ROLLS ON (msn.com)
“Hard to believe, given that Mulvaney’s face on a can spurned this entire marketing mess for Bud Light parent company Anheuser-Busch in the first place, but the transgender influencer has taken the same stance as many others in the LGBTQ+ community — accusing the brand of not offering support amidst a massive backlash for using Mulvaney in the first place.” Story at...
Anheuser-Busch Fires Back at Dylan Mulvaney as Bud Light Marketing Disaster Rolls On (msn.com)
My cmt: Bud Light sales have dropped 24% since they used transgender influencer, Dylan Mulvaney, as a spokesman. The failure of Busch to understand its Bud Light customers will be taught in Business Schools for generations.
 
Oh...Were you expecting a financial blog? ...
 
ISM MANUFACTURING (ISM via prnewswire)
“The June Manufacturing PMI® registered 46 percent, 0.9 percentage point lower than the 46.9 percent recorded in May. Regarding the overall economy, this figure indicates a seventh month of contraction after a 30-month period of expansion... Demand remains weak, production is slowing due to lack of work, and suppliers have capacity. There are signs of more employment reduction actions in the near term.” Press release at...
https://www.prnewswire.com/news-releases/manufacturing-pmi-at-46-june-2023-manufacturing-ism-report-on-business-301868365.html
 
MARKET REPORT / ANALYSIS
-Monday the S&P 500 rose about 0.1% to 4456.
-VIX slipped about 0.4% to 13.57.
-The yield on the 10-year Treasury rose to 3.858%.
 
PULLBACK DATA:
-Drop from Top: 7.1%. 25.4% max (on a closing basis).
-Trading Days since Top: 375-days.
The S&P 500 is 11.3% ABOVE its 200-dMA and 5.3% ABOVE its 50-dMA.
*I won’t call the correction over until the S&P 500 makes a new-high; however, evidence suggests the bottom was in the 3600 area and we called a buy on 4 October 2022.
 
MY TRADING POSITIONS:
I am not trading as much as in the past. You may wish to use the momentum charts and/or the Monday 40-day gain charts for trading the Dow stocks and ETFs.
 
MSFT – Microsoft.
XLK – Technology ETF.
XLY - Consumer Discretionary ETF.
 
KRE – Regional Banking ETF. This is a very small position for me. KRE tested the May 4 low of 36.08 on much lower volume 11 & 12 May.
I haven’t sold yet. On the positive side, it has not breached its recent low around 36.
 
SHY – Short term bonds. 30-day yield is 5.04% - 9 June 2023. (Trailing 1-year yield is 3.04%.) Once this weak period ends, I’ll sell SHY and buy stocks/stock ETFs.
 
TODAY’S COMMENT:
Volume was low today; trading closed at 1pm. Indicators improved, but the main issue for the S&P 500 is that it is at its upper trend line.  This suggests the rate of future increases are somewhat limited. The Index may continue higher as it crawls along that upper trendline, but sooner or later, it will begin a decline toward the lower trend line and the 50-dMA. I suspect that will begin shortly after the Holiday based on previous indicators. For now, current indicators are improving so I could be wrong. That’s why I remain fully invested.
 
The daily spread of 20 Indicators (Bulls minus Bears) remained +4 (a positive number is bullish; negatives are bearish); the 10-day smoothed sum that smooths the daily fluctuations improved from -29 to -24. (The trend direction is more important than the actual number for the 10-day value.) These numbers sometimes change after I post the blog based on data that comes in late. Most of these 20 indicators are short-term so they tend to bounce around a lot.
 
LONG-TERM INDICATOR: The Long Term NTSM indicator remained BUY: PRICE & VIX are positive; SENTIMENT & VOLUME are neutral.
 
(The important BUY in this indicator was on 21 October, 7-days after the bottom. For my NTSM overall signal, I suggested that a short-term buying opportunity occurred on 27 September (based on improved market internals on the retest), although without market follow-thru, I was unwilling to call a buy; however, I did close shorts and increased stock holdings. I issued a Buy-Signal on 4 October, 6-days before the final bottom, based on stronger market action that confirmed the market internals signal. The NTSM sell-signal was issued 20 December, 8 sessions before the high of this recent bear market, based on the bearish “Friday Rundown” of indicators.)
 
Bottom line: I remain a cautious Bull, still expecting a decline of around 4-5% on the S&P 500 to start soon.
 
ETF - MOMENTUM ANALYSIS:
TODAY’S RANKING OF 15 ETFs (Ranked Daily)
ETF ranking follows:

The top ranked ETF receives 100%. The rest are then ranked based on their momentum relative to the leading ETF.
*For additional background on the ETF ranking system see NTSM Page at…
http://navigatethestockmarket.blogspot.com/p/exchange-traded-funds-etf-ranking.html

DOW STOCKS - TODAY’S MOMENTUM RANKING OF THE DOW 30 STOCKS (Ranked Daily)
DOW 30 momentum ranking follows:

The top ranked Stock receives 100%. The rest are then ranked based on their momentum relative to the leading Stock.
For more details, see NTSM Page at…
https://navigatethestockmarket.blogspot.com/p/a-system-for-trading-dow-30-stocks-my_8.html
MONDAY MARKET INTERNALS (NYSE DATA)
My basket of Market Internals slipped to HOLD.
(My basket of Market Internals is a decent trend-following analysis of current market action, but should not be used alone for short term trading. They are most useful when they diverge from the Index.) 
 
...My current invested position is about 55% stocks, including stock mutual funds and ETFs. I’m usually about 50% invested in stocks.
 
I trade about 15-20% of the total portfolio using the momentum-based analysis I provide here. If I can see a definitive bottom, I’ll add a lot more stocks to the portfolio using an S&P 500 ETF.