ISM Manufacturing ... Construction Spending ... Momentum Trading DOW Stocks & ETFs … Stock Market Analysis ...
“Trade what you see; not what you think.” – The Old Fool,
Richard McCranie, trader extraordinaire.
“Weariness of rational standards in one generation
becomes a pathetic ignorance of them in the next.” - Frederick Crews, Professor
emeritus of English, University of California, Berkeley,
“A severe storm dumped more than 7 inches of rain in less
than 24 hours over parts of New York City on Friday, turning streets into
fast-moving rivers and grinding subway travel to a halt as water cascaded into
underground transit stations...Steve Bowen, chief science officer for Gallagher
Re, a global reinsurance broker, said... “The bottom line is that we have
infrastructure in New York, infrastructure all across the U.S. and frankly in
many, many parts of the world that is just simply not capable
of withstanding the climate that we’re seeing today...” Story at...
https://www.nbcnews.com/science/environment/nyc-flooding-climate-change-infrastructure-limitations-rcna118170
My cmt: The rain came from a stalled tropical system,
Ophelia, that merged with a front. Gee, that’s never happened before. It must
be Global Warming?
TRUMP CO-DEFENDANT PLEADS GUILTY IN GEORGIA (CNBC)
“Scott Hall, one of the 18 co-defendants of former
President Donald Trump in
his Georgia election
interference case, pleaded guilty Friday in Atlanta to
five misdemeanor conspiracy charges... At a hearing in Fulton County Superior
Court, Hall confirmed to Judge Scott McAfee that his plea deal requires him to
testify in future proceedings in the case, including trials of his
co-defendants, including Trump.” Story at...
https://www.cnbc.com/2023/09/29/first-co-defendant-in-trump-georgia-election-case-pleads-guilty.html
ISM MANUFACTURING INDEX (ISM via prnewswire)
"The Manufacturing PMI® registered 49 percent
in September, 1.4 percentage points higher than the 47.6 percent recorded in
August. The overall economy expanded weakly after nine months of contraction
following a 30-month period of expansion. (A Manufacturing PMI® above 48.7
percent, over a period of time, generally indicates an expansion of the overall
economy.)” Press release at...
https://www.prnewswire.com/news-releases/manufacturing-pmi-at-49-september-2023-manufacturing-ism-report-on-business-301943535.html
CONSTRUCTION SPENDING (Yahoo Finance/Reuters)
“U.S. construction spending increased in August, lifted
by outlays on single- and multi-family housing, though mortgage rates at nearly
23-year highs could slow momentum. The Commerce Department said on Monday that
construction spending rose 0.5%.” Story at...
https://finance.yahoo.com/news/us-construction-spending-rises-august-144244258.html
MARKET REPORT / ANALYSIS
-Monday the S&P 500 was unchanged at 4288.
-VIX rose about 0.5% to 17.61.
-The yield on the 10-year Treasury rose to 4.676%.
PULLBACK DATA:
-Drop from Top: 10.6%. 25.4% max (on a closing basis).
-Trading Days since Top: 438-days.
The S&P 500 is 2.1% ABOVE its 200-dMA and 3.6%
BELOW its 50-dMA.
*I won’t call the correction over until the S&P 500
makes a new-high; however, evidence suggests the bottom was in the 3600 area
and we called a buy on 4 October 2022.
MY TRADING POSITIONS:
XLK – Technology ETF (holding since the October 2022
lows).
XLY - Consumer Discretionary ETF. (Holding since the
October 2022 lows - I bought more XLY Monday, 8/21.)
I took profits and then reestablished positions as
follows:
SPY – I bought a large position in the S&P 500 Friday,
8/14, in my 401k (it has limited choices).
XLE – Added Tuesday, 8/22.
SSO – 2x S&P 500 ETF. Added 8/24.
CSCO – added 9/5.
TODAY’S COMMENT:
Mary Ann Bartels, of Sanctuary Wealth said this afternoon
on CNBC’s Fast Money, “This is just a correction. Expect a 5-10% pullback from
July highs.” (A 10% drop would be 4130 on the S&P 500.) I tend to agree
with her assessment, but the first of the month is when a lot of automatic
deposits are made into 401k accounts. The early part of the month, especially
the first trading day, is usually up, so it is a little disconcerting to see
the markets down/flat today. Breadth slipped today as market internals were
very weak and that’s a worrying sign.
The way the market has been trading recently suggests
further downside ahead. I don’t expect the Index to fall much below its
200-dMA, but then I didn’t expect a drop below the 50-dMA either. The 200-dMA
is now 4200 for the Index. The 200-dMA is about 2% below today’s (Monday’s)
close.
I am going to remain fully invested unless the Index
falls below the 200dMA; I’ll reevaluate if it does.
The daily spread of 20 Indicators (Bulls minus Bears) remained
-8 (a positive number is bullish; negatives are bearish); the 10-day smoothed
sum that smooths the daily fluctuations declined from -69 to -71. (The
trend direction is more important than the actual number for the 10-day value.)
These numbers sometimes change after I post the blog based on data that comes
in late. Most of these 20 indicators are short-term so they tend to bounce
around a lot.
LONG-TERM INDICATOR: The Long Term NTSM indicator
remained SELL: VOLUME & PRICE are bearish; SENTIMENT & VIX are neutral.
I’m not selling now. I’d prefer to hang on since I
am still expecting a relatively shallow pullback from August highs and if the
markets haven’t bottomed yet, they are not far from it.
(The important BUY in this indicator was on 21 October,
7-days after the bottom. For my NTSM overall signal, I suggested that a
short-term buying opportunity occurred on 27 September (based on improved
market internals on the retest), although without market follow-thru, I was
unwilling to call a buy; however, I did close shorts and increased stock
holdings. I issued a Buy-Signal on 4 October, 6-days before the final bottom,
based on stronger market action that confirmed the market internals signal. The
NTSM sell-signal was issued 21 December, 9 sessions before the high of this
recent bear market, based on the bearish “Friday Rundown” of indicators.)
I am still cautiously optimistic – The S&P 500 may
have bottomed, but I don’t see a confirmation in the indicators, yet.
ETF - MOMENTUM ANALYSIS:
TODAY’S RANKING OF 15 ETFs
(Ranked Daily)
ETF ranking follows:
The top ranked ETF receives
100%. The rest are then ranked based on their momentum relative to the leading
ETF.
*For additional background on
the ETF ranking system see NTSM Page at…
http://navigatethestockmarket.blogspot.com/p/exchange-traded-funds-etf-ranking.html
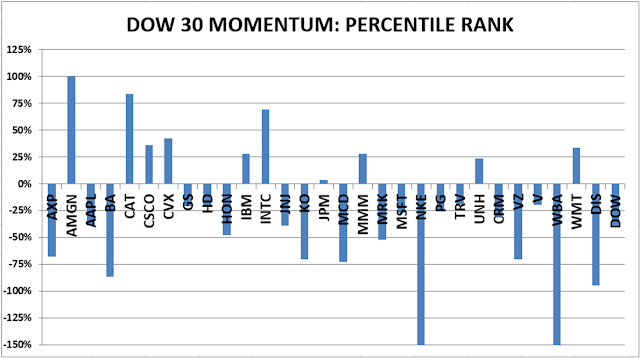
DOW STOCKS - TODAY’S MOMENTUM RANKING
OF THE DOW 30 STOCKS (Ranked Daily)
DOW 30 momentum ranking
follows:
The top ranked Stock receives
100%. The rest are then ranked based on their momentum relative to the leading Stock.
For more details, see NTSM
Page at…
https://navigatethestockmarket.blogspot.com/p/a-system-for-trading-dow-30-stocks-my_8.html
MONDAY MARKET INTERNALS (NYSE
DATA)
My basket of Market Internals remained SELL. (My basket of Market
Internals is a decent trend-following analysis of current market action, but
should not be used alone for short term trading. They are most useful when they
diverge from the Index.)
...My current invested
position is about 75% stocks, including stock mutual funds and ETFs. I’m
usually about 50% invested in stocks. I’m “over invested” now expecting new,
all-time highs this year. That burns all the cash. I have about 25% of the portfolio in bonds.
I trade about 15-20% of the
total portfolio using the momentum-based analysis I provide here. When I see a
definitive bottom, I add a lot more stocks to the portfolio using an S&P
500 ETF as I did back in October.