Momentum Trading DOW Stocks & ETFs … Stock Market Analysis ...
“Trade what you see; not what you think.” – The Old Fool,
Richard McCranie, trader extraordinaire.
“The S&P 500 has some more downside this week to
breach the October lows and bottom somewhere around 4200. 4200 is not some
magical number. Stocks could bottom just above or a few percent below, but that
scenario relies on the market finding buying interest this coming week.” Paul
Schatz, President Heritage Capital. Commentary at...
https://investfortomorrow.com/blog/ugly-friday-for-the-bulls-but-it-is-monday-scenario-building-for-q4/
MARKET REPORT / ANALYSIS
-Monday the S&P 500 fell 0.2% to 4217.
-VIX bucked the trend and dropped about 6% to 20.37.
-The yield on the 10-year Treasury slipped to 4.848%.
PULLBACK DATA:
-Drop from Top: 12.1%. 25.4% max (on a closing basis).
(47% retracement.)
-Trading Days since Top: 453-days.
The S&P 500 is 0.4% BELOW its 200-dMA and 3.8%
BELOW its 50-dMA.
*I won’t call the correction over until the S&P 500
makes a new-high; however, evidence suggests the bottom was in the 3600 area
and we called a buy on 4 October 2022.
MY TRADING POSITIONS:
XLK – Technology ETF (holding since the October 2022
lows).
XLY - Consumer Discretionary ETF. (Holding since the
October 2022 lows - I bought more XLY Monday, 8/21.)
I took profits and then reestablished positions as
follows:
SPY – I bought a large position in the S&P 500
Friday, 8/14, in my 401k (it has limited choices).
XLE – Added Tuesday, 8/22.
SSO – 2x S&P 500 ETF. Added 8/24.
CSCO – added 9/5.
I have considered selling CSCO because it is no longer
a momentum leader - but I am still holding it. INTC would probably have been my
choice, but it has been under pressure due to restrictions on chip sales to
China.
TODAY’S COMMENT:
I am watching the numbers as the markets fall to see if
we can I identify a bottom of this dip. So far, no bottom. Volume was lower
today, but other internals were worse.
I updated the Summary of Indicators and it was worse, too:
Monday there were 2 Bull and 20 Bear indicators. (It was 2 Bull and 18 Bear
Friday.)
Cyclical Industrials (XLI) are under-performing the
S&P 500 Index and that is a bearish sign. I thought I’d take a look at Consumer
Staples (XLP) vs. the Index. If
investors are concerned, then XLP should be outpacing the S&P 500. Over the last 5 days, XLP has outperformed
the Index, a bearish sign. On the bullish side, the Index is outpacing
Utilities (XLU); But, in the end, price matters most and the Index has broken
its 200-dMA so I am looking at Trend Break rules.
Trend breaks are declared on several different rules, depending
on who is doing the talking: (1) when price exceeds an established trendline 2
days in a row. (2) Others say a break must be 3% above or below the trend line. If we apply that to the 200-dMA, we may
accept a drop below 4108 as a point to sell. (3) Lance Roberts says a break
below the 200-dMA must stay there for a trading week, 5-days. Pick your poison.
The markets may be close to a bottom, but how much more
can I take? Not much, but I am going to be patient for a bit longer.
The daily spread of 20 Indicators (Bulls minus Bears) declined
from -11 to -12 (a positive number is bullish; negatives are bearish); the
10-day smoothed sum that smooths the daily fluctuations declined from +7
to -8. (The trend direction is more important than the actual number for the
10-day value.) These numbers sometimes change after I post the blog based on
data that comes in late. Most of these 20 indicators are short-term so they
tend to bounce around a lot.
LONG-TERM INDICATOR: The Long Term NTSM indicator switched
to SELL: VOLUME & VIX is bearish; PRICE & SENTIMENT are neutral. I may
be following this indicator soon; but not yet.
(The important BUY in this indicator was on 21 October,
7-days after the bottom. For my NTSM overall signal, I suggested that a
short-term buying opportunity occurred on 27 September (based on improved
market internals on the retest), although without market follow-thru, I was
unwilling to call a buy; however, I did close shorts and increased stock
holdings. I issued a Buy-Signal on 4 October, 6-days before the final bottom,
based on stronger market action that confirmed the market internals signal. The
NTSM sell-signal was issued 21 December, 9 sessions before the high of this
recent bear market, based on the bearish “Friday Rundown” of indicators.)
BOTTOM LINE HASN’T CHANGED:
I haven’t sold yet, but with today’s test of recent lows
and a test of the 200-dMA, we must be concerned. The Friday Summary Rundown of
Indicators is also quite bearish. If we
see more losses this week, I’ll be forced to take profits going back to the
October 2022 lows. (They are now a lot less than they were in June.) The
markets may bounce higher – I’ll wait and see what happens Monday and maybe
Tuesday. About 3 weeks ago, I said that I didn’t expect the S&P 500 to fall
much below 4200 – we’ll see.
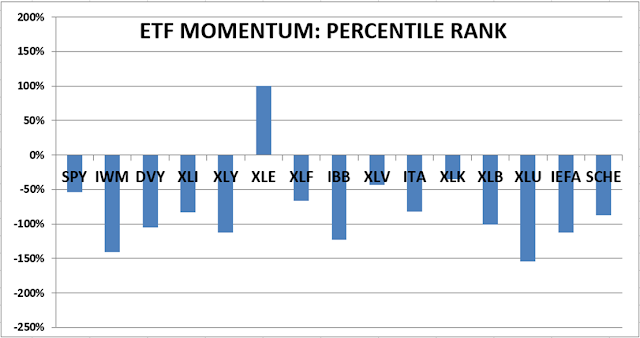
ETF - MOMENTUM ANALYSIS:
TODAY’S RANKING OF 15 ETFs (Ranked Daily)
ETF ranking follows:
The top ranked ETF receives
100%. The rest are then ranked based on their momentum relative to the leading
ETF.
*For additional background on
the ETF ranking system see NTSM Page at…
http://navigatethestockmarket.blogspot.com/p/exchange-traded-funds-etf-ranking.html
DOW STOCKS - TODAY’S MOMENTUM RANKING
OF THE DOW 30 STOCKS (Ranked Daily)
DOW 30 momentum ranking
follows:
The top ranked Stock receives
100%. The rest are then ranked based on their momentum relative to the leading Stock.
For more details, see NTSM
Page at…
https://navigatethestockmarket.blogspot.com/p/a-system-for-trading-dow-30-stocks-my_8.html
MONDAY MARKET INTERNALS (NYSE
DATA)
My basket of Market Internals remained SELL. (My basket of Market
Internals is a decent trend-following analysis of current market action, but
should not be used alone for short term trading. They are most useful when they
diverge from the Index.)
...My current invested
position is about 75% stocks, including stock mutual funds and ETFs. I’m
usually about 50% invested in stocks. I’m “over invested” now expecting new,
all-time highs this year. That burns all the cash. I have about 25% of the portfolio in bonds.
I trade about 15-20% of the
total portfolio using the momentum-based analysis I provide here. When I see a
definitive bottom, I add a lot more stocks to the portfolio using an S&P
500 ETF as I did back in October.