JOLTS - Job Openings Report ... Momentum Trading DOW Stocks & ETFs … Stock Market Analysis ...
“Trade what you see; not what you think.” – The Old Fool,
Richard McCranie, trader extraordinaire.
“On Monday, October 2, 2023, the United States Supreme
Court rejected a request to block Donald Trump’s 2024 presidential
candidacy. The request, based on accusations of incitement to riot on
January 6, 2021, was filed by Texas State tax consultant John Anthony Castro.”
From...
Supreme
Court rejects Trump's candidacy (msn.com)
My cmt: This ruling is meaningless. The Court ruled Castro didn’t have
standing. There will be other challengers
who do have standing where the Court will need to issue a ruling.
“The U.S. Supreme Court on
Monday rejected an appeal by conservative lawyer John Eastman in which he
attempted to shield a number of emails from congressional investigators
pertaining to the results of the 2020 election and the January 6, 2021, riot at
the U.S. Capitol. Eastman is one of 19 individuals, including former
President Donald Trump, indicted in August in Fulton County, Georgia,
for allegedly interfering in the state's election in order to
overturn results in Trump's favor.” Story at...
Clarence
Thomas in Spotlight as Supreme Court Delivers Blow to Trump Ally (msn.com)
...a judge in the Democrat-run city [Los Angeles] ruled
that holding inmates to cash bail when they can't afford to pay was a violation
of their constitutional rights... Governor Gavin Newsom has been a fierce
defender of the move claiming it would help 'root out racial inequity and
structural bias.'” From...
Los
Angeles' controversial new zero-bail policy takes effect after judge ruled that
cash bail discriminates against minorities and the poor (msn.com)
“Rep. Dean Phillips is stepping down from House
Democratic leadership after saying he's considering a primary challenge to
President Joe Biden... 'I have decided to step down from the DPCC &
Democratic Caucus leadership. While politics & official work do not mix,
it's clear my convictions about 2024 are incongruent with the position of my
colleagues & that was causing discomfort. I was not pressured or forced to
resign.'” From...
Top
Democrat steps DOWN from party leadership over his very skeptical view of
Biden, 80, running in 2024 (msn.com)
“...as I've said repeatedly on any number of occasions,
that the damage in his [Trump’s] first term has largely been repaired, but that
if he were elected to a second term, this time he might damage that would be
irreparable. This is a very dangerous period we’re about to enter into
here." – John Bolton, former ambassador to the United Nations and national security advisor under Trump
JOLTS – JOB OPENINGS (CNN)
“The number of job openings at US employers unexpectedly
jumped in August, a testament to the continued resilience of the labor market, according to new
data released Tuesday by the Bureau of Labor Statistics. There were an
estimated 9.61 million open jobs in August...” Story at...
https://www.cnn.com/2023/10/03/economy/jolts-job-openings-august/index.html
MARKET REPORT / ANALYSIS
-Tuesday the S&P 500 was down about 1.4% to 4229.
-VIX rose about 12% to 19.78.
-The yield on the 10-year Treasury rose to 4.795%. (The talk
on the tube was that the JOLTS report showed more job openings, a warning the
FED might raise rates again.)
PULLBACK DATA:
-Drop from Top: 11.8%. 25.4% max (on a closing basis).
-Trading Days since Top: 438-days.
The S&P 500 is 0.7% ABOVE its 200-dMA and 4.8%
BELOW its 50-dMA.
*I won’t call the correction over until the S&P 500
makes a new-high; however, evidence suggests the bottom was in the 3600 area
and we called a buy on 4 October 2022.
MY TRADING POSITIONS:
XLK – Technology ETF (holding since the October 2022
lows).
XLY - Consumer Discretionary ETF. (Holding since the
October 2022 lows - I bought more XLY Monday, 8/21.)
I took profits and then reestablished positions as
follows:
SPY – I bought a large position in the S&P 500
Friday, 8/14, in my 401k (it has limited choices).
XLE – Added Tuesday, 8/22.
SSO – 2x S&P 500 ETF. Added 8/24.
CSCO – added 9/5.
TODAY’S COMMENT:
The indicators continue to decline. If the market was
near a top, I’d say that there was divergence and it would be a clear sell
signal. But the S&P 500 is more than
2 months past its high and the Sell signals I am seeing are reflecting the weak
market and are not giving us signals that would be as useful had they been at
the top. Therefore, I am looking to other signs before I sell. It didn’t help
that weeks ago I got a very bullish signal where I had zero bear signs that
caused me to get greedy and go all-in. As it stands now, I am looking for other
signals of support – the lower trend line and the 200-day, moving average.
(200-dMA)
As the chart below shows, the S&P 500 is just now
reaching its lower trend line that goes back to October. The Index has already
violated shorter term trend lines.
Further, the S&P 500 is about 0.7% above its 200-dMA.
Intraday, the Index got to about 0.3% above its 200-dMA before it bounced
higher at the end of the day.
Today was a statistically significant down-day. That just
means that the price-volume move exceeded my statistical parameters. Statistics
show that a statistically-significant, down-day is followed by an up-day about
60% of the time. Bottoms almost always
occur on or near Statistically-significant, down-days, but not all
statistically-significant, down-days occur at bottoms. There are oversold signs
and today was the fifth statistically-significant day in the last 3 weeks. That
can be a sign of a top or a bottom.
Given the charts and oversold signs, it looks like it could be a bottom,
but we don’t have a bottom indication since Bollinger Bands are not oversold..
I am going to remain fully invested unless the Index
falls below the 200-dMA; I’ll reevaluate if it does.
The daily spread of 20 Indicators (Bulls minus Bears) declined
from -8 to -11 (a positive number is bullish; negatives are bearish); the 10-day
smoothed sum that smooths the daily fluctuations declined from -71 to -75.
(The trend direction is more important than the actual number for the 10-day
value.) These numbers sometimes change after I post the blog based on data that
comes in late. Most of these 20 indicators are short-term so they tend to
bounce around a lot.
LONG-TERM INDICATOR: The Long Term NTSM indicator
remained SELL: VOLUME, PRICE & VIX are bearish; SENTIMENT is neutral.
I’m not selling now. I’d prefer to hang on since I
am still expecting a relatively shallow pullback from August highs and if the
markets haven’t bottomed yet, they are not far from it.
(The important BUY in this indicator was on 21
October, 7-days after the bottom. For my NTSM overall signal, I suggested that
a short-term buying opportunity occurred on 27 September (based on improved
market internals on the retest), although without market follow-thru, I was
unwilling to call a buy; however, I did close shorts and increased stock
holdings. I issued a Buy-Signal on 4 October, 6-days before the final bottom,
based on stronger market action that confirmed the market internals signal. The
NTSM sell-signal was issued 21 December, 9 sessions before the high of this
recent bear market, based on the bearish “Friday Rundown” of indicators.)
I am still cautiously optimistic that the bottom of this
decline will be around the 200-dMA.
ETF - MOMENTUM ANALYSIS:
TODAY’S RANKING OF 15 ETFs
(Ranked Daily)
ETF ranking follows:
The top ranked ETF receives
100%. The rest are then ranked based on their momentum relative to the leading
ETF.
*For additional background on
the ETF ranking system see NTSM Page at…
http://navigatethestockmarket.blogspot.com/p/exchange-traded-funds-etf-ranking.html
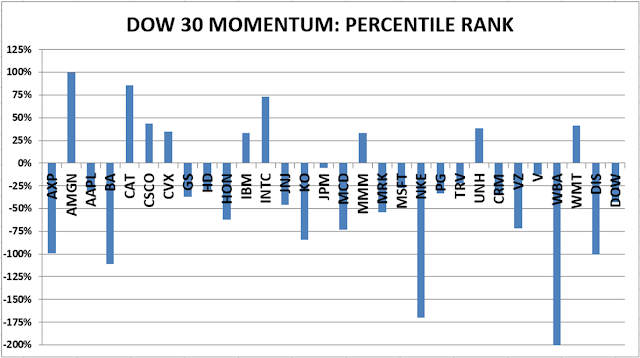
DOW STOCKS - TODAY’S MOMENTUM RANKING
OF THE DOW 30 STOCKS (Ranked Daily)
DOW 30 momentum ranking
follows:
The top ranked Stock receives
100%. The rest are then ranked based on their momentum relative to the leading Stock.
For more details, see NTSM
Page at…
https://navigatethestockmarket.blogspot.com/p/a-system-for-trading-dow-30-stocks-my_8.html
TUESDAY MARKET INTERNALS (NYSE
DATA)
My basket of Market Internals remained SELL. (My basket of Market
Internals is a decent trend-following analysis of current market action, but
should not be used alone for short term trading. They are most useful when they
diverge from the Index.)
...My current invested
position is about 75% stocks, including stock mutual funds and ETFs. I’m
usually about 50% invested in stocks. I’m “over invested” now expecting new,
all-time highs this year. That burns all the cash. I have about 25% of the portfolio in bonds.
I trade about 15-20% of the
total portfolio using the momentum-based analysis I provide here. When I see a
definitive bottom, I add a lot more stocks to the portfolio using an S&P
500 ETF as I did back in October.