“Trade what you see; not what you think.” – The Old Fool, Richard McCranie, trader extraordinaire.
“Announcing the horrifying news of an explosion at a hospital in Gaza, the Times made a series of deliberate and unconscionable choices that contorted the story, and in a way that may have contributed to lost lives. Their headline "Israeli Strike Kills Hundreds in Hospital, Palestinians Say" is abominable journalistic malpractice...Did I mention that they put the headline over a gruesome photo of a bombed-out building? A building that was somewhere else entirely, not associated with the hospital, and that was just an available and sensational image intended to amp up readers? Why not deepfake a mushroom cloud?...So to sum up, the most prominent media institution on Earth decided to take an unproven allegation from a vicious terrorist group that 11 days earlier had murdered 1,300 innocent people, taken 200 hostages, and burned alive and decapitated their victims including children, and present it in the way that most served the propaganda aims of the terrorists.” – Matt Robison. Opinion at...
The New York Times Destroys More Than Just Its Credibility | Opinion (msn.com)
“I think this incursion lower should be the final pullback before 4400 is exceeded on the upside. The S&P 500 should find buyers somewhere between 4225 and 4200, give or take... Now, I have also been asked “what if you are wrong?”
Well friends, I ask that question to myself at least daily throughout every single year. That’s my job. Of course, I am going to be wrong. As you know, another saying I often quote is that it’s okay to be wrong. It’s not okay to stay wrong. In other words, where my forecast is clearly a stinker, I better pivot and figure out the next step because in this business, the markets are usually right.” – Paul Schatz, President Heritage Capital. Commentary at...
https://investfortomorrow.com/blog/short-term-turns-down-q4-studies-still-point-higher/
-Friday the S&P 500 fell 1.3% to 4224.
-VIX rose about 1% to 21.71. (Surprising it didn’t go higher.)
-The yield on the 10-year Treasury slipped to 4.914%.
-Drop from Top: 11.9%. 25.4% max (on a closing basis). (47% retracement.)
-Trading Days since Top: 452-days.
The S&P 500 is 0.2% BELOW its 200-dMA and 3.7% BELOW its 50-dMA.
*I won’t call the correction over until the S&P 500 makes a new-high; however, evidence suggests the bottom was in the 3600 area and we called a buy on 4 October 2022.
XLK – Technology ETF (holding since the October 2022 lows).
XLY - Consumer Discretionary ETF. (Holding since the October 2022 lows - I bought more XLY Monday, 8/21.)
I took profits and then reestablished positions as follows:
SPY – I bought a large position in the S&P 500 Friday, 8/14, in my 401k (it has limited choices).
XLE – Added Tuesday, 8/22.
SSO – 2x S&P 500 ETF. Added 8/24.
CSCO – added 9/5.
I have considered selling CSCO because it is no longer a momentum leader - but I am still holding it. INTC would probably have been my choice, but it has been under pressure due to restrictions on chip sales to China.
Friday, the S&P 500 retested the 3 October low and broke slightly below it. I didn’t see any signs that suggest a bottom here when comparing today’s low to the 3 October low. That’s not good or bad – calling smaller corrections is often not possible since smaller corrections give smaller signals. At least one indicator is hinting at a bottom.
-MACD of the percentage of issues advancing on the NYSE (breadth) made a bullish crossover 12 October.
-S&P 500 spread vs. Utilities (XLU-ETF) shows the Index outpacing Utilities.
-There have been 2 Distribution Days since the last Follow-thru day.
-There have been 4 Statistically-Significant days (big moves in price-volume) in the last 15-days.
-Sentiment.
-Bollinger Band Squeeze 28 April - expired.
-Bollinger Bands – almost oversold.
-Overbought/Oversold Index (Advance/Decline Ratio).
-Issues advancing on the NYSE (Breadth) compared to the S&P 500.
-There was a New-high/New-low spread reversal on 4 October (based on std deviation of spread). The spread doesn’t have to turn positive for this indicator to be bullish, it just has to improve a lot. - Expired
-The S&P 500 is 0.2% below its 200-dMA. (Bull indicator is 12% below the 200-day.)
-The short-term, 10-day EMA, Fosback Hi-Low Logic Index.
-The long-term, 50-dEMA, Fosback Hi-Low Logic Index.
-There were Hindenburg Omen signals 11 & 12 Sept 2023 – expired. The McClellan Oscillator turned positive.
-There have been 4 up-days over the last 10 sessions.
-There have been 10 up-days over the last 20 sessions.
-There was a Zweig Breadth Thrust 31 March. That’s a rare, very-bullish sign, but the McClellan Oscillator subsequently turned negative, so this indicator has expired.
-The Calm-before-the-Storm/Panic Indicator flashed a top warning signal 15 Sept., but it may well have been a bottom signal. - Expired
-RSI.
-The Smart Money (late-day action).
-On average, the size of up-moves has been smaller than the size of down-moves over the last month, but not enough to send a signal.
-There was a 90% down-volume day 21 Sept.
-2.8% of all issues traded on the NYSE made new, 52-week highs when the S&P 500 made a new all-time-high, 3 January 2022. (There is no bullish signal for this indicator.) This indicated that the advance was too narrow and a correction was likely to be >10%. It proved correct, but is now Expired.
-47% of the 15-ETFs that I track have been up over the last 10-days. (45-55% is neutral.)
-The smoothed advancing volume on the NYSE is falling.
-The 10-dMA percentage of issues advancing on the NYSE (Breadth) is below 50%.
-The 50-dMA percentage of issues advancing on the NYSE (Breadth) is below 50%
-The 100-dMA percentage of issues advancing on the NYSE (Breadth) is below 50%
-The 50-dMA percentage of issues advancing on the NYSE (Breadth) has been below 50%, for more than 3 days in a row.
-12 October there was a Bearish Outside Reversal Day. I’ll keep this in effect for 5 days and until the McClellan Oscillator turns bullish.
-Smoothed Buying Pressure minus Selling Pressure.
-MACD of S&P 500 price made a bearish crossover 20 Oct.
-My Money Trend indicator is declining.
-Short-term new-high/new-low data.
-Long-term new-high/new-low data.
-Slope of the 40-dMA of New-highs is falling.
-The graph of the 100-day Count (the 100-day sum of up-days).
-VIX indicator.
-McClellan Oscillator.
-XLI-ETF (Cyclical Industrials) vs the S&P 500.
-The 5-10-20 Timer System is SELL.
-The 5-day EMA is below the 10-day EMA, so short-term momentum is bearish.
I haven’t sold yet, but with today’s test of recent lows and a test of the 200-dMA, we must be concerned. The Friday Summary Rundown of Indicators is also quite bearish. If we see more losses next week, I’ll be forced to take profits going back to the October 2022 lows. (They are now a lot less than they were in June.) The markets may bounce higher – I’ll wait and see what happens Monday and maybe Tuesday. About 3 weeks ago, I said that I didn’t expect the S&P 500 to fall much below 4200 – we’ll see.
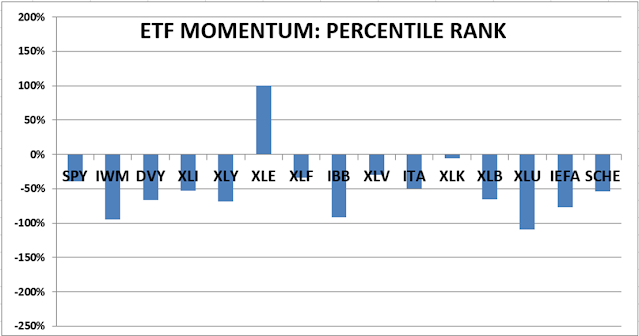
ETF - MOMENTUM ANALYSIS:
TODAY’S RANKING OF 15 ETFs (Ranked Daily)
ETF ranking follows:
*For additional background on the ETF ranking system see NTSM Page at…
http://navigatethestockmarket.blogspot.com/p/exchange-traded-funds-etf-ranking.html
DOW 30 momentum ranking follows:

For more details, see NTSM Page at…
https://navigatethestockmarket.blogspot.com/p/a-system-for-trading-dow-30-stocks-my_8.html
