THE CLIMATE CRISIS HAS A COST AND IT’S $391 MILLION PER
DAY (CNBC)
“Damage from the global climate crisis has amounted to
$391 million per day over the past two decades, a report showed. Wildfires,
heatwaves, droughts and other extreme events attributable to climate change
have incurred costs averaging over a hundred billion per year from 2000 to
2019, a recent study published in
the journal Nature Communications showed.”
https://www.cnbc.com/2023/10/24/the-climate-crisis-has-a-price-and-its-391-million-a-day.html
My cmt: Interesting report, though just 2-years ago, the
official UN Intergovernmental Panel on Climate Change reported a completely
different result! See the below article...
(GLOBAL WARMING) LET’S WORK FOR SCIENCE WITH INTEGRITY
(Forbes)
“Contrary to popular belief, even the official assessment
reports – such as those by the UN’s Intergovernmental Panel on Climate Change
and the US government’s National Climate Assessments — indicate that “significant
human-induced climate change would have negligible net economic impact on
either the world or the US economies by the end of this century”... Story
at...
https://www.forbes.com/sites/tilakdoshi/2021/04/30/lets-work-for-science-with-integrity-steve-koonins-new-book-unsettled/?sh=91c46a72f383
My cmt: Who would guess that conclusion based on the
constant barrage of global warming scare tactics by the media? Most reports
refer to weather rather than climate.
“A judge in
Colorado has refused to dismiss a lawsuit aimed at blocking former President
Donald Trump from appearing on the state's 2024 presidential ballot over claims
he engaged in "insurrection" in the aftermath of the 2020 election.
CNN reported Friday that Colorado District Judge Sarah
Wallace, who was appointed to the position by the state's Democratic
Governor Jared Polis, blocked three separate attempts by both Trump's
legal team and the Colorado GOP to dismiss the lawsuit, which was filed by the
liberal watchdog Citizens for Responsibility and Ethics in Washington.” Story
at...
Judge
Hands Trump Loss: Refuses to Dismiss Lawsuit to Block Him From Colorado Ballot,
Setting Up Unprecedented Trial (msn.com)
“While the Pentagon deploys a Thaad missile-defense
system to the Middle East to protect U.S. bases from the volley of missiles
fired by Iranian proxies, the Biden Administration has let the international
embargo on Iran’s missile program lapse... What new catastrophe would cause
President Biden to rethink his Iran policy? That’s the broader question given
that every escalation by Tehran seems to earn Supreme Leader Ayatollah Ali
Khamenei another reprieve. The forbearance—none dare call it
appeasement—makes a larger war even more likely. The U.S. better send more
missile defenses to the region.” Opinion at...
https://www.wsj.com/articles/so-much-for-the-embargo-on-irans-missiles-5a1ed31a
S&P GLOBAL COMPOSITE PMI (S&P Global)
“US companies signalled a marginal expansion in business
activity during October, following broadly stagnant output seen in August and
September. Manufacturers and service providers alike reported improved activity
levels as the downturn in demand moderated. The rise in total output was the
quickest for three months.” Report at...
https://www.pmi.spglobal.com/Public/Home/PressRelease/800861276eb949fc9646061f8eb2ffb4
MARKET REPORT / ANALYSIS
-Tuesday the S&P 500 rose 0.7% to 4248.
-VIX dropped about 7% to 18.97.
-The yield on the 10-year Treasury slipped to 4.819%.
PULLBACK DATA:
-Drop from Top: 11.4%. 25.4% max (on a closing basis).
(47% retracement.)
-Trading Days since Top: 454-days.
The S&P 500 is 0.3% ABOVE its 200-dMA and 3% BELOW
its 50-dMA.
*I won’t call the correction over until the S&P 500
makes a new-high; however, evidence suggests the major bear-market bottom was
in the 3600 area and we called a buy on 4 October 2022.
MY TRADING POSITIONS:
XLK – Technology ETF (holding since the October 2022
lows).
XLY - Consumer Discretionary ETF. (Holding since the
October 2022 lows - I bought more XLY Monday, 8/21.)
I took profits and then reestablished positions as
follows:
SPY – I bought a large position in the S&P 500
Friday, 8/14, in my 401k (it has limited choices).
XLE – Added Tuesday, 8/22.
SSO – 2x S&P 500 ETF. Added 8/24.
CSCO – added 9/5.
I have considered selling CSCO because it is no longer
a momentum leader - but I am still holding it. INTC would probably have been my
choice, but it has been under pressure due to restrictions on chip sales to
China and competition from other chip makers.
TODAY’S COMMENT:
Not much change in indicators today. The S&P 500 broke back above its 200-dMA
and that is a good sign, and for the time being, it’s all that matters.
The daily spread of 20 Indicators (Bulls minus Bears) improved
from -12 to -11 (a positive number is bullish; negatives are bearish); the
10-day smoothed sum that smooths the daily fluctuations declined from -8
to -26. (The trend direction is more important than the actual number for the
10-day value.) These numbers sometimes change after I post the blog based on
data that comes in late. Most of these 20 indicators are short-term so they
tend to bounce around a lot.
LONG-TERM INDICATOR: The Long Term NTSM indicator remained
SELL: VOLUME & VIX is bearish; PRICE & SENTIMENT are neutral. I may be
following this indicator soon; but not yet. I am still watching price action
around the 200-dMA.
(The important BUY in this indicator was on 21 October,
7-days after the bottom. For my NTSM overall signal, I suggested that a
short-term buying opportunity occurred on 27 September (based on improved
market internals on the retest), although without market follow-thru, I was
unwilling to call a buy; however, I did close shorts and increased stock
holdings. I issued a Buy-Signal on 4 October, 6-days before the final bottom,
based on stronger market action that confirmed the market internals signal. The
NTSM sell-signal was issued 21 December, 9 sessions before the high of this
recent bear market, based on the bearish “Friday Rundown” of indicators.)
BOTTOM LINE HASN’T CHANGED:
I haven’t sold yet, but with recent tests of lows and a
test of the 200-dMA, we must be concerned. I am still watching price action around the
200-dMA. About 3 weeks ago, I said that I didn’t expect the S&P 500 to fall
much below 4200 – we’ll see.
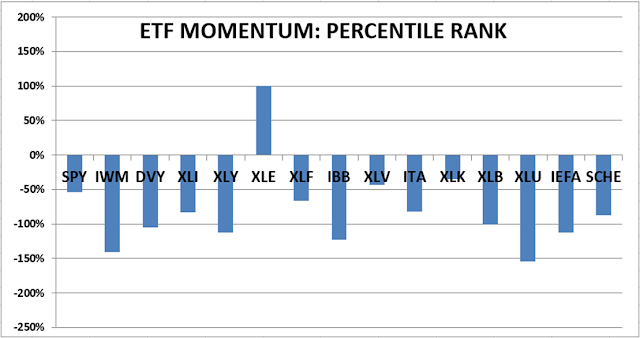
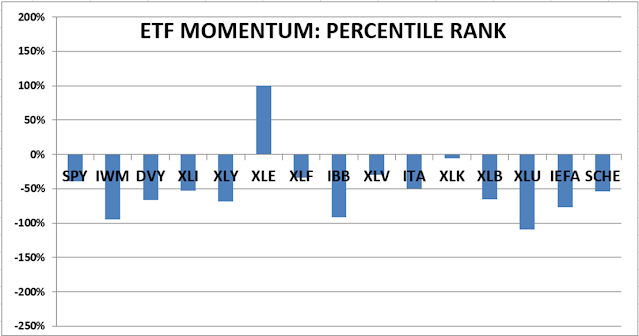
ETF - MOMENTUM ANALYSIS:
TODAY’S RANKING OF 15 ETFs (Ranked Daily)
ETF ranking follows:
The top ranked ETF receives
100%. The rest are then ranked based on their momentum relative to the leading
ETF.
*For additional background on
the ETF ranking system see NTSM Page at…
http://navigatethestockmarket.blogspot.com/p/exchange-traded-funds-etf-ranking.html
DOW STOCKS - TODAY’S MOMENTUM RANKING
OF THE DOW 30 STOCKS (Ranked Daily)
DOW 30 momentum ranking
follows:
The top ranked Stock receives
100%. The rest are then ranked based on their momentum relative to the leading Stock.
For more details, see NTSM
Page at…
https://navigatethestockmarket.blogspot.com/p/a-system-for-trading-dow-30-stocks-my_8.html
TUESDAY MARKET INTERNALS (NYSE
DATA)
My basket of Market Internals remained SELL. (My basket of Market
Internals is a decent trend-following analysis of current market action, but
should not be used alone for short term trading. They are most useful when they
diverge from the Index.)
...My current invested
position is about 75% stocks, including stock mutual funds and ETFs. I’m
usually about 50% invested in stocks. I’m “over invested” now expecting new,
all-time highs this year. That burns all the cash. I have about 25% of the portfolio in bonds.
I trade about 15-20% of the
total portfolio using the momentum-based analysis I provide here. When I see a
definitive bottom, I add a lot more stocks to the portfolio using an S&P
500 ETF as I did back in October.
“Trade what you see; not what you think.” – The Old Fool,
Richard McCranie, trader extraordinaire.
“The S&P 500 has some more downside this week to
breach the October lows and bottom somewhere around 4200. 4200 is not some
magical number. Stocks could bottom just above or a few percent below, but that
scenario relies on the market finding buying interest this coming week.” Paul
Schatz, President Heritage Capital. Commentary at...
https://investfortomorrow.com/blog/ugly-friday-for-the-bulls-but-it-is-monday-scenario-building-for-q4/
MARKET REPORT / ANALYSIS
-Monday the S&P 500 fell 0.2% to 4217.
-VIX bucked the trend and dropped about 6% to 20.37.
-The yield on the 10-year Treasury slipped to 4.848%.
PULLBACK DATA:
-Drop from Top: 12.1%. 25.4% max (on a closing basis).
(47% retracement.)
-Trading Days since Top: 453-days.
The S&P 500 is 0.4% BELOW its 200-dMA and 3.8%
BELOW its 50-dMA.
*I won’t call the correction over until the S&P 500
makes a new-high; however, evidence suggests the bottom was in the 3600 area
and we called a buy on 4 October 2022.
MY TRADING POSITIONS:
XLK – Technology ETF (holding since the October 2022
lows).
XLY - Consumer Discretionary ETF. (Holding since the
October 2022 lows - I bought more XLY Monday, 8/21.)
I took profits and then reestablished positions as
follows:
SPY – I bought a large position in the S&P 500
Friday, 8/14, in my 401k (it has limited choices).
XLE – Added Tuesday, 8/22.
SSO – 2x S&P 500 ETF. Added 8/24.
CSCO – added 9/5.
I have considered selling CSCO because it is no longer
a momentum leader - but I am still holding it. INTC would probably have been my
choice, but it has been under pressure due to restrictions on chip sales to
China.
TODAY’S COMMENT:
I am watching the numbers as the markets fall to see if
we can I identify a bottom of this dip. So far, no bottom. Volume was lower
today, but other internals were worse.
I updated the Summary of Indicators and it was worse, too:
Monday there were 2 Bull and 20 Bear indicators. (It was 2 Bull and 18 Bear
Friday.)
Cyclical Industrials (XLI) are under-performing the
S&P 500 Index and that is a bearish sign. I thought I’d take a look at Consumer
Staples (XLP) vs. the Index. If
investors are concerned, then XLP should be outpacing the S&P 500. Over the last 5 days, XLP has outperformed
the Index, a bearish sign. On the bullish side, the Index is outpacing
Utilities (XLU); But, in the end, price matters most and the Index has broken
its 200-dMA so I am looking at Trend Break rules.
Trend breaks are declared on several different rules, depending
on who is doing the talking: (1) when price exceeds an established trendline 2
days in a row. (2) Others say a break must be 3% above or below the trend line. If we apply that to the 200-dMA, we may
accept a drop below 4108 as a point to sell. (3) Lance Roberts says a break
below the 200-dMA must stay there for a trading week, 5-days. Pick your poison.
The markets may be close to a bottom, but how much more
can I take? Not much, but I am going to be patient for a bit longer.
The daily spread of 20 Indicators (Bulls minus Bears) declined
from -11 to -12 (a positive number is bullish; negatives are bearish); the
10-day smoothed sum that smooths the daily fluctuations declined from +7
to -8. (The trend direction is more important than the actual number for the
10-day value.) These numbers sometimes change after I post the blog based on
data that comes in late. Most of these 20 indicators are short-term so they
tend to bounce around a lot.
LONG-TERM INDICATOR: The Long Term NTSM indicator switched
to SELL: VOLUME & VIX is bearish; PRICE & SENTIMENT are neutral. I may
be following this indicator soon; but not yet.
(The important BUY in this indicator was on 21 October,
7-days after the bottom. For my NTSM overall signal, I suggested that a
short-term buying opportunity occurred on 27 September (based on improved
market internals on the retest), although without market follow-thru, I was
unwilling to call a buy; however, I did close shorts and increased stock
holdings. I issued a Buy-Signal on 4 October, 6-days before the final bottom,
based on stronger market action that confirmed the market internals signal. The
NTSM sell-signal was issued 21 December, 9 sessions before the high of this
recent bear market, based on the bearish “Friday Rundown” of indicators.)
BOTTOM LINE HASN’T CHANGED:
I haven’t sold yet, but with today’s test of recent lows
and a test of the 200-dMA, we must be concerned. The Friday Summary Rundown of
Indicators is also quite bearish. If we
see more losses this week, I’ll be forced to take profits going back to the
October 2022 lows. (They are now a lot less than they were in June.) The
markets may bounce higher – I’ll wait and see what happens Monday and maybe
Tuesday. About 3 weeks ago, I said that I didn’t expect the S&P 500 to fall
much below 4200 – we’ll see.
ETF - MOMENTUM ANALYSIS:
TODAY’S RANKING OF 15 ETFs (Ranked Daily)
ETF ranking follows:
The top ranked ETF receives
100%. The rest are then ranked based on their momentum relative to the leading
ETF.
*For additional background on
the ETF ranking system see NTSM Page at…
http://navigatethestockmarket.blogspot.com/p/exchange-traded-funds-etf-ranking.html
DOW STOCKS - TODAY’S MOMENTUM RANKING
OF THE DOW 30 STOCKS (Ranked Daily)
DOW 30 momentum ranking
follows:
The top ranked Stock receives
100%. The rest are then ranked based on their momentum relative to the leading Stock.
For more details, see NTSM
Page at…
https://navigatethestockmarket.blogspot.com/p/a-system-for-trading-dow-30-stocks-my_8.html
MONDAY MARKET INTERNALS (NYSE
DATA)
My basket of Market Internals remained SELL. (My basket of Market
Internals is a decent trend-following analysis of current market action, but
should not be used alone for short term trading. They are most useful when they
diverge from the Index.)
...My current invested
position is about 75% stocks, including stock mutual funds and ETFs. I’m
usually about 50% invested in stocks. I’m “over invested” now expecting new,
all-time highs this year. That burns all the cash. I have about 25% of the portfolio in bonds.
I trade about 15-20% of the
total portfolio using the momentum-based analysis I provide here. When I see a
definitive bottom, I add a lot more stocks to the portfolio using an S&P
500 ETF as I did back in October.
“Trade what you see; not what you think.” – The Old Fool,
Richard McCranie, trader extraordinaire.
THE NEW YORK TIMES DESTROYS MORE THAN JUST IT CREDIBILITY
(Newsweek/msn)
“Announcing the horrifying news of an explosion at a
hospital in Gaza, the Times made a series of deliberate and
unconscionable choices that contorted the story, and in a way that may have
contributed to lost lives. Their headline "Israeli Strike Kills Hundreds in Hospital,
Palestinians Say" is abominable journalistic malpractice...Did I mention
that they put the headline over a gruesome photo of
a bombed-out building? A building that was somewhere else entirely, not
associated with the hospital, and that was just an available and sensational
image intended to amp up readers? Why not deepfake a mushroom cloud?...So to
sum up, the most prominent media institution on Earth decided to take an
unproven allegation from a vicious terrorist group that 11 days earlier had
murdered 1,300 innocent people, taken 200 hostages, and burned alive and
decapitated their victims including children, and present it in the way that
most served the propaganda aims of the terrorists.” – Matt Robison. Opinion
at...
The
New York Times Destroys More Than Just Its Credibility | Opinion (msn.com)
SHORT TERM LOWER – Q4, HIGHER (Heritage Capital)
“I think this incursion lower should be the final
pullback before 4400 is exceeded on the upside. The S&P 500 should find
buyers somewhere between 4225 and 4200, give or take... Now, I have also been
asked “what if you are wrong?”
Well friends, I ask that question to myself at least
daily throughout every single year. That’s my job. Of course, I am going to be
wrong. As you know, another saying I often quote is that it’s okay to be wrong.
It’s not okay to stay wrong. In other words, where my forecast is clearly a
stinker, I better pivot and figure out the next step because in this business,
the markets are usually right.” – Paul Schatz, President Heritage Capital. Commentary
at...
https://investfortomorrow.com/blog/short-term-turns-down-q4-studies-still-point-higher/
MARKET REPORT / ANALYSIS
-Friday the S&P 500 fell 1.3% to 4224.
-VIX rose about 1% to 21.71. (Surprising it didn’t go
higher.)
-The yield on the 10-year Treasury slipped to 4.914%.
PULLBACK DATA:
-Drop from Top: 11.9%. 25.4% max (on a closing basis).
(47% retracement.)
-Trading Days since Top: 452-days.
The S&P 500 is 0.2% BELOW its 200-dMA and 3.7%
BELOW its 50-dMA.
*I won’t call the correction over until the S&P 500
makes a new-high; however, evidence suggests the bottom was in the 3600 area and
we called a buy on 4 October 2022.
MY TRADING POSITIONS:
XLK – Technology ETF (holding since the October 2022
lows).
XLY - Consumer Discretionary ETF. (Holding since the
October 2022 lows - I bought more XLY Monday, 8/21.)
I took profits and then reestablished positions as
follows:
SPY – I bought a large position in the S&P 500
Friday, 8/14, in my 401k (it has limited choices).
XLE – Added Tuesday, 8/22.
SSO – 2x S&P 500 ETF. Added 8/24.
CSCO – added 9/5.
I have considered selling CSCO because it is no longer
a momentum leader - but I am still holding it. INTC would probably have been my
choice, but it has been under pressure due to restrictions on chip sales to
China.
TODAY’S COMMENT:
Friday, the S&P 500 retested the 3 October low and
broke slightly below it. I didn’t see any signs that suggest a bottom here when
comparing today’s low to the 3 October low. That’s not good or bad – calling smaller
corrections is often not possible since smaller corrections give smaller signals.
At least one indicator is hinting at a
bottom.
Only 7% of the 15 ETFs I track are above their 120-dMA’s
(120-dMA = 120 day moving average). Going back to the October low of 2022, each
minor pullback has ended at or above that level. That’s hinting we may be near a bottom, but when
the S&P 500 made its bear market bottom (25% decline) back in October 2022, none of those ETFs were above
their 120-dMAs so markets could still fall farther.
I said yesterday that the S&P 500 was at its lower
trend line. That was true, but it really depends on the scales used to draw the
charts. It could be argued that the S&P 500 closed on its lower trendline
today. But to really confuse the issue, if the chart is drawn going back to the
March 2020 lows, the lower trend-line would be around 4150 so this type of
chart analysis is a bit of a crap shoot.
One point that isn’t a crap shoot – the S&P 500 broke
slightly below its 200-dMA Friday. Markets
can overshoot targets so I don’t think breaking a little below the 200-day is a
disaster, but we don’t want to see it fall farther.
Friday was another statistically significant down-day.
That just means that the price-volume move exceeded my statistical parameters.
Statistics show that a statistically-significant, down-day is followed by an
up-day about 60% of the time. As I said previously,
this may also be signaling a flush-out of remaining weak hands. If that is
true, it could signal a short-term bottom – I’ve been wrong so far, why not
stick with it?
We look at a summary of indicators on Friday: The weekly
rundown of indicators moved sharply to the Bear side this week, now 18-bear and
2-bull. (These indicators tend to be both long-term and short-term, so they are
different than the 20 that I report on daily.)
BULL SIGNS
-MACD of the percentage of issues advancing on the NYSE
(breadth) made a bullish crossover 12 October.
-S&P 500 spread vs. Utilities (XLU-ETF) shows the
Index outpacing Utilities.
NEUTRAL
-There have been 2 Distribution Days since the last
Follow-thru day.
-There have been 4 Statistically-Significant days (big
moves in price-volume) in the last 15-days.
-Sentiment.
-Bollinger Band Squeeze 28 April - expired.
-Bollinger Bands – almost oversold.
-Overbought/Oversold Index (Advance/Decline Ratio).
-Issues advancing on the NYSE (Breadth) compared to the
S&P 500.
-There was a New-high/New-low spread reversal on 4 October
(based on std deviation of spread). The spread doesn’t have to turn positive
for this indicator to be bullish, it just has to improve a lot. - Expired
-The S&P 500 is 0.2% below its 200-dMA. (Bull
indicator is 12% below the 200-day.)
-The short-term, 10-day EMA, Fosback Hi-Low Logic Index.
-The long-term, 50-dEMA, Fosback Hi-Low Logic Index.
-There were Hindenburg Omen signals 11 & 12 Sept 2023
– expired. The McClellan Oscillator turned positive.
-There have been 4 up-days over the last 10 sessions.
-There have been 10 up-days over the last 20 sessions.
-There was a Zweig Breadth Thrust 31 March. That’s a
rare, very-bullish sign, but the McClellan Oscillator subsequently turned
negative, so this indicator has expired.
-The Calm-before-the-Storm/Panic Indicator flashed a top
warning signal 15 Sept., but it may well have been a bottom signal. - Expired
-RSI.
-The Smart Money (late-day action).
-On average, the size of up-moves has been smaller than
the size of down-moves over the last month, but not enough to send a signal.
-There was a 90% down-volume day 21 Sept.
-2.8% of all issues traded on the NYSE made new, 52-week
highs when the S&P 500 made a new all-time-high, 3 January 2022. (There is
no bullish signal for this indicator.) This indicated that the advance was too
narrow and a correction was likely to be >10%. It proved correct, but is now
Expired.
-47% of the 15-ETFs that I track have been up over the
last 10-days. (45-55% is neutral.)
BEAR SIGNS
-The smoothed advancing volume on the NYSE is falling.
-The 10-dMA percentage of issues advancing on
the NYSE (Breadth) is below 50%.
-The 50-dMA percentage of issues advancing on the NYSE
(Breadth) is below 50%
-The 100-dMA percentage of issues advancing on
the NYSE (Breadth) is below 50%
-The 50-dMA percentage of issues advancing on the NYSE
(Breadth) has been below 50%, for more than 3 days in a row.
-12 October there was a Bearish Outside Reversal Day.
I’ll keep this in effect for 5 days and until the McClellan Oscillator turns
bullish.
-Smoothed Buying Pressure minus Selling Pressure.
-MACD of S&P 500 price made a bearish crossover 20
Oct.
-My Money Trend indicator is declining.
-Short-term new-high/new-low data.
-Long-term new-high/new-low data.
-Slope of the 40-dMA of New-highs is falling.
-The graph of the 100-day Count (the 100-day sum of
up-days).
-VIX indicator.
-McClellan Oscillator.
-XLI-ETF (Cyclical Industrials) vs the S&P 500.
-The 5-10-20 Timer System is SELL.
-The 5-day EMA is below the 10-day EMA, so short-term
momentum is bearish.
On Monday’s update of the Friday summary of indicators (20
December 2021), 9 days before the top of the current 25% correction, there were
21 bear-signs and zero bull-signs. Now there are 18 bear-signs and 2-Bull.
Last week, there were 10 bear-sign and 9 bull-signs.
The daily spread of 20 Indicators (Bulls minus Bears) declined
from -7 to -11 (a positive number is bullish; negatives are bearish); the
10-day smoothed sum that smooths the daily fluctuations declined from +15
to +7. (The trend direction is more important than the actual number for the
10-day value.) These numbers sometimes change after I post the blog based on
data that comes in late. Most of these 20 indicators are short-term so they
tend to bounce around a lot.
LONG-TERM INDICATOR: The Long Term NTSM indicator was
HOLD: VIX is bearish; VOLUME, PRICE & SENTIMENT are neutral.
(The important BUY in this indicator was on 21 October,
7-days after the bottom. For my NTSM overall signal, I suggested that a short-term
buying opportunity occurred on 27 September (based on improved market internals
on the retest), although without market follow-thru, I was unwilling to call a
buy; however, I did close shorts and increased stock holdings. I issued a
Buy-Signal on 4 October, 6-days before the final bottom, based on stronger
market action that confirmed the market internals signal. The NTSM sell-signal
was issued 21 December, 9 sessions before the high of this recent bear market,
based on the bearish “Friday Rundown” of indicators.)
BOTTOM LINE:
I haven’t sold yet, but with today’s test of recent lows
and a test of the 200-dMA, we must be concerned. The Friday Summary Rundown of
Indicators is also quite bearish. If we
see more losses next week, I’ll be forced to take profits going back to the
October 2022 lows. (They are now a lot less than they were in June.) The
markets may bounce higher – I’ll wait and see what happens Monday and maybe Tuesday.
About 3 weeks ago, I said that I didn’t expect the S&P 500 to fall much
below 4200 – we’ll see.
xxxxxxxxxxxxxxxxxxxxxxxxxxxxxx
ETF - MOMENTUM ANALYSIS:
TODAY’S RANKING OF 15 ETFs (Ranked Daily)
ETF ranking follows:
The top ranked ETF receives
100%. The rest are then ranked based on their momentum relative to the leading
ETF.
*For additional background on
the ETF ranking system see NTSM Page at…
http://navigatethestockmarket.blogspot.com/p/exchange-traded-funds-etf-ranking.html
DOW STOCKS - TODAY’S MOMENTUM RANKING
OF THE DOW 30 STOCKS (Ranked Daily)
DOW 30 momentum ranking
follows:
The top ranked Stock receives
100%. The rest are then ranked based on their momentum relative to the leading Stock.
For more details, see NTSM
Page at…
https://navigatethestockmarket.blogspot.com/p/a-system-for-trading-dow-30-stocks-my_8.html
FRIDAY MARKET INTERNALS (NYSE
DATA)
My basket of Market Internals remained SELL. (My basket of Market
Internals is a decent trend-following analysis of current market action, but
should not be used alone for short term trading. They are most useful when they
diverge from the Index.)
...My current invested
position is about 75% stocks, including stock mutual funds and ETFs. I’m
usually about 50% invested in stocks. I’m “over invested” now expecting new,
all-time highs this year. That burns all the cash. I have about 25% of the portfolio in bonds.
I trade about 15-20% of the
total portfolio using the momentum-based analysis I provide here. When I see a
definitive bottom, I add a lot more stocks to the portfolio using an S&P
500 ETF as I did back in October.
“Trade what you see; not what you think.” – The Old Fool,
Richard McCranie, trader extraordinaire.
US EXPERTS SAY EVIDENCE SUGGESTS PALESTINIAN ROCKET HIT
GAZA HOSPITAL (WSJ)
“We have none of the indicators of an airstrike—none,”
said Michael Knights of the Washington Institute for Near East Policy, an
expert on military and security issues. The U.S. has collected “high
confidence” signals intelligence indicating that the blast at the hospital in
Gaza was caused by the militant group Palestinian Islamic Jihad, U.S. officials
said, buttressing Israel’s contention that it wasn’t responsible for the
blast... “At the moment, the preponderance of evidence does point to it being a
Hamas or PIJ rocket hitting the area,” said Blake Spendley, an open-source
intelligence analyst. He said videos and photos he has reviewed showing the
scene were more consistent with a death toll of about 50 rather than the 500
initially claimed by Hamas.” Story at...
https://www.wsj.com/world/middle-east/israel-tries-to-back-up-claims-it-didnt-attack-gaza-hospital-a8cc3405
My cmt: The article went on to describe a very “shallow
crater” in the parking lot of the hospital and only “limited shock-wave damage”
to the building. Three hospital workers were injured. The disappointing fact is
that the world’s news media reported Hamas’ version that Israel bombed the Hospital
leading to world wide riots. Casualties occurred because, apparently, there
were people sleeping outside, around the hospital.
“Drone attacks targeting American military personnel at
air bases in Iraq were thwarted on Wednesday...According to the AP, the Iran-backed
Islamic Resistance in Iraq went on to take credit for both attacks and warned
of more "operations" against the so-called "American
occupation" in a statement.” Story at...
US
Military Intercepts Foreign Drones Targeting American Troops: Report (msn.com)
My cmt: Was there a response or was Biden sleeping again?
My Army son-in-law left the US on his way to one of those airbases yesterday.
"Have you ever wondered why so many people fall for
conspiracy theories? [asked David Hundsness, who holds a BA in Psychology from
the University of California] ...In spite of all the evidence available, it's
just weird that so many people choose to go with 'alternative' facts about
COVID, vaccines, the 2020 election, the moon landing, and so on. And when you
think about it, it's even weirder that they make this choice knowing that
others are going to mock them and argue with them and call them stupid’ ...
there are four reasons why people believe conspiracies: Lack of information,
anxiety, following an in-group and ego.”
Psychology
educator breaks down four reasons why some people fall for conspiracy theories
(msn.com)
“If we assume that the October lows in the stock market
were significant, then each passing day without price coming back down is a
small drop in risk.” – Paul Schatz, President Heritage Capital.
JOBLESS CLAIMS (CNBC)
“Initial filings for unemployment benefits dipped last
week, indicating that the U.S. labor market remains tight and a potential
factor in persistent inflation. Weekly jobless claims totaled a seasonally
adjusted 198,000 for the period ended Oct. 14...” Story at...
https://www.cnbc.com/2023/10/19/us-weekly-jobless-claims-total-198000-less-than-expected.html
EXISTING HOME SALES (CNN)
“Home sales dropped in September to the lowest level
since the foreclosure crisis as surging interest rates and climbing home prices made buying a home unattainable for
a growing share of would-be buyers. Historically low inventory of homes for
sale continued to push prices up...” Story at...
https://www.cnn.com/2023/10/19/homes/existing-home-sales-september/index.html
PHILADELPHIA FED INDEX (Rtt News)
“Philadelphia-area manufacturing activity contracted at a
slower rate in the month of October, according to a report released by the
Federal Reserve Bank of Philadelphia on Thursday. The Philly Fed said its
diffusion index for current general activity climbed to a negative 9.0 in
October from a negative 13.5 in September, although a negative reading still
indicates contraction.” Story at...
https://www.rttnews.com/3397688/philly-fed-index-rises-but-remains-in-negative-territory-in-october.aspx
LEADING ECONOMIC INDICATORS Conference Board)
“The LEI for the US fell again in September, marking a
year and a half of consecutive monthly declines since April 2022," said Justyna
Zabinska-La Monica, Senior Manager, Business Cycle Indicators, at The
Conference Board. "In September, negative or flat contributions from
nine of the index's ten components more than offset fewer initial claims for
unemployment insurance. Although the six-month growth rate in the LEI is
somewhat less negative, and the recession signal did not sound, it still signals
risk of economic weakness ahead. So far, the US economy has shown considerable
resilience despite pressures from rising interest rates and high inflation.
Nonetheless, The Conference Board forecasts that this trend will not be
sustained for much longer, and a shallow recession is likely in the first half
of 2024." Press reease at...
https://www.prnewswire.com/news-releases/the-conference-board-leading-economic-index-lei-for-the-us-continues-to-fall-in-september-301962128.html
MARKET REPORT / ANALYSIS
-Thursday the S&P 500 fell 0.9% to 4278.
-VIX rose about 11% to 21.40.
-The yield on the 10-year Treasury rose to 4.992%.
PULLBACK DATA:
-Drop from Top: 10.8%. 25.4% max (on a closing basis).
-Trading Days since Top: 451-days.
The S&P 500 is 1.1% ABOVE its 200-dMA and 2.6%
BELOW its 50-dMA.
*I won’t call the correction over until the S&P 500
makes a new-high; however, evidence suggests the bottom was in the 3600 area
and we called a buy on 4 October 2022.
MY TRADING POSITIONS:
XLK – Technology ETF (holding since the October 2022
lows).
XLY - Consumer Discretionary ETF. (Holding since the
October 2022 lows - I bought more XLY Monday, 8/21.)
I took profits and then reestablished positions as
follows:
SPY – I bought a large position in the S&P 500
Friday, 8/14, in my 401k (it has limited choices).
XLE – Added Tuesday, 8/22.
SSO – 2x S&P 500 ETF. Added 8/24.
CSCO – added 9/5.
I have considered selling CSCO because it is no longer
a momentum leader - but I am still holding it. INTC would probably have been my
choice, but it has been under pressure due to restrictions on chip sales to
China.
TODAY’S COMMENT:
The markets were happy until Fed Powell gave his talk at
the Economic Club of New York Luncheon. If you want to hear his speech, this
should do it:
https://www.federalreserve.gov/newsevents/speech/powell20231019a.htm
During his talk, 10-year bond yields rose to only a
whisker below the “magic” 5% level and around 5PM it rose slightly above 5%. I don’t know that there is anything special
about the 5% level, but the market seems to think that there is, and that is
all that counts.
Breadth declined today. The 10, 50 & 100-dMA’s of
stocks advancing on the NYSE all dipped below 50%, indicating that for those
time frames, most stocks have been down.
Today, the S&P 500 is at its lower trend line drawn
back to the October 2022 lows. That’s a level of support so we’ll have to watch
tomorrow.
Thursday was another statistically significant down-day.
That just means that the price-volume move exceeded my statistical parameters.
Statistics show that a statistically-significant, down-day is followed by an
up-day about 60% of the time. As I said
yesterday, this may also be signaling a flush-out of remaining weak hands. If
that is true, it could signal a short-term bottom.
Volume was up today, about the same as we saw at the
prior lows on 3 & 4 October, so we can’t feel as good about today as we did
Wednesday. The good news: the Buying Pressure minus Selling Pressure indicator is
still bullishly trending up; my Money Trend indicator is also trending up and
it uses a similar type analysis.
I’ll chalk today’s down-day to Fed Powell’s suggestion
that interest rates might have to go higher.
I still think the markets are near a turn higher. Yeah, I
know, “Trade what you see, not what you think.” For now, I see enough bullish indicators
to stay fully invested, but that may not last. We’ll get a better view of the markets
when I check and publish Friday’s Summary Rundown of Indicators.
As a fun (?) non-scientific indicator, all the CNBC regular
pundits on the Fast Money show were bearish.
That’s often a bullish sign.
The daily spread of 20 Indicators (Bulls minus Bears) declined
from +2 to -7 (a positive number is bullish; negatives are bearish); the 10-day
smoothed sum that smooths the daily fluctuations declined from +18 to +15.
(The trend direction is more important than the actual number for the 10-day
value.) These numbers sometimes change after I post the blog based on data that
comes in late. Most of these 20 indicators are short-term so they tend to bounce
around a lot.
LONG-TERM INDICATOR: The Long Term NTSM indicator was
HOLD: VIX is bearish; VOLUME, PRICE & SENTIMENT are neutral.
(The important BUY in this indicator was on 21
October, 7-days after the bottom. For my NTSM overall signal, I suggested that
a short-term buying opportunity occurred on 27 September (based on improved
market internals on the retest), although without market follow-thru, I was
unwilling to call a buy; however, I did close shorts and increased stock
holdings. I issued a Buy-Signal on 4 October, 6-days before the final bottom,
based on stronger market action that confirmed the market internals signal. The
NTSM sell-signal was issued 21 December, 9 sessions before the high of this
recent bear market, based on the bearish “Friday Rundown” of indicators.)
It looks like we have already seen the bottom in this ongoing weakness.
There are indications that the bottom was Wednesday, 3 October 2023, at 4230 on the S&P 500
and I think we got confirmation on 9 & 10 October. It appears we have
seen the short-term low in October of 2023, but Mr. Market is keeping us worried.
ETF - MOMENTUM ANALYSIS:
TODAY’S RANKING OF 15 ETFs
(Ranked Daily)
ETF ranking follows:
The top ranked ETF receives
100%. The rest are then ranked based on their momentum relative to the leading
ETF.
*For additional background on
the ETF ranking system see NTSM Page at…
http://navigatethestockmarket.blogspot.com/p/exchange-traded-funds-etf-ranking.html
DOW STOCKS - TODAY’S MOMENTUM RANKING
OF THE DOW 30 STOCKS (Ranked Daily)
DOW 30 momentum ranking
follows:
The top ranked Stock receives
100%. The rest are then ranked based on their momentum relative to the leading Stock.
For more details, see NTSM
Page at…
https://navigatethestockmarket.blogspot.com/p/a-system-for-trading-dow-30-stocks-my_8.html
THURSDAY MARKET INTERNALS
(NYSE DATA)
My basket of Market Internals declined to SELL. (My basket of Market
Internals is a decent trend-following analysis of current market action, but
should not be used alone for short term trading. They are most useful when they
diverge from the Index.)
...My current invested
position is about 75% stocks, including stock mutual funds and ETFs. I’m
usually about 50% invested in stocks. I’m “over invested” now expecting new,
all-time highs this year. That burns all the cash. I have about 25% of the portfolio in bonds.
I trade about 15-20% of the
total portfolio using the momentum-based analysis I provide here. When I see a
definitive bottom, I add a lot more stocks to the portfolio using an S&P
500 ETF as I did back in October.
“Trade what you see; not what you think.” – The Old Fool,
Richard McCranie, trader extraordinaire.
US weather warning: Tropical storm Tammy to smash Florida
and Eastern US states (GB News)
US
weather warning: Tropical storm Tammy to smash Florida and Eastern US states (msn.com)
Microsoft complains about phony news on Facebook and
Twitter, but they don’t police their own site to prevent click bait garbage
like the article above. What crap! Here are the model forecasts. There is near zero threat to Florida or the
East Coast.

“There can have been few more weirdly humorous spectacles
this week than the protests of gay-rights groups expressing solidarity with
Hamas, under whose jurisdiction homosexual activity can get you executed. Israel is the only country in the Middle East that
tolerates sexual nonconformity.” – Gereard Baker, Editor at Large, WSJ.
“According to another report by CNN,
the Supreme Court shut down attempts to disqualify the former President from
participating in the upcoming 2024 Elections.” From...
Supreme
Court Declines Donald Trump's Disqualification from the 2024 Presidential
Election (msn.com)
My cmt: As noted previously, the Court didn’t hear the
case; they just sided with an earlier ruling that the man who brought the action
didn’t have “standing.” This issue is likely to resurface and eventually will probably
be decided by the Supreme Court.
FORD FACES $1B FINE UNDER NHTSA (msn.com)
“Ford Motor Co. would face for the first time $1 billion
in fines from 2027 to 2032 under stricter proposed average fuel economy rules
that target SUV and truck manufacturers, according to a filing the
Dearborn-based manufacturer has made with the federal government. The US
National Highway Traffic Safety Administration has proposed a fleetwide average
mandate, known as the Corporate Average Fuel Economy standard, of about 58
miles (93 kilometers) per gallon by 2032. The more stringent rules are part of
a Biden administration effort to cut emissions and accelerate the country’s
transition to electric vehicles.” Story at...
Ford
Says It Faces $1 Billion in Fines Under Stricter Fuel Rules (msn.com)
My cmt: The comment period for this proposed rule closed
on 16 October. It forces electric vehicles on an unsuspecting public - too much,
too soon.
FED BEIGE BOOK (FED)
“Most Districts indicated little to no change in economic activity
since the September report. Consumer spending was mixed, especially among
general retailers and auto dealers, due to differences in prices and product
offerings. Tourism activity continued to improve, although some Districts reported
slight slowing in consumer travel, and a few Districts noted an uptick in
business travel. Banking contacts reported slight to modest declines in loan
demand. Consumer credit quality was generally described as stable or healthy,
with delinquency rates still historically low but slightly increasing. Real
estate conditions were little changed and the inventory of homes for sale
remained low. Manufacturing activity was mixed, although contacts across
multiple Districts noted an improving outlook for the sector. The near-term
outlook for the economy was generally described as stable or having slightly
weaker growth. Expectations of firms for which the holiday shopping season is
an important driver of sales were mixed.” Report at...
https://www.federalreserve.gov/monetarypolicy/beigebook202310.htm
HOUSING STARTS (Fox Business)
“New U.S. home construction rebounded in September after
a steep drop the previous month, even as the housing market continues to
confront high mortgage rates. Housing
starts rose 7% last month to an annual rate of 1.35 million
units...” Story at...
https://www.foxbusiness.com/economy/housing-starts-rebound-september-spike-mortgage-rates
EIA CRUDE INVENTORIES (EIA)
“U.S. commercial crude oil inventories (excluding those
in the Strategic Petroleum Reserve) decreased by 4.5 million barrels from the
previous week. At 419.7 million barrels, U.S. crude oil inventories are about
5% below the five year average for this time of year.” Story at...
https://ir.eia.gov/wpsr/wpsrsummary.pdf
MARKET REPORT / ANALYSIS
-Wednesday the S&P 500 fell 1.3% to 4315.
-VIX rose about 9% to 19.46.
-The yield on the 10-year Treasury rose to 4.908%.
PULLBACK DATA:
-Drop from Top: 10%. 25.4% max (on a closing basis).
-Trading Days since Top: 450-days.
The S&P 500 is 2% ABOVE its 200-dMA and 1.8% BELOW
its 50-dMA.
*I won’t call the correction over until the S&P 500
makes a new-high; however, evidence suggests the bottom was in the 3600 area
and we called a buy on 4 October 2022.
MY TRADING POSITIONS:
XLK – Technology ETF (holding since the October 2022
lows).
XLY - Consumer Discretionary ETF. (Holding since the
October 2022 lows - I bought more XLY Monday, 8/21.)
I took profits and then reestablished positions as
follows:
SPY – I bought a large position in the S&P 500
Friday, 8/14, in my 401k (it has limited choices).
XLE – Added Tuesday, 8/22.
SSO – 2x S&P 500 ETF. Added 8/24.
CSCO – added 9/5.
I have considered selling CSCO because it is no longer
a momentum leader - but I am still holding it. INTC would probably be my
choice, but it has been under pressure due to restrictions on chip sales to
China.
TODAY’S COMMENT:
New-high/new-low data improved by 4.3 standard deviations
on 9 October. That’s a good buy signal and reinforced the impression that the
bottom of this 8% correction was 3 October. On 10 October New-highs outpaced
new-lows and that looked like an all clear. Since then, new-lows have again
outpaced new-highs. While that isn’t a huge negative in my system, I’d sure like
to see the spread turn positive again.
Wednesday was a statistically significant down-day. That
just means that the price-volume move exceeded my statistical parameters.
Statistics show that a statistically-significant, down-day is followed by an up-day
about 60% of the time. This may also be
signaling a flush-out of remaining weak hands. If that is true, it could signal
a short-term bottom.
Volume was lower today than we saw at the prior lows on 3
& 4 October. That suggests selling pressure is easing. Checking the
Selling-Pressure minus Buying -Pressure indicator confirms that it is trending
up in a bullish direction. My Money Trend indicator is also trending up and it uses a similar type
analysis. None of this means that the markets won’t continue to fall, but I
think they do suggest that markets are likely to be near a turn-around upward. We may have to wait out more earnings reports before that bounce takes place.
It looks like the correction is over, but we’re still
waiting to see if the Index can break above its 50-dMA. The Geo-Political
situation is a worry and we need to keep watch on the markets to gauge their
reaction.
The daily spread of 20 Indicators (Bulls minus Bears) declined
from +9 to +2 (a positive number is bullish; negatives are bearish); the 10-day
smoothed sum that smooths the daily fluctuations improved from +10 to +18.
(The trend direction is more important than the actual number for the 10-day
value.) These numbers sometimes change after I post the blog based on data that
comes in late. Most of these 20 indicators are short-term so they tend to
bounce around a lot.
LONG-TERM INDICATOR: The Long Term NTSM indicator
declined to HOLD: VOLUME, PRICE, SENTIMENT & VIX are neutral. The
New-high/new-low reversal signal has expired.
(The important BUY in this indicator was on 21
October, 7-days after the bottom. For my NTSM overall signal, I suggested that
a short-term buying opportunity occurred on 27 September (based on improved
market internals on the retest), although without market follow-thru, I was
unwilling to call a buy; however, I did close shorts and increased stock
holdings. I issued a Buy-Signal on 4 October, 6-days before the final bottom,
based on stronger market action that confirmed the market internals signal. The
NTSM sell-signal was issued 21 December, 9 sessions before the high of this
recent bear market, based on the bearish “Friday Rundown” of indicators.)
It looks like we have already seen the bottom. There are
indications that the bottom was Wednesday at 4230 on the S&P 500 and I
think we got confirmation on 9 & 10 October.
ETF - MOMENTUM ANALYSIS:
TODAY’S RANKING OF 15 ETFs
(Ranked Daily)
ETF ranking follows:

The top ranked ETF receives
100%. The rest are then ranked based on their momentum relative to the leading
ETF.
*For additional background on
the ETF ranking system see NTSM Page at…
http://navigatethestockmarket.blogspot.com/p/exchange-traded-funds-etf-ranking.html
DOW STOCKS - TODAY’S MOMENTUM RANKING
OF THE DOW 30 STOCKS (Ranked Daily)
DOW 30 momentum ranking
follows:

The top ranked Stock receives
100%. The rest are then ranked based on their momentum relative to the leading Stock.
For more details, see NTSM
Page at…
https://navigatethestockmarket.blogspot.com/p/a-system-for-trading-dow-30-stocks-my_8.html
WEDNESDAY MARKET INTERNALS (NYSE
DATA)
My basket of Market Internals remained BUY. (My basket of Market
Internals is a decent trend-following analysis of current market action, but
should not be used alone for short term trading. They are most useful when they
diverge from the Index.)
...My current invested
position is about 75% stocks, including stock mutual funds and ETFs. I’m
usually about 50% invested in stocks. I’m “over invested” now expecting new,
all-time highs this year. That burns all the cash. I have about 25% of the portfolio in bonds.
I trade about 15-20% of the
total portfolio using the momentum-based analysis I provide here. When I see a
definitive bottom, I add a lot more stocks to the portfolio using an S&P
500 ETF as I did back in October.


 My basket of Market Internals remained SELL. (My basket of Market
Internals is a decent trend-following analysis of current market action, but
should not be used alone for short term trading. They are most useful when they
diverge from the Index.)