Friday, June 23, 2023

IHS Markit Manufacturing & Services PMI ... Momentum Trading DOW Stocks & ETFs … Stock Market Analysis ...

 
“Trade what you see; not what you think.” – The Old Fool, Richard McCranie, trader extraordinaire.
 
IHS MARKIT MANUFACTURING PMI
“The S&P Global US Manufacturing PMI fell to 46.3 in June 2023, pointing to the biggest contraction in the manufacturing sector since December, compared to 48.4 in May...” Story at...
https://tradingeconomics.com/united-states/manufacturing-pmi
 
IHS MARKIT SERVICES PMI
“... The S&P Global US Services PMI edged down to 54.1 in June 2023 from 54.9 in May...” Story at...
https://tradingeconomics.com/united-states/services-pmi
 
MARKET REPORT / ANALYSIS
-Friday the S&P 500 dropped about 0.8% to 4348.
-VIX rose about 4% to 13.44.
-The yield on the 10-year Treasury dipped to 3.740%.
 
PULLBACK DATA:
-Drop from Top: 9.3%. 25.4% max (on a closing basis).
-Trading Days since Top: 368-days.
The S&P 500 is 8.9% ABOVE its 200-dMA and 3.5% ABOVE its 50-dMA.
*I won’t call the correction over until the S&P 500 makes a new-high; however, evidence suggests the bottom was in the 3600 area and we called a buy on 4 October 2022.
 
MY TRADING POSITIONS:
I am not trading as much as in the past. You may wish to use the momentum charts and/or the Monday 40-day gain charts for trading the Dow stocks and ETFs.
 
MSFT – Microsoft.
XLK – Technology ETF.
XLY - Consumer Discretionary ETF.
 
KRE – Regional Banking ETF. This is a very small position for me. KRE tested the May 4 low of 36.08 on much lower volume 11 & 12 May.
I’ll probably sell this position Friday – it has been very weak recently. But I forgot to! In my defense - it is a small position.
 
SHY – Short term bonds. 30-day yield is 5.04% - 9 June 2023. (Trailing 1-year yield is 3.04%.) Once this weak period ends, I’ll sell SHY and buy stocks/stock ETFs.
 
TODAY’S COMMENT:
Volume was extreme today as the Russell rebalanced their indices.
 
I suppose a lot of my indicators look pretty simple. I would like to point out, just looking at recent calls, that the indicators called: (1) The top of the Coronavirus correction; (2) a buy a few days after the Coronavirus correction bottom (although I didn’t believe it); (3) the top of the current correction; (4) a buy near the bottom of the current 25% correction; and a warning last week that we were likely to see a 5-6% pullback. So far that is playing out as foreseen. Obi Wan would be proud

The catch is that since this is likely to be a small correction, indicators will probably not be able to give me a timely Buy-signal. I'll probably start buying near the 50-dMA.
 
Here’s my weekly review of indicators:
The weekly rundown of indicators shifted to the Bear side (now 13-bear and 8-bull). (These indicators tend to be both long-term and short-term, so they are different than the 20 that I report on daily.)
 
While the Friday summary of indicators is now well to the Bear side, some of the bull indicators are reasonably reliable.  This tends to bolster the view that the current pullback is likely to be small. Based on today's numbers, the markets do not appear to be starting a major correction, so I’ll stick with my suggestion that the S&P 500 is most likely to decline about 3-4% below today’s close.  
 
BULL SIGNS
-Long-term new-high/new-low data.
-The long-term, 50-dEMA, Fosback Hi-Low Logic Index.
-Slope of the 40-dMA of New-highs is rising.
-On average, the size of up-moves has been larger than the size of down-moves over the last month.
-VIX indicator.
-The 5-10-20 Timer System is BUY.
-The 5-day EMA is above the 10-day EMA so short-term momentum is bullish.
-S&P 500 spread vs. Utilities (XLU-ETF) shows the Index outpacing Utilities.
 
NEUTRAL
-There have been 3 Distribution Days since the Follow-thru day on 2 June.
-There have been 3 Statistically-Significant days (big moves in price-volume) in the last 15-days.
-Sentiment.
-Bollinger Band Squeeze 28 April - expired.
-Bollinger Bands.
-The 50-dMA percentage of issues advancing on the NYSE (Breadth) has not been below 50%, for more than 3 days in a row.
-Overbought/Oversold Index (Advance/Decline Ratio).
-There was a Zweig Breadth Thrust 31 March. That’s a rare, very-bullish sign, but the McClellan Oscillator subsequently turned negative, so this indicator has expired.
-The S&P 500 is 8.9% above its 200-dMA. (Bear indicator is 12% above the 200-day.) It was 11.1% above the 200-day last week.
-MACD of S&P 500 price made a bullish crossover 26 May, but it has been falling and is now very close to a bearish crossover. Call it neutral.
-The short-term, 10-day EMA, Fosback Hi-Low Logic Index is neutral.
-There have been 6 up-days over the last 10 sessions – neutral.
-There have been 13 up-days over the last 20 sessions - neutral.
-RSI
-There was a 90% down-volume day 9 March.
-There was a Hindenburg Omen signal 3 May 2023. The McClellan Oscillator turned positive 18 May. – Expired.
-The Calm-before-the-Storm/Panic Indicator flashed a panic-buying signal 10 November - expired.
-2.8% of all issues traded on the NYSE made new, 52-week highs when the S&P 500 made a new all-time-high, 3 January 2022. (There is no bullish signal for this indicator.) This indicated that the advance was too narrow and a correction was likely to be >10%. It proved correct, but is now Expired.
-10 May there was a Bullish Outside Reversal Day – Expired.
 
BEAR SIGNS
-The smoothed advancing volume on the NYSE is falling.
-The 10-dMA percentage of issues advancing on the NYSE (Breadth) is below 50%.
-The 50-dMA percentage of issues advancing on the NYSE (Breadth) is below 50%.
-The 100-dMA percentage of issues advancing on the NYSE (Breadth) is below 50%.
-Issues advancing on the NYSE (Breadth) compared to the S&P 500. The Index is too far ahead of Breadth.
-Smoothed Buying Pressure minus Selling Pressure is falling.
-My Money Trend indicator is falling sharply.
-Short-term new-high/new-low data.
-McClellan Oscillator.
-The graph of the 100-day Count (the 100-day sum of up-days) is down.
-XLI-ETF (Cyclical Industrials) is underperforming the S&P 500 and the trend direction is down.
-The Smart Money (late-day action).
-42% of the 15-ETFs that I track have been up over the last 10-days.
 
On Friday, 21 February, 2 days after the top before the Coronavirus pullback, there were 10 bear-signs and 1 bull-sign. Now there are 13 bear-signs and 8-Bull. Last week, there were 8 bear-sign and 15 bull-signs.
 
The daily spread of 20 Indicators (Bulls minus Bears) declined from -6 to -8 (a positive number is bullish; negatives are bearish); the 10-day smoothed sum that smooths the daily fluctuations declined from +30 to +14. (The trend direction is more important than the actual number for the 10-day value.) These numbers sometimes change after I post the blog based on data that comes in late. Most of these 20 indicators are short-term so they tend to bounce around a lot.
 
LONG-TERM INDICATOR: The Long Term NTSM indicator remained BUY: PRICE & VIX are positive; SENTIMENT & VOLUME are neutral. The indicator can signal a “Buy” at the top. It is designed to call a buy when conditions become good at a bottom; but conditions are good at tops too. I think that we’ll see a better time to buy in the next several weeks.
 
(The important BUY in this indicator was on 21 October, 7-days after the bottom. For my NTSM overall signal, I suggested that a short-term buying opportunity occurred on 27 September (based on improved market internals on the retest), although without market follow-thru, I was unwilling to call a buy; however, I did close shorts and increased stock holdings. I issued a Buy-Signal on 4 October, 6-days before the final bottom, based on stronger market action that confirmed the market internals signal. The NTSM sell-signal was issued 20 December, 8 sessions before the high of this recent bear market, based on the bearish “Friday Rundown” of indicators.)
 
Bottom line: I remain a cautious Bull, expecting a decline of another 3-4% on the S&P 500.
 
ETF - MOMENTUM ANALYSIS:
TODAY’S RANKING OF 15 ETFs (Ranked Daily)
ETF ranking follows:

The top ranked ETF receives 100%. The rest are then ranked based on their momentum relative to the leading ETF.
*For additional background on the ETF ranking system see NTSM Page at…
http://navigatethestockmarket.blogspot.com/p/exchange-traded-funds-etf-ranking.html
 
DOW STOCKS - TODAY’S MOMENTUM RANKING OF THE DOW 30 STOCKS (Ranked Daily)
DOW 30 momentum ranking follows:
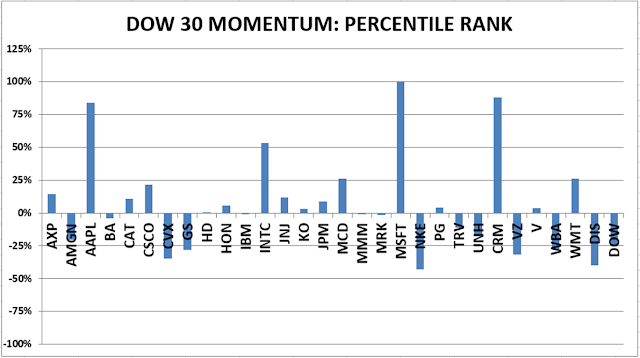
 
The top ranked Stock receives 100%. The rest are then ranked based on their momentum relative to the leading Stock.
For more details, see NTSM Page at…
https://navigatethestockmarket.blogspot.com/p/a-system-for-trading-dow-30-stocks-my_8.html
 
FRIDAY MARKET INTERNALS (NYSE DATA)
My basket of Market Internals remained SELL.
(My basket of Market Internals is a decent trend-following analysis of current market action, but should not be used alone for short term trading. They are most useful when they diverge from the Index.) 
 
...My current invested position is about 55% stocks, including stock mutual funds and ETFs. I’m usually about 50% invested in stocks.
 
I trade about 15-20% of the total portfolio using the momentum-based analysis I provide here. If I can see a definitive bottom, I’ll add a lot more stocks to the portfolio using an S&P 500 ETF.
 

Thursday, June 22, 2023

Leading Economic Indicators ... Jobless Clams ... Existing Home Sales ... Momentum Trading DOW Stocks & ETFs … Stock Market Analysis ...

 
Political commentary at...
https://michaelpramirez.com/index.html
 
“Trade what you see; not what you think.” – The Old Fool, Richard McCranie, trader extraordinaire.
 
LEADING ECONOMIC INDICATORS (Conference Board)
“(LEI) for the U.S. declined by 0.7 percent in May 2023 to 106.7 (2016=100), following a decline of 0.6 percent in April... we project that the US economy will contract over the Q3 2023 to Q1 2024 period. The recession likely will be due to continued tightness in monetary policy and lower government spending.” – Conference Board. Press release at...
https://www.conference-board.org/topics/us-leading-indicators/press/us-lei-june-2023
 
JOBLESS CLAIMS (Business Report.com)
“The number of Americans applying for unemployment benefits remained elevated last week, potentially another signal that Federal Reserve rate hikes are beginning to cool a surprisingly resilient labor market. There were 264,000 initial jobless claims for the week ending June 17, the same as the previous week’s revised number...” Story at...
https://www.businessreport.com/business/us-initial-jobless-claims-remain-elevated
 
EXISTING HOME SALES (CNBC)
“Sales of previously owned homes were essentially flat in May compared with April, according to the National Association of Realtors.” Story at...
https://www.cnbc.com/2023/06/22/home-sales-flat-may.html
 
EIA CRUDE INVENTORIES (EIA)
“U.S. commercial crude oil inventories (excluding those in the Strategic Petroleum Reserve) decreased by 3.8 million barrels from the previous week. At 463.3 million barrels, U.S. crude oil inventories are approximately at the five year average for this time of year.” Report at...
https://ir.eia.gov/wpsr/wpsrsummary.pdf
 
THE FIVE YEARS ARE UP – THE EARTH IS DOOMED (Washington Examiner)
“It’s all over for us. The climate change crisis is no longer reversible, and all of humanity is doomed.
At least, that is all according to Greta Thunberg and a “top climate scientist” who said that “climate change will wipe out all of humanity unless we stop using fossil fuels over the next five years.” That was tweeted on this day five years ago, meaning today is the final day we have to stop using fossil fuels entirely. But all of this raises a question: Why was some random child propped up as the arbiter of climate change policy in the first place?” Story at...
Why was anyone listening to Greta Thunberg in the first place? (msn.com)
 
MARKET REPORT / ANALYSIS
-Thursday the S&P 500 rose about 0.4% to 4366.
-VIX fell about 2% to 13.20.
-The yield on the 10-year Treasury rose to 3.797%.
 
PULLBACK DATA:
-Drop from Top: 8.6%. 25.4% max (on a closing basis).
-Trading Days since Top: 368-days.
The S&P 500 is 9.8% ABOVE its 200-dMA and 4.4% ABOVE its 50-dMA.
*I won’t call the correction over until the S&P 500 makes a new-high; however, evidence suggests the bottom was in the 3600 area and we called a buy on 4 October 2022.
 
MY TRADING POSITIONS:
I am not trading as much as in the past. You may wish to use the momentum charts and/or the Monday 40-day gain charts for trading the Dow stocks and ETFs.
 
MSFT – Microsoft.
XLK – Technology ETF.
XLY - Consumer Discretionary ETF.
 
KRE – Regional Banking ETF. This is a very small position for me. KRE tested the May 4 low of 36.08 on much lower volume 11 & 12 May.
I’ll probably sell this position Friday – it has been very weak recently.
 
SHY – Short term bonds. 30-day yield is 5.04% - 9 June 2023. (Trailing 1-year yield is 3.04%.) Once this weak period ends, I’ll sell SHY and buy stocks/stock ETFs.
 
TODAY’S COMMENT:
Holy Breadth Batman! The 10-dMA, 50-dMA and 100-dMA of issues advancing on the NYSE all dropped below 50% today. That last happened in October; more worrisome, it also occurred 6-days before the all-time high on the S&P 50 back on 2 January 2022. Back in January 22, the 20-dMA was also below 50%; that is not the case now, so that is one small positive sign.  A few other bearish signs: Breadth MACD is headed down; MACD is close to bearish; my Money Trend is down. As is often the case, the Friday summary of indicators will be interesting.
 
Not all is bad though; VIX is issuing a Buy signal.
 
Based on my indicators last week, it looks like the S&P 500 will see a about a 4% drop from today’s close over the next few weeks. I am suggesting a small decline, because, so far, indicators are not too bearish.  That could always change and today I did see some cracks in the indicators.
 
The daily spread of 20 Indicators (Bulls minus Bears) declined from -5 to -6 (a positive number is bullish; negatives are bearish); the 10-day smoothed sum that smooths the daily fluctuations declined from +44 to +30. (The trend direction is more important than the actual number for the 10-day value.) These numbers sometimes change after I post the blog based on data that comes in late. Most of these 20 indicators are short-term so they tend to bounce around a lot.
 
LONG-TERM INDICATOR: The Long Term NTSM indicator improved to BUY: PRICE & VIX are positive; SENTIMENT & VOLUME are neutral. The indicator can signal a “Buy” at the top because it is designed to call a buy when conditions become good at a bottom; but conditions are good at tops too. I think that we’ll see a better time to buy in the next several weeks.
 
(The important BUY in this indicator was on 21 October, 7-days after the bottom. For my NTSM overall signal, I suggested that a short-term buying opportunity occurred on 27 September (based on improved market internals on the retest), although without market follow-thru, I was unwilling to call a buy; however, I did close shorts and increased stock holdings. I issued a Buy-Signal on 4 October, 6-days before the final bottom, based on stronger market action that confirmed the market internals signal. The NTSM sell-signal was issued 20 December, 8 sessions before the high of this recent bear market, based on the bearish “Friday Rundown” of indicators.)
 
Bottom line: I remain a cautious Bull. Let’s see what the Friday rundown of indicators shows.
 
ETF - MOMENTUM ANALYSIS:
TODAY’S RANKING OF 15 ETFs (Ranked Daily)
ETF ranking follows:

The top ranked ETF receives 100%. The rest are then ranked based on their momentum relative to the leading ETF.
*For additional background on the ETF ranking system see NTSM Page at…
http://navigatethestockmarket.blogspot.com/p/exchange-traded-funds-etf-ranking.html
 
DOW STOCKS - TODAY’S MOMENTUM RANKING OF THE DOW 30 STOCKS (Ranked Daily)
DOW 30 momentum ranking follows:
 

The top ranked Stock receives 100%. The rest are then ranked based on their momentum relative to the leading Stock.
For more details, see NTSM Page at…
https://navigatethestockmarket.blogspot.com/p/a-system-for-trading-dow-30-stocks-my_8.html
 
THURSDAY MARKET INTERNALS (NYSE DATA)
My basket of Market Internals slipped to SELL.
(My basket of Market Internals is a decent trend-following analysis of current market action, but should not be used alone for short term trading. They are most useful when they diverge from the Index.) 
 
...My current invested position is about 55% stocks, including stock mutual funds and ETFs. I’m usually about 50% invested in stocks.
 
I trade about 15-20% of the total portfolio using the momentum-based analysis I provide here. If I can see a definitive bottom, I’ll add a lot more stocks to the portfolio using an S&P 500 ETF.


Wednesday, June 21, 2023

More FED Hikes ... Core Inflation Remains Sticky ... Momentum Trading DOW Stocks & ETFs … Stock Market Analysis ...

 
“Trade what you see; not what you think.” – The Old Fool, Richard McCranie, trader extraordinaire.
 
 
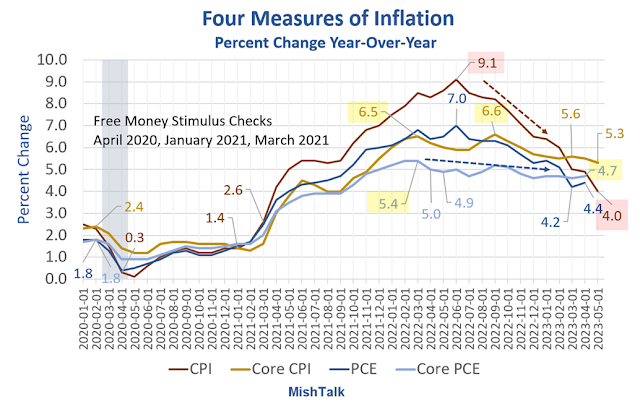
CORE INFLATION REMAINS STICKY (MishTalk)
Chart and discussion at...
https://mishtalk.com/economics/cpi-inflation-has-dropped-dramatically-but-core-cpi-and-core-pce-inflation-are-dropping-very-slowly/
 
POWELL EXPECTS MORE FED RATE HIKES AHEAD (CNBC)
“Inflation has moderated somewhat since the middle of last year,” he said. “Nonetheless, inflation pressures continue to run high, and the process of getting inflation back down to 2% has a long way to go.” ...Powell also noted that getting inflation lower will require slowing down the economy to below-trend growth...  [He] affirmed that more interest rate increases are likely ahead until additional progress is made on bringing down inflation.” Story at...
https://www.cnbc.com/2023/06/21/powell-expects-more-fed-rate-hikes-ahead-as-inflation-fight-has-a-long-way-to-go.html
 
MARKET REPORT / ANALYSIS
-Wednesday the S&P 500 slipped about 0.5% to 4366.
-VIX fell about 5% to 13.20.
-The yield on the 10-year Treasury was little changed at 3.725%.
 
PULLBACK DATA:
-Drop from Top: 9%. 25.4% max (on a closing basis).
-Trading Days since Top: 367-days.
The S&P 500 is 9.5% ABOVE its 200-dMA and 4.2% ABOVE its 50-dMA.
*I won’t call the correction over until the S&P 500 makes a new-high; however, evidence suggests the bottom was in the 3600 area and we called a buy on 4 October 2022.
 
MY TRADING POSITIONS:
I am not trading as much as in the past. You may wish to use the momentum charts and/or the Monday 40-day gain charts for trading the Dow stocks and ETFs.
 
MSFT – Microsoft.
XLK – Technology ETF.
XLY - Consumer Discretionary ETF.
 
KRE – Regional Banking ETF. This is a very small position for me. KRE tested the May 4 low of 36.08 on much lower volume 11 & 12 May.
 
SHY – Short term bonds. 30-day yield is 5.04% - 9 June 2023. (Trailing 1-year yield is 3.04%.) Once this weak period ends, I’ll sell SHY and buy stocks/stock ETFs.
 
TODAY’S COMMENT:
Powell’s assertion that more rate hikes are necessary, is not really a surprise – the expectation for another rate hike in July was above 50%.  It’s a worry though - his statement looks more bearish than may have been expected by markets. In the end, though, we need to watch market reaction rather than worry about the news. The close today wasn’t particularly encouraging as the Index fell nearly 0.5% in the last hour or so of trading.
 
Based on my indicators last week, it looks like the S&P 500 will see a about a 4% drop from today’s close over the next few weeks. I am suggesting a small decline, because, so far, indicators are not too bearish.  That could always change.
 
The daily spread of 20 Indicators (Bulls minus Bears) declined from -1 to -5 (a positive number is bullish; negatives are bearish); the 10-day smoothed sum that smooths the daily fluctuations declined from +57 to +44. (The trend direction is more important than the actual number for the 10-day value.) These numbers sometimes change after I post the blog based on data that comes in late. Most of these 20 indicators are short-term so they tend to bounce around a lot.
 
LONG-TERM INDICATOR: The Long Term NTSM indicator remained HOLD: PRICE is positive; SENTIMENT, VOLUME & VIX are neutral.
 
(The important BUY in this indicator was on 21 October, 7-days after the bottom. For my NTSM overall signal, I suggested that a short-term buying opportunity occurred on 27 September (based on improved market internals on the retest), although without market follow-thru, I was unwilling to call a buy; however, I did close shorts and increased stock holdings. I issued a Buy-Signal on 4 October, 6-days before the final bottom, based on stronger market action that confirmed the market internals signal. The NTSM sell-signal was issued 20 December, 8 sessions before the high of this recent bear market, based on the bearish “Friday Rundown” of indicators.)
 
Bottom line: I remain a cautious Bull.
 
ETF - MOMENTUM ANALYSIS:
TODAY’S RANKING OF 15 ETFs (Ranked Daily)
ETF ranking follows:

The top ranked ETF receives 100%. The rest are then ranked based on their momentum relative to the leading ETF.
*For additional background on the ETF ranking system see NTSM Page at…
http://navigatethestockmarket.blogspot.com/p/exchange-traded-funds-etf-ranking.html
 
DOW STOCKS - TODAY’S MOMENTUM RANKING OF THE DOW 30 STOCKS (Ranked Daily)
DOW 30 momentum ranking follows:

The top ranked Stock receives 100%. The rest are then ranked based on their momentum relative to the leading Stock.
For more details, see NTSM Page at…
https://navigatethestockmarket.blogspot.com/p/a-system-for-trading-dow-30-stocks-my_8.html
 
WEDNESDAY MARKET INTERNALS (NYSE DATA)
My basket of Market Internals remained HOLD.
(My basket of Market Internals is a decent trend-following analysis of current market action, but should not be used alone for short term trading. They are most useful when they diverge from the Index.) 
 
...My current invested position is about 55% stocks, including stock mutual funds and ETFs. I’m usually about 50% invested in stocks.
 
I trade about 15-20% of the total portfolio using the momentum-based analysis I provide here. If I can see a definitive bottom, I’ll add a lot more stocks to the portfolio using an S&P 500 ETF.
 

Tuesday, June 20, 2023

Housing Starts ... Momentum Trading DOW Stocks & ETFs … Stock Market Analysis ...

 
“Trade what you see; not what you think.” – The Old Fool, Richard McCranie, trader extraordinaire.
 
“This is not a circumstance where he [Trump] is the victim or this is government overreach...He provoked this whole problem himself. Yes, he’s been the victim of unfair witch hunts in the past. But that doesn’t obviate the fact that he’s also a fundamentally flawed person who engages in reckless conduct. And that leads to situations, calamitous situations like this, which are very destructive and hurt any political cause he’s associated with... he’s a very petty individual who will always put his interests ahead of the country’s, his personal gratification of his ego. But our country can’t be a therapy session for a troubled man like this.” – Bill Barr, Attorney General under Trump.
My cmt: Remember, Trump forced Bill Barr to resign because Barr wouldn’t go along with Trump’s claim that the election was rigged and that Trump actually won.
 
HOUSING STARTS (YahooFinance)
“New construction surged by 21.7 percent on an unadjusted basis in May, sailing past economists’ projections that there would be a small decline.” Story at...
https://news.yahoo.com/home-construction-surges-may-could-171931110.html
 
OPTIONS EXPIRATION - AMMO FOR THE BEARS (Heritage Capital)
“I sense that the 2023 high in the major indices hit intra-day on Friday may be a short-term peak...I am still in the boat where I have a tough time adding much exposure to the long side. Remember all those Chicken Little cries about the market falling and the rally being too narrow to succeed? Well, it really broadened out...The S&P 500 Advance/Decline Line just made an all-time high. So much for 7 stocks accounting for all of the return.” – Paul Schatz, President Heritage Capital. Commentary at...
https://investfortomorrow.com/blog/post-expiration-gives-some-ammo-to-bears/
 
MARKET REPORT / ANALYSIS
-Tuesday the S&P 500 slipped about 0.5% to 4389.
-VIX rose about 3% to 13.88.
-The yield on the 10-year Treasury slipped to 3.723%.
 
PULLBACK DATA:
-Drop from Top: 8.5%. 25.4% max (on a closing basis).
-Trading Days since Top: 366-days.
The S&P 500 is 10.1% ABOVE its 200-dMA and 4.8% ABOVE its 50-dMA.
*I won’t call the correction over until the S&P 500 makes a new-high; however, evidence suggests the bottom was in the 3600 area and we called a buy on 4 October 2022.
 
MY TRADING POSITIONS:
I am not trading as much as in the past. You may wish to use the momentum charts and/or the Monday 40-day gain charts for trading the Dow stocks and ETFs.
 
MSFT – Microsoft.
XLK – Technology ETF.
XLY - Consumer Discretionary ETF.
 
KRE – Regional Banking ETF. This is a very small position for me. KRE tested the May 4 low of 36.08 on much lower volume 11 & 12 May.
 
SHY – Short term bonds. 30-day yield is 5.04% - 9 June 2023. (Trailing 1-year yield is 3.04%.) Once this weak period ends, I’ll sell SHY and buy stocks/stock ETFs.
 
TODAY’S COMMENT:
I trimmed some more stocks today by cutting my 401k holdings some. This puts me at about 55% in stocks, a conservative, but still bullish position.
 
Based on my indicators last week, it looks like the S&P 500 will see a 4-6% drop from the recent high of last Friday over the next few weeks. That should drop the Index to near the 50-dMA.
 
The daily spread of 20 Indicators (Bulls minus Bears) remained -1 (a positive number is bullish; negatives are bearish); the 10-day smoothed sum that smooths the daily fluctuations declined from +59 to +57. (The trend direction is more important than the actual number for the 10-day value.) These numbers sometimes change after I post the blog based on data that comes in late. Most of these 20 indicators are short-term so they tend to bounce around a lot.
 
LONG-TERM INDICATOR: The Long Term NTSM indicator declined to HOLD: PRICE is positive; SENTIMENT, VOLUME & VIX are neutral.
 
(The important BUY in this indicator was on 21 October, 7-days after the bottom. For my NTSM overall signal, I suggested that a short-term buying opportunity occurred on 27 September (based on improved market internals on the retest), although without market follow-thru, I was unwilling to call a buy; however, I did close shorts and increased stock holdings. I issued a Buy-Signal on 4 October, 6-days before the final bottom, based on stronger market action that confirmed the market internals signal. The NTSM sell-signal was issued 20 December, 8 sessions before the high of this recent bear market, based on the bearish “Friday Rundown” of indicators.)
 
Bottom line: I remain a cautious Bull.
 
ETF - MOMENTUM ANALYSIS:
TODAY’S RANKING OF 15 ETFs (Ranked Daily)
ETF ranking follows:

The top ranked ETF receives 100%. The rest are then ranked based on their momentum relative to the leading ETF.
*For additional background on the ETF ranking system see NTSM Page at…
http://navigatethestockmarket.blogspot.com/p/exchange-traded-funds-etf-ranking.html

DOW STOCKS - TODAY’S MOMENTUM RANKING OF THE DOW 30 STOCKS (Ranked Daily)
DOW 30 momentum ranking follows:
 
The top ranked Stock receives 100%. The rest are then ranked based on their momentum relative to the leading Stock.
For more details, see NTSM Page at…
https://navigatethestockmarket.blogspot.com/p/a-system-for-trading-dow-30-stocks-my_8.html

TUESDAY MARKET INTERNALS (NYSE DATA)
My basket of Market Internals remained HOLD.
(My basket of Market Internals is a decent trend-following analysis of current market action, but should not be used alone for short term trading. They are most useful when they diverge from the Index.) 
 
...My current invested position is about 55% stocks, including stock mutual funds and ETFs. I’m usually about 50% invested in stocks.
 
I trade about 15-20% of the total portfolio using the momentum-based analysis I provide here. If I can see a definitive bottom, I’ll add a lot more stocks to the portfolio using an S&P 500 ETF.
 

Selling Some Stock

 I cut back in my 401k funds which were invested in S&P 500 and a Small Cap funds today. I am now about 55% invested which is a conservative, but still bullish stance for me. 

Saturday, June 17, 2023

Michigan Sentiment ... Momentum Trading DOW Stocks & ETFs … Stock Market Analysis ...

Monday is Juneteenth, the new federal holiday, so no blog Monday – markets are closed.
 
“Trade what you see; not what you think.” – The Old Fool, Richard McCranie, trader extraordinaire.
 
UNIV OF MICHIGAN SENTIMENT (Univ of Michigan)
“Consumer sentiment lifted 8% in June, reaching its highest level in four months, reflecting greater optimism as inflation eased and policymakers resolved the debt ceiling crisis. The outlook over the economy surged 28% over the short run and 14% over the long run. Sentiment is now 28% above the historic low from a year ago and may be resuming its upward trajectory since then. As it stands, though, sentiment remains low by historical standards as income expectations softened. A majority of consumers still expect difficult times in the economy over the next year.” Press release at...
http://www.sca.isr.umich.edu/
 
MARKET REPORT / ANALYSIS
-Friday the S&P 500 slipped about 0.4% to 4410.
-VIX fell about 7% to 13.54. (I can’t begin to explain that.)
-The yield on the 10-year Treasury rose to 3.769%.
 
PULLBACK DATA:
-Drop from Top: 8.1%. 25.4% max (on a closing basis).
-Trading Days since Top: 365-days.
The S&P 500 is 10.7% ABOVE its 200-dMA and 5.5% ABOVE its 50-dMA.
*I won’t call the correction over until the S&P 500 makes a new-high; however, evidence suggests the bottom was in the 3600 area and we called a buy on 4 October 2022.
 
MY TRADING POSITIONS:
I am not trading as much as in the past. You may wish to use the momentum charts and/or the Monday 40-day gain charts for trading the Dow stocks and ETFs.
 
IWM – Russell 2000 - SOLD
MSFT – Microsoft.
“Microsoft shares climbed to a record Thursday after analysts at JPMorgan Chase touted the software maker’s growth prospects in artificial intelligence.” Story at...
https://www.cnbc.com/2023/06/15/microsoft-stock-hits-record-as-leaders-see-10-billion-in-ai-revenue.html
 
XLK – Technology ETF.
XLE – Energy Sector ETF. - SOLD
XLY - Consumer Discretionary ETF.
 
KRE – Regional Banking ETF. This is a very small position for me. KRE tested the May 4 low of 36.08 on much lower volume 11 & 12 May.
 
SHY – Short term bonds. 30-day yield is 5.04% - 9 June 2023. (Trailing 1-year yield is 3.04%.) I’ll hold this, but if the market retests the lows, I’ll sell it and buy stocks.)
 
TODAY’S COMMENT:
Today was an options expiration day so volumes were extremely high. That can skew the daily results.  I still suspect that 
Thursday was a short-term top and we may see a 4-6% drop in the S&P 500 in the near term.
 
I trimmed some stocks in the morning (not much), but was pushed for time so I couldn’t post my moves as I made them. I sold IWM at a small profit and sold XLE at a 7% loss. XLE is irritating since I didn’t follow my own advice. Trade what you see, not what you think. I thought energy would recover faster than it has, while my momentum charts have consistently shown XLE in the tank this year.
 
Here’s my weekly review of indicators:
The weekly rundown of indicators remained to the Bull side (now 8-bear and 15-bull), but not quite as bullish as last week. (These indicators tend to be both long-term and short-term, so they are different than the 20 that I report on daily.) 
 
BULL SIGNS
-The 10-dMA percentage of issues advancing on the NYSE (Breadth) is above 50%.
-The 50-dMA percentage of issues advancing on the NYSE (Breadth) is above 50%.
-The 100-dMA percentage of issues advancing on the NYSE (Breadth) is above 50%.
-MACD of S&P 500 price made a bullish crossover 26 May.
-Short-term new-high/new-low data.
-Long-term new-high/new-low data.
-The long-term, 50-dEMA, Fosback Hi-Low Logic Index.
-McClellan Oscillator.
-Slope of the 40-dMA of New-highs is rising.
-On average, the size of up-moves has been larger than the size of down-moves over the last month.
-The graph of the 100-day Count (the 100-day sum of up-days) is up.
-The 5-10-20 Timer System is BUY.
-The 5-day EMA is above the 10-day EMA so short-term momentum is bullish.
-S&P 500 spread vs. Utilities (XLU-ETF) shows the Index outpacing Utilities.
-56% of the 15-ETFs that I track have been up over the last 10-days.
 
NEUTRAL
-There has been 2 Distribution Days since the Follow-thru day on 2 June.
-There have been 3 Statistically-Significant days (big moves in price-volume) in the last 15-days.
-Sentiment.
-Bollinger Band Squeeze 28 April - expired.
-Bollinger Bands. They were overbought yesterday.
-The 50-dMA percentage of issues advancing on the NYSE (Breadth) has not been below 50%, for more than 3 days in a row.
-Overbought/Oversold Index (Advance/Decline Ratio).
-There was a Zweig Breadth Thrust 31 March. That’s a rare, very-bullish sign, but the McClellan Oscillator subsequently turned negative, so this indicator has expired.
-The S&P 500 is 10.7% above its 200-dMA. (Bear indicator is 12% above the 200-day.) It was 11.1% above the 200-day yesterday.
-The short-term, 10-day EMA, Fosback Hi-Low Logic Index is neutral.
-There have been 7 up-days over the last 10 sessions – neutral.
-There have been 13 up-days over the last 20 sessions - neutral.
-VIX indicator.
-There was a 90% down-volume day 9 March.
-There was a Hindenburg Omen signal 3 May 2023. The McClellan Oscillator turned positive 18 May. – Expired.
-The Calm-before-the-Storm/Panic Indicator flashed a panic-buying signal 10 November - expired.
-2.8% of all issues traded on the NYSE made new, 52-week highs when the S&P 500 made a new all-time-high, 3 January 2022. (There is no bullish signal for this indicator.) This indicated that the advance was too narrow and a correction was likely to be >10%. It proved correct, but is now Expired.
-10 May there was a Bullish Outside Reversal Day – Expired.
 
BEAR SIGNS
-The smoothed advancing volume on the NYSE is falling.
-MACD of the percentage of issues advancing on the NYSE (breadth) made a bearish crossover 12 June.
-Issues advancing on the NYSE (Breadth) compared to the S&P 500. The Index is too far ahead of Breadth.
-Smoothed Buying Pressure minus Selling Pressure is falling.
-My Money Trend indicator is falling.
-RSI
-The Smart Money (late-day action) is down.
-XLI-ETF (Cyclical Industrials) is underperforming the S&P 500 and the trend direction is down.
 
On Friday, 21 February, 2 days after the top before the Coronavirus pullback, there were 10 bear-signs and 1 bull-sign. Now there are 8 bear-signs and 15-Bull. Last week, there were 2 bear-sign and 18 bull-signs.
 
The daily spread of 20 Indicators (Bulls minus Bears) slipped from +5 to -1 (a positive number is bullish; negatives are bearish); the 10-day smoothed sum that smooths the daily fluctuations declined from +65 to +59. (The trend direction is more important than the actual number for the 10-day value.) These numbers sometimes change after I post the blog based on data that comes in late. Most of these 20 indicators are short-term so they tend to bounce around a lot.
 
LONG-TERM INDICATOR: The Long Term NTSM indicator remained BUY: PRICE & VOLUME are positive; SENTIMENT & VIX are neutral. The indicator can signal a “Buy” at the top because it is designed to call a buy when conditions become good at a bottom; but conditions are good at tops too. Since I think the S&P 500 was at a short-term top Friday, this may not be the best time to buy.
 
(The important BUY in this indicator was on 21 October, 7-days after the bottom. For my NTSM overall signal, I suggested that a short-term buying opportunity occurred on 27 September (based on improved market internals on the retest), although without market follow-thru, I was unwilling to call a buy; however, I did close shorts and increased stock holdings. I issued a Buy-Signal on 4 October, 6-days before the final bottom, based on stronger market action that confirmed the market internals signal. The NTSM sell-signal was issued 20 December, 8 sessions before the high of this recent bear market, based on the bearish “Friday Rundown” of indicators.)
 
Bottom line: I remain a cautious Bull.
 
ETF - MOMENTUM ANALYSIS:
TODAY’S RANKING OF 15 ETFs (Ranked Daily)
ETF ranking follows:

The top ranked ETF receives 100%. The rest are then ranked based on their momentum relative to the leading ETF.
*For additional background on the ETF ranking system see NTSM Page at…
http://navigatethestockmarket.blogspot.com/p/exchange-traded-funds-etf-ranking.html
 
 
DOW STOCKS - TODAY’S MOMENTUM RANKING OF THE DOW 30 STOCKS (Ranked Daily)
DOW 30 momentum ranking follows:
 
The top ranked Stock receives 100%. The rest are then ranked based on their momentum relative to the leading Stock.
For more details, see NTSM Page at…
https://navigatethestockmarket.blogspot.com/p/a-system-for-trading-dow-30-stocks-my_8.html
 
FRIDAY MARKET INTERNALS (NYSE DATA)
My basket of Market Internals slipped to HOLD.
(My basket of Market Internals is a decent trend-following analysis of current market action, but should not be used alone for short term trading. They are most useful when they diverge from the Index.) 
 
...My current invested position is about 70% stocks, including stock mutual funds and ETFs. I’m usually about 50% invested in stocks. I’ll may cut back some more next week to reduce risk.
 
I trade about 15-20% of the total portfolio using the momentum-based analysis I provide here. If I can see a definitive bottom, I’ll add a lot more stocks to the portfolio using an S&P 500 ETF.
 

Thursday, June 15, 2023

Retail Sales ... Jobless Claims ... Philadelphia Fed ... Empire State Manufacturing ... Industrial Production ... Momentum Trading DOW Stocks & ETFs … Stock Market Analysis ...

 
“Trade what you see; not what you think.” – The Old Fool, Richard McCranie, trader extraordinaire.
 
“Thanks to new developments that sustain a plasma reaction much longer than previously thought possible, six distinct approaches to nuclear fusion — including Magnetized target fusion and Orbitron — are being built by private companies. Tech expert Jeff Brow says the prototype reactors could be tested in early 2024.” -
Nuclear Fusion Breakthroughs Suggest Limitless Energy is Closer Than Expected (msn.com)
In the meantime, we’re wasting billions subsidizing wind and solar with tax money thanks to incompetent politicians.  
 
RETAIL SALES (CNN)
“Retail sales at stores, online and in restaurants grew 0.3% in May from April, the Commerce Department reported on Thursday. That’s above economists’ expectations of a 0.1% decline...” Story at...
https://www.cnn.com/2023/06/15/economy/us-retail-sales-may/index.html
 
JOBLESS CLAIMS (AP News)
“U.S. applications for jobless claims were 262,000 for the week ending June 10, the Labor Department reported Thursday, more than analysts were expecting... The claims numbers for the past two weeks are the highest since October of 2021.” Story at...
https://apnews.com/article/unemployment-benefits-jobless-claims-layoffs-labor-140978ffe6a95f5a4efa84406d5e9421
 
PHILADELPHIA FED INDEX (RTT News)
“The Federal Reserve Bank of Philadelphia released a report on Thursday showing regional manufacturing activity contracted at a modestly faster rate in the month of June.” Story at...
https://www.rttnews.com/3370430/philly-fed-index-indicates-continued-contraction-in-june.aspx
 
EMPIRE STATE MANUFACTURING
“The Empire State Manufacturing Survey general business-conditions index climbed 38 points in June to 6.6 as business activity “increased modestly... positive reading indicates expansion or growth in manufacturing activity...” Story at...
https://www.cnybj.com/ny-manufacturing-index-rises-back-into-positive-territory-in-june/
 
INDUSTRIAL PRODUCTION (forexlive)
“Industrial production -0.2% versus 0.1%. This was the largest decline on the year (lowest since December)” More details at...
https://www.forexlive.com/news/us-industrial-production-for-may-02-versus-01-expected-20230615/
 
MARKET REPORT / ANALYSIS
-Thursday the S&P 500 rose about 1.2% to 4426.
-VIX rose about 4% to 14.5.
-The yield on the 10-year Treasury dropped to 3.721%.
 
PULLBACK DATA:
-Drop from Top: 7.7%. 25.4% max (on a closing basis).
-Trading Days since Top: 364-days.
The S&P 500 is 11.1% ABOVE its 200-dMA and 6% ABOVE its 50-dMA.
*I won’t call the correction over until the S&P 500 makes a new-high; however, evidence suggests the bottom was in the 3600 area and we called a buy on 4 October 2022.
 
MY TRADING POSITIONS:
I am not trading as much as in the past. You may wish to use the momentum charts and/or the Monday 40-day gain charts for trading the Dow stocks and ETFs.
 
IWM – Russell 2000.
MSFT – Microsoft.
“Microsoft shares climbed to a record Thursday after analysts at JPMorgan Chase touted the software maker’s growth prospects in artificial intelligence.” Story at...
https://www.cnbc.com/2023/06/15/microsoft-stock-hits-record-as-leaders-see-10-billion-in-ai-revenue.html
 
XLK – Technology ETF.
XLE – Energy Sector ETF. XLE tested its March low on 16 May on lower volume so I continue to hold it.
XLY - Consumer Discretionary ETF.
 
KRE – Regional Banking ETF. This is a very small position for me. KRE tested the May 4 low of 36.08 on much lower volume 11 & 12 May.
 
SHY – Short term bonds. 30-day yield is 5.04% - 9 June 2023. (Trailing 1-year yield is 3.04%.) I’ll hold this, but if the market retests the lows, I’ll sell it and buy stocks.)
 
TODAY’S COMMENT:
Today was a statistically significant up-day. That just means that the price-volume move exceeded my statistical parameters. Statistics show that a statistically-significant, up-day is followed by a down-day about 60% of the time.  Statistically-significant, up-days almost always coincide with tops, but not all statistically-significant, up-days occur at tops. Today could be the short-term top I have been expecting. Both RSI and Bollinger Bands were overbought today along with a couple of other top signs.
 
If I can find the time tomorrow, I’ll probably trim a few stocks.  At 75% invested I’m too bullish when it looks like the S&P 500 is headed for about a 4-6% trip down, back to around the 50-dMA. It probably won’t get to the lower range (6%). Dip buyers are likely to move in before the Index get’s back to its 50-dMA unless the market trips on unforeseen news.
 
The daily spread of 20 Indicators (Bulls minus Bears) slipped from +7 to +5 (a positive number is bullish; negatives are bearish); the 10-day smoothed sum that smooths the daily fluctuations improved from +55 to +65. (The trend direction is more important than the actual number for the 10-day value.) These numbers sometimes change after I post the blog based on data that comes in late. Most of these 20 indicators are short-term so they tend to bounce around a lot.
 
LONG-TERM INDICATOR: The Long Term NTSM indicator remained BUY: PRICE & VOLUME are positive; SENTIMENT & VIX are neutral. The indicator can signal a “Buy” at the top because it is designed to call a buy when conditions become good at a bottom; but conditions are good at tops too.
 
(The important BUY in this indicator was on 21 October, 7-days after the bottom. For my NTSM overall signal, I suggested that a short-term buying opportunity occurred on 27 September (based on improved market internals on the retest), although without market follow-thru, I was unwilling to call a buy; however, I did close shorts and increased stock holdings. I issued a Buy-Signal on 4 October, 6-days before the final bottom, based on stronger market action that confirmed the market internals signal. The NTSM sell-signal was issued 20 December, 8 sessions before the high of this recent bear market, based on the bearish “Friday Rundown” of indicators.)
 
Bottom line: I remain a cautious Bull, but I expect a retreat down toward the S&P 500 lower trend line, now, so I will reduce some stocks. There's a reminder: short-term trading is a loser's game. While I may trim some stocks to reduce risk, I may not come out ahead if I buy more stocks later. 
 
ETF - MOMENTUM ANALYSIS:
TODAY’S RANKING OF 15 ETFs (Ranked Daily)
ETF ranking follows:

The top ranked ETF receives 100%. The rest are then ranked based on their momentum relative to the leading ETF.
*For additional background on the ETF ranking system see NTSM Page at…
http://navigatethestockmarket.blogspot.com/p/exchange-traded-funds-etf-ranking.html
 
 
DOW STOCKS - TODAY’S MOMENTUM RANKING OF THE DOW 30 STOCKS (Ranked Daily)
DOW 30 momentum ranking follows:
 
The top ranked Stock receives 100%. The rest are then ranked based on their momentum relative to the leading Stock.
For more details, see NTSM Page at…
https://navigatethestockmarket.blogspot.com/p/a-system-for-trading-dow-30-stocks-my_8.html
 
THURSDAY MARKET INTERNALS (NYSE DATA)
My basket of Market Internals remained BUY.
(My basket of Market Internals is a decent trend-following analysis of current market action, but should not be used alone for short term trading. They are most useful when they diverge from the Index.) 
 
...My current invested position is about 75% stocks, including stock mutual funds and ETFs. I’m usually about 50% invested in stocks. I’ll cut back some now to reduce risk.
 
I trade about 15-20% of the total portfolio using the momentum-based analysis I provide here. If I can see a definitive bottom, I’ll add a lot more stocks to the portfolio using an S&P 500 ETF.