“Trade what you see; not what you think.” – The Old Fool, Richard McCranie, trader extraordinaire.
“The S&P Global US Manufacturing PMI fell to 46.3 in June 2023, pointing to the biggest contraction in the manufacturing sector since December, compared to 48.4 in May...” Story at...
https://tradingeconomics.com/united-states/manufacturing-pmi
“... The S&P Global US Services PMI edged down to 54.1 in June 2023 from 54.9 in May...” Story at...
https://tradingeconomics.com/united-states/services-pmi
-Friday the S&P 500 dropped about 0.8% to 4348.
-VIX rose about 4% to 13.44.
-The yield on the 10-year Treasury dipped to 3.740%.
-Drop from Top: 9.3%. 25.4% max (on a closing basis).
-Trading Days since Top: 368-days.
The S&P 500 is 8.9% ABOVE its 200-dMA and 3.5% ABOVE its 50-dMA.
*I won’t call the correction over until the S&P 500 makes a new-high; however, evidence suggests the bottom was in the 3600 area and we called a buy on 4 October 2022.
I am not trading as much as in the past. You may wish to use the momentum charts and/or the Monday 40-day gain charts for trading the Dow stocks and ETFs.
XLK – Technology ETF.
XLY - Consumer Discretionary ETF.
I’ll probably sell this position Friday – it has been very weak recently. But I forgot to! In my defense - it is a small position.
Volume was extreme today as the Russell rebalanced their indices.
The catch is that since this is likely to be a small correction, indicators will probably not be able to give me a timely Buy-signal. I'll probably start buying near the 50-dMA.
Here’s my weekly review of indicators:
The weekly rundown of indicators shifted to the Bear side (now 13-bear and 8-bull). (These indicators tend to be both long-term and short-term, so they are different than the 20 that I report on daily.)
While the Friday summary of indicators is now well to the Bear side, some of the bull indicators are reasonably reliable. This tends to bolster the view that the
current pullback is likely to be small. Based on today's numbers, the markets do not appear to be
starting a major correction, so I’ll stick with my suggestion that the S&P
500 is most likely to decline about 3-4% below today’s close.
BULL SIGNS
-Long-term new-high/new-low data.
-The long-term, 50-dEMA, Fosback Hi-Low Logic Index.
-Slope of the 40-dMA of New-highs is rising.
-On average, the size of up-moves has been larger than the size of down-moves over the last month.
-VIX indicator.
-The 5-10-20 Timer System is BUY.
-The 5-day EMA is above the 10-day EMA so short-term momentum is bullish.
-S&P 500 spread vs. Utilities (XLU-ETF) shows the Index outpacing Utilities.
NEUTRAL
-There have been 3 Distribution Days since the Follow-thru day on 2 June.
-There have been 3 Statistically-Significant days (big moves in price-volume) in the last 15-days.
-Sentiment.
-Bollinger Band Squeeze 28 April - expired.
-Bollinger Bands.
-The 50-dMA percentage of issues advancing on the NYSE (Breadth) has not been below 50%, for more than 3 days in a row.
-Overbought/Oversold Index (Advance/Decline Ratio).
-There was a Zweig Breadth Thrust 31 March. That’s a rare, very-bullish sign, but the McClellan Oscillator subsequently turned negative, so this indicator has expired.
-The S&P 500 is 8.9% above its 200-dMA. (Bear indicator is 12% above the 200-day.) It was 11.1% above the 200-day last week.
-MACD of S&P 500 price made a bullish crossover 26 May, but it has been falling and is now very close to a bearish crossover. Call it neutral.
-The short-term, 10-day EMA, Fosback Hi-Low Logic Index is neutral.
-There have been 6 up-days over the last 10 sessions – neutral.
-There have been 13 up-days over the last 20 sessions - neutral.
-RSI
-There was a 90% down-volume day 9 March.
-There was a Hindenburg Omen signal 3 May 2023. The McClellan Oscillator turned positive 18 May. – Expired.
-The Calm-before-the-Storm/Panic Indicator flashed a panic-buying signal 10 November - expired.
-2.8% of all issues traded on the NYSE made new, 52-week highs when the S&P 500 made a new all-time-high, 3 January 2022. (There is no bullish signal for this indicator.) This indicated that the advance was too narrow and a correction was likely to be >10%. It proved correct, but is now Expired.
-10 May there was a Bullish Outside Reversal Day – Expired.
BEAR SIGNS
-The smoothed advancing volume on the NYSE is falling.
-The 10-dMA percentage of issues advancing on the NYSE (Breadth) is below 50%.
-The 50-dMA percentage of issues advancing on the NYSE (Breadth) is below 50%.
-The 100-dMA percentage of issues advancing on the NYSE (Breadth) is below 50%.
-Issues advancing on the NYSE (Breadth) compared to the S&P 500. The Index is too far ahead of Breadth.
-Smoothed Buying Pressure minus Selling Pressure is falling.
-My Money Trend indicator is falling sharply.
-Short-term new-high/new-low data.
-McClellan Oscillator.
-The graph of the 100-day Count (the 100-day sum of up-days) is down.
-XLI-ETF (Cyclical Industrials) is underperforming the S&P 500 and the trend direction is down.
-The Smart Money (late-day action).
-42% of the 15-ETFs that I track have been up over the last 10-days.
On Friday, 21 February, 2 days after the top before the
Coronavirus pullback, there were 10 bear-signs and 1 bull-sign. Now there
are 13 bear-signs and 8-Bull. Last week, there were 8 bear-sign and 15
bull-signs.
The daily spread of 20 Indicators (Bulls minus Bears) declined
from -6 to -8 (a positive number is bullish; negatives are bearish); the 10-day
smoothed sum that smooths the daily fluctuations declined from +30 to +14.
(The trend direction is more important than the actual number for the 10-day
value.) These numbers sometimes change after I post the blog based on data that
comes in late. Most of these 20 indicators are short-term so they tend to
bounce around a lot.
LONG-TERM INDICATOR: The Long Term NTSM indicator remained
BUY: PRICE & VIX are positive; SENTIMENT & VOLUME are neutral. The
indicator can signal a “Buy” at the top. It is designed to call a buy when
conditions become good at a bottom; but conditions are good at tops too. I think
that we’ll see a better time to buy in the next several weeks.
(The important BUY in this indicator was on 21 October,
7-days after the bottom. For my NTSM overall signal, I suggested that a
short-term buying opportunity occurred on 27 September (based on improved
market internals on the retest), although without market follow-thru, I was
unwilling to call a buy; however, I did close shorts and increased stock
holdings. I issued a Buy-Signal on 4 October, 6-days before the final bottom,
based on stronger market action that confirmed the market internals signal. The
NTSM sell-signal was issued 20 December, 8 sessions before the high of this
recent bear market, based on the bearish “Friday Rundown” of indicators.)
Bottom line: I remain a cautious Bull, expecting a decline
of another 3-4% on the S&P 500.
ETF - MOMENTUM ANALYSIS:
TODAY’S RANKING OF 15 ETFs (Ranked Daily)
ETF ranking follows:

The top ranked ETF receives 100%. The rest are then ranked based on their momentum relative to the leading ETF.
*For additional background on the ETF ranking system see NTSM Page at…
http://navigatethestockmarket.blogspot.com/p/exchange-traded-funds-etf-ranking.html
DOW STOCKS - TODAY’S MOMENTUM RANKING
OF THE DOW 30 STOCKS (Ranked Daily)
DOW 30 momentum ranking follows:
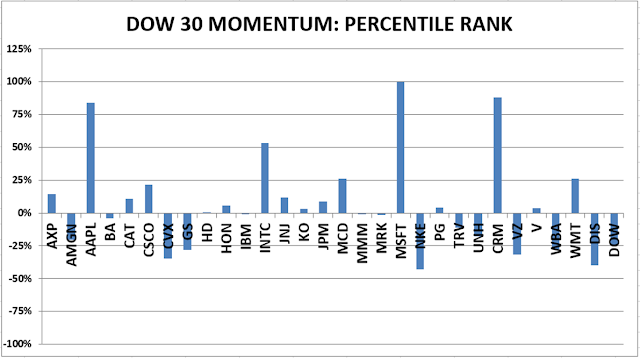
The top ranked Stock receives
100%. The rest are then ranked based on their momentum relative to the leading Stock.
For more details, see NTSM Page at…
https://navigatethestockmarket.blogspot.com/p/a-system-for-trading-dow-30-stocks-my_8.html
FRIDAY MARKET INTERNALS (NYSE
DATA)
 My basket of Market Internals remained SELL. (My basket of Market Internals
is a decent trend-following analysis of current market action, but should not
be used alone for short term trading. They are most useful when they diverge
from the Index.)
My basket of Market Internals remained SELL. (My basket of Market Internals
is a decent trend-following analysis of current market action, but should not
be used alone for short term trading. They are most useful when they diverge
from the Index.)
The weekly rundown of indicators shifted to the Bear side (now 13-bear and 8-bull). (These indicators tend to be both long-term and short-term, so they are different than the 20 that I report on daily.)
-Long-term new-high/new-low data.
-The long-term, 50-dEMA, Fosback Hi-Low Logic Index.
-Slope of the 40-dMA of New-highs is rising.
-On average, the size of up-moves has been larger than the size of down-moves over the last month.
-VIX indicator.
-The 5-10-20 Timer System is BUY.
-The 5-day EMA is above the 10-day EMA so short-term momentum is bullish.
-S&P 500 spread vs. Utilities (XLU-ETF) shows the Index outpacing Utilities.
-There have been 3 Distribution Days since the Follow-thru day on 2 June.
-There have been 3 Statistically-Significant days (big moves in price-volume) in the last 15-days.
-Sentiment.
-Bollinger Band Squeeze 28 April - expired.
-Bollinger Bands.
-The 50-dMA percentage of issues advancing on the NYSE (Breadth) has not been below 50%, for more than 3 days in a row.
-Overbought/Oversold Index (Advance/Decline Ratio).
-There was a Zweig Breadth Thrust 31 March. That’s a rare, very-bullish sign, but the McClellan Oscillator subsequently turned negative, so this indicator has expired.
-The S&P 500 is 8.9% above its 200-dMA. (Bear indicator is 12% above the 200-day.) It was 11.1% above the 200-day last week.
-MACD of S&P 500 price made a bullish crossover 26 May, but it has been falling and is now very close to a bearish crossover. Call it neutral.
-The short-term, 10-day EMA, Fosback Hi-Low Logic Index is neutral.
-There have been 6 up-days over the last 10 sessions – neutral.
-There have been 13 up-days over the last 20 sessions - neutral.
-RSI
-There was a 90% down-volume day 9 March.
-There was a Hindenburg Omen signal 3 May 2023. The McClellan Oscillator turned positive 18 May. – Expired.
-The Calm-before-the-Storm/Panic Indicator flashed a panic-buying signal 10 November - expired.
-2.8% of all issues traded on the NYSE made new, 52-week highs when the S&P 500 made a new all-time-high, 3 January 2022. (There is no bullish signal for this indicator.) This indicated that the advance was too narrow and a correction was likely to be >10%. It proved correct, but is now Expired.
-10 May there was a Bullish Outside Reversal Day – Expired.
-The smoothed advancing volume on the NYSE is falling.
-The 10-dMA percentage of issues advancing on the NYSE (Breadth) is below 50%.
-The 50-dMA percentage of issues advancing on the NYSE (Breadth) is below 50%.
-The 100-dMA percentage of issues advancing on the NYSE (Breadth) is below 50%.
-Issues advancing on the NYSE (Breadth) compared to the S&P 500. The Index is too far ahead of Breadth.
-Smoothed Buying Pressure minus Selling Pressure is falling.
-My Money Trend indicator is falling sharply.
-Short-term new-high/new-low data.
-McClellan Oscillator.
-The graph of the 100-day Count (the 100-day sum of up-days) is down.
-XLI-ETF (Cyclical Industrials) is underperforming the S&P 500 and the trend direction is down.
-The Smart Money (late-day action).
-42% of the 15-ETFs that I track have been up over the last 10-days.
TODAY’S RANKING OF 15 ETFs (Ranked Daily)
ETF ranking follows:
The top ranked ETF receives 100%. The rest are then ranked based on their momentum relative to the leading ETF.
*For additional background on the ETF ranking system see NTSM Page at…
http://navigatethestockmarket.blogspot.com/p/exchange-traded-funds-etf-ranking.html
DOW 30 momentum ranking follows:
For more details, see NTSM Page at…
https://navigatethestockmarket.blogspot.com/p/a-system-for-trading-dow-30-stocks-my_8.html