Thursday, October 31, 2024

Jobless Claims ... Momentum Trading DOW Stocks & ETFs … Stock Market Analysis ...

 
“I know not with what weapons World War III will be fought, but World War IV will be fought with sticks and stones.” - Albert Einstein

“Trade what you see; not what you think.” – The Old Fool, Richard McCranie, trader extraordinaire.
 
“Far more money has been lost by investors in preparing for corrections, or anticipating corrections, than has been lost in the corrections themselves.” - Peter Lynch, former manager of Fidelity’s Magellan® fund.
Political commentary from Michael Ramirez at...
https://michaelpramirez.com/index.html#/
 
“In perhaps seven states, a voter might conceivably feel an obligation to vote because the outcome is in doubt. To the rest, I say: relax. We’ve been bludgeoned unconscionably but the election isn’t existential. To conservatives, it’s a pretty good year. Kamala Harris is their best possible Democrat—no apparent leadership gene, elevated by accident, dependent on reflexive and droning support from progressives whom 95% of America don’t identify with.
There are many paths to a revived conservative agenda, including tying up President Harris in knots while getting the next GOP generation ready.” -  Holman W. Jenkins, Jr.. member of the editorial board of The Wall Street Journal. Opinion at...
https://www.wsj.com/opinion/conservatives-can-be-optimists-2024-presidential-election-10558c74
 
JOBLESS CLAIMS / PCE PRICE (Yahoo Finance)
“The number of Americans filing new applications for unemployment benefits fell to a five-month low last week and consumer spending increased more than expected in September, showcasing the economy's strength heading into the final stretch of 2024... Though prices pushed higher last month, inflation is firmly on a downward trend, with other data on Thursday showing labor costs posting their smallest gain in more than three years in the third quarter... Initial claims for state unemployment benefits dropped 12,000 to a seasonally adjusted 216,000 for the week ended Oct. 26...” tory at... 
https://finance.yahoo.com/news/us-weekly-jobless-claims-fall-123827119.html
 
MARKET REPORT / ANALYSIS
-Thursday the S&P 500 declined about 1.9% to 5705.
-VIX jumped about 14% to 23.16.  
-The yield on the 10-year Treasury slipped (compared to about this time, prior trading day) to 4.282%.
 
MY TRADING POSITIONS:
XLK – Holding since the October 2022 lows.  Added more 9/20.
SSO – added 10/16.
SPY – added 9/19 & more 10/16
 
CURRENT SUMMARY OF APPROXIMATELY 50 INDICATORS:
Today, of the 50-Indicators I track, 16 gave Bear-signs and 5 were Bullish. The rest are neutral. (It is normal to have a lot of neutral indicators since many of the indicators are top or bottom indicators that will signal only at extremes.)

The daily Bull/Bear, 50-Indicator spread (Bull Indicators minus Bear Indicators, red curve in the chart above) declined to -11 (11 more Bear indicators and Bull indicators).
 
TODAY’S COMMENT:
Today’s Bull-Bear spread of -11 is bearish. The 10-dMA of the 50-Indicator Spread (purple line in the chart above) remained bearish since it is still moving lower. (I follow the 10-dMA for trading buy-signals and as an indicator for sell signals.)
 
Thursday there was a Hindenburg Omen signal. Investopedia says, “The Hindenburg Omen is a technical indicator that was designed to signal the increased probability of a stock market crash. It compares the percentage of new 52-week highs and new 52-week lows in stock prices to a predetermined reference percentage that is supposed to predict the increasing likelihood of a market crash... The Hindenburg Omen looks for a statistical deviation from the premise that under normal conditions, some stocks are either making new 52-week highs or new 52-week lows. It would be abnormal if both were occurring at the same time.” From Investopedia at...
https://www.investopedia.com/terms/h/hindenburgomen.asp
As we’ve noted before, the Omen sends a lot of false warnings.
 
The Fosback New-high/new-low Logic indicator uses a similar analytic approach, but it is closer to buy than sell, so I won’t get too worried about the Hindenburg signal.  
 
I do statistical analysis of daily moves on the S&P 500.  That was the indicator that gave us the “Top within 20-days” warning because the market moves were too subdued showing an unnatural calm.  That calm broke today with a panic indicator. The Panic Indicator can be a positive or negative indicator. At a top it is a bear sign; at a bottom it is a bull sign.  Now, the S&P 500 has fallen to its 50-dMA, so I consider this indicator bullish. Unfortunately, it is one of only 5 bull-signs today. If the Index continues to fall, I’ll be forced to re-evaluate and switch this indicator to bearish. And speaking of statistical analysis...
 
Thursday was a statistically-significant. down-day. That just means that the price-volume move exceeded my statistical parameters. Statistics show that a statistically-significant, down-day is followed by an up-day about 60% of the time. 
 
The S&P 500 closed only slightly higher than its 50-dMA and that may be enough to put an end to the weakness.
 
BOTTOM LINE
I’m neutral on the markets, even though the indicators are bearish. I suspect that the weakness is close to finished. That’s not a well-informed opinion – there’s not much evidence yet, other than the chart and a couple of statistical indicators. We may have to wait until the election is over before the market get’s out of its funk.
 
ETF - MOMENTUM ANALYSIS:
TODAY’S RANKING OF 15 ETFs (Ranked Daily) ETF ranking follows:
 

The top ranked ETF receives 100%. The rest are then ranked based on their momentum relative to the leading ETF.
*For additional background on the ETF ranking system see NTSM Page at…
http://navigatethestockmarket.blogspot.com/p/exchange-traded-funds-etf-ranking.html
 
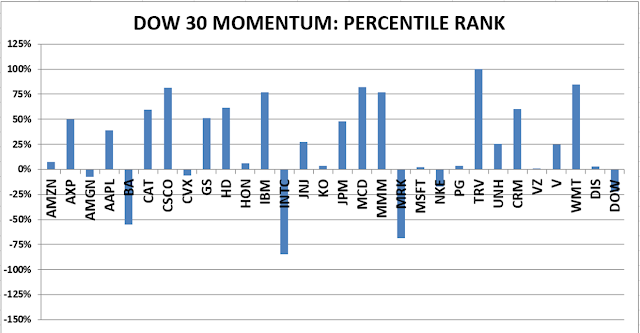
DOW STOCKS - TODAY’S MOMENTUM RANKING OF THE DOW 30 STOCKS (Ranked Daily)
 

The top ranked Stock receives 100%. The rest are then ranked based on their momentum relative to the leading Stock.
For more details, see NTSM Page at…
https://navigatethestockmarket.blogspot.com/p/a-system-for-trading-dow-30-stocks-my_8.html
 
THURSDAY MARKET INTERNALS (NYSE DATA)
My basket of Market Internals remained SELL.
(My basket of Market Internals is a decent trend-following analysis that is most useful when it diverges from the Index.) 


...My current invested position is about 60% stocks, including stock mutual funds and ETFs. I’m usually about 50% invested in stocks when markets are stretched. (75% is my max stock allocation when I am confident that markets will continue higher.)
 
I trade about 15-20% of the total portfolio using the momentum-based analysis I provide here. When I see bullish signs, I add a lot more stocks to the portfolio, usually by using an S&P 500 ETF as I did back in October 2022 and 2023.
 

Wednesday, October 30, 2024

ADP Employment ... GDP ... PCE ... Momentum Trading DOW Stocks & ETFs … Stock Market Analysis ...

“I know not with what weapons World War III will be fought, but World War IV will be fought with sticks and stones.” - Albert Einstein

“Trade what you see; not what you think.” – The Old Fool, Richard McCranie, trader extraordinaire.
 
“Far more money has been lost by investors in preparing for corrections, or anticipating corrections, than has been lost in the corrections themselves.” - Peter Lynch, former manager of Fidelity’s Magellan® fund.
 
“It is clear we need to fundamentally change our strategy to win back customers... We have a clear plan and are moving quickly to return Starbucks to growth.” - Brian Niccol Starbucks CEO.
My cmt: I think they need to fundamentally make better coffee. We have been disappointed in the quality and consistency of their offerings recently.
 
“Both of the candidates worry me. This left, right and fighting each other is a problem as it becomes more of the extremes. I think there needs to be a bringing of Americans together, that middle of that, and making great reforms... There needs to be a strong leader of the middle, I believe, that makes great reforms... Neither of the candidates does that for me.” – Ray Dalio, Chief investment officer of Bridgewater Associates
 
“I’m under the age of 80, I speak in complete sentences, I’m not a convicted felon...It’s a very low bar, but I’ve managed to clear that.” - Chase Oliver, Libertarian candidate for President.
 
SUPREME COURT FUTURE IS ON THE BALLOT (WSJ)
“Would Kamala Harris support packing the Supreme Court by adding, say, three Justices? She was asked that in a CNN town hall last week, and what a chance to present herself as a safe pair of hands... [Her answer]...
...“The American people increasingly are losing confidence in the Supreme Court, in large part because of the behavior of certain members of that Court and because of certain rulings... So I do believe that there should be some kind of reform of the Court, and we can study what that actually looks like.” There you have it. Ms. Harris has already endorsed President Biden’s plan to impose “ethics” rules on the Justices that would invite political harassment and compromise judicial independence. Now she won’t disavow packing the Court. She has called for Democrats, if they keep the Senate in November, to bypass the 60-vote filibuster rule, letting them enact such bills without even a modicum of compromise...
... If Ms. Harris wins next week, while Democrats hang on to 50 Senate seats, they have promised progressive voters they’ll take a wrecking ball to the current Supreme Court. It used to be a fringe position to propose fundamental “reform” of the Court, but Mr. Biden has embraced it, Ms. Harris has endorsed it, and the Senate Judiciary Committee has passed it.
Democrats are serious. They say Mr. Trump is a threat to democracy and U.S. institutions, while they’re pledging to restructure the judiciary wholesale. Do they notice the cognitive dissonance? Apparently not. But voters might.” – The Editorial Board, WSJ. Opinion at...
https://www.wsj.com/opinion/the-supreme-courts-future-is-on-the-ballot-harris-packing-reform-65de837f
 
GDP / PCE (CNBC)
“The U.S. economy posted another solid though slightly disappointing period of growth in the third quarter, propelled higher by strong consumer spending that has defied expectations for a slowdown.
Gross domestic product, a measure of all the goods and services produced during the three-month period from July through September, increased at a 2.8% annualized rate... Personal consumption expenditures, the proxy for consumer activity, increased 3.7% for the quarter, the strongest performance since Q1 of 2023, contributing nearly 2.5 percentage points to the total.” Story at...
https://www.cnbc.com/2024/10/30/us-gdp-q3-2024.html
 
ADP EMPLOYMENT (ADP via prnewswire)
“Private sector employment increased by 233,000 jobs in October and annual pay was up 4.6 percent year-over-year, according to the October ADP® National Employment Report™ produced by ADP Research in collaboration with the Stanford Digital Economy Lab ("Stanford Lab").. "Even amid hurricane recovery, job growth was strong in October," said Nela Richardson, chief economist, ADP. "As we round out the year, hiring in the U.S. is proving to be robust and broadly resilient." Press release at...
https://www.prnewswire.com/news-releases/adp-national-employment-report-private-sector-employment-increased-by-233-000-jobs-in-october-annual-pay-was-up-4-6-302291459.html
 
MARKET REPORT / ANALYSIS
-Wednesday the S&P 500 declined about 0.3% to 5814.
-VIX rose about 5% to 20.35.  
-The yield on the 10-year Treasury rose (compared to about this time, prior trading day) to 4.30%.
 
MY TRADING POSITIONS:
XLK – Holding since the October 2022 lows.  Added more 9/20.
QLD – added 7/24.
SSO – added 10/16.
SPY – added 9/19 & more 10/16
 
CURRENT SUMMARY OF APPROXIMATELY 50 INDICATORS:
Today, of the 50-Indicators I track, 15 gave Bear-signs and 7 were Bullish. The rest are neutral. (It is normal to have a lot of neutral indicators since many of the indicators are top or bottom indicators that will signal only at extremes.)

The daily Bull/Bear, 50-Indicator spread (Bull Indicators minus Bear Indicators, red curve in the chart above) declined to -8 (8 more Bear indicators and Bull indicators).
 
TODAY’S COMMENT:
Today’s Bull-Bear spread of -8 is bearish. The 10-dMA of the 50-Indicator Spread (purple line in the chart above) remained bearish since it is still moving lower. (I follow the 10-dMA for trading buy-signals and as an indicator for sell signals.) This is slightly worse than the spread I saw today at 2pm, because internals declined late in the day and created another bear sign. Indicators remain under stress.
 
I sold my leveraged position in QLD (2x Nasdaq 100) today. With indicators falling, it makes sense to cut some risk until the uncertainty is resolved.
 
The 50-dMA is about 2% lower than today’s close and that’s a strong level of support. I still don’t expect to see a big drop when it does happen assuming we see a decline fairly soon.
 
Who knows, with Consumer confidence rising, we might even see a pre-election bounce higher.
 
BOTTOM LINE
I’m neutral on the markets. If the pullback resumes, the drop should be small. While indicators have been falling, the S&P 500 has drifted higher and is now only 0.9% below its all-time high.
 
ETF - MOMENTUM ANALYSIS:
TODAY’S RANKING OF 15 ETFs (Ranked Daily) ETF ranking follows:
 

The top ranked ETF receives 100%. The rest are then ranked based on their momentum relative to the leading ETF.
*For additional background on the ETF ranking system see NTSM Page at…
http://navigatethestockmarket.blogspot.com/p/exchange-traded-funds-etf-ranking.html
 
DOW STOCKS - TODAY’S MOMENTUM RANKING OF THE DOW 30 STOCKS (Ranked Daily)
 

The top ranked Stock receives 100%. The rest are then ranked based on their momentum relative to the leading Stock.
For more details, see NTSM Page at…
https://navigatethestockmarket.blogspot.com/p/a-system-for-trading-dow-30-stocks-my_8.html
 
WEDNESDAY MARKET INTERNALS (NYSE DATA)
My basket of Market Internals remained SELL.
(My basket of Market Internals is a decent trend-following analysis that is most useful when it diverges from the Index.) 


...My current invested position is about 60% stocks, including stock mutual funds and ETFs. I’m usually about 50% invested in stocks when markets are stretched. (75% is my max stock allocation when I am confident that markets will continue higher.)
 
I trade about 15-20% of the total portfolio using the momentum-based analysis I provide here. When I see bullish signs, I add a lot more stocks to the portfolio, usually by using an S&P 500 ETF as I did back in October 2022 and 2023.
 

Selling QLD

I sold QLD (2x Nasdaq 100) today.  Indicators keep drifting down.  I don't like to be overinvested in leveraged positions when indicators are declining. As of 2pm, I had 14 Bear-signs and 7 Bull-signs. It's not time to panic; I'm just cutting risk.

Tuesday, October 29, 2024

Consumer Confidence ... Dallas FED Services ... Momentum Trading DOW Stocks & ETFs … Stock Market Analysis ...

 
Busy day – I’ll have to be quick.
 
“Trade what you see; not what you think.” – The Old Fool, Richard McCranie, trader extraordinaire.
 
“Far more money has been lost by investors in preparing for corrections, or anticipating corrections, than has been lost in the corrections themselves.” - Peter Lynch, former manager of Fidelity’s Magellan® fund.
 

CONSUMER CONFIDENCE (Conference Board)
“Consumer confidence recorded the strongest monthly gain since March 2021, but still did not break free of the narrow range that has prevailed over the past two years,” said Dana M. Peterson, Chief Economist at The Conference Board. “In October’s reading, all five components of the Index improved... October’s increase in confidence was broad-based across all age groups and most income groups.” Press release at...
https://www.conference-board.org/topics/consumer-confidence
 
DALLAS FED SERVICES (Dallas FED)
“Texas service sector activity growth continues, outlook improves. Texas service sector activity expanded at about the same pace in October as the prior month, according to business executives responding to the Texas Service Sector Outlook Survey. The revenue index, a key measure of state service sector conditions, was little changed at 9.2.” Report at...
https://www.dallasfed.org/
 
MARKET REPORT / ANALYSIS
-Tuesday the S&P 500 rose about 0.2% to 5833.
-VIX declined about 2% to 19.34.  
-The yield on the 10-year Treasury declined (compared to about this time, prior trading day) to 4.256%.
 
MY TRADING POSITIONS:
XLK – Holding since the October 2022 lows.  Added more 9/20.
QLD – added 7/24.
SSO – added 10/16.
SPY – added 9/19 & more 10/16
 
CURRENT SUMMARY OF APPROXIMATELY 50 INDICATORS:
Today, of the 50-Indicators I track, 13 gave Bear-signs and 8 were Bullish. The rest are neutral. (It is normal to have a lot of neutral indicators since many of the indicators are top or bottom indicators that will signal only at extremes.)

The daily Bull/Bear, 50-Indicator spread (Bull Indicators minus Bear Indicators, red curve in the chart above) declined to -5 (5 more Bear indicators and Bull indicators).
 
TODAY’S COMMENT:
Today’s Bull-Bear spread of -5 is bearish. The 10-dMA of the 50-Indicator Spread (purple line in the chart above) remained bearish since it is still moving lower. (I follow the 10-dMA for trading buy-signals and as an indicator for sell signals.)
 
Indicators remain under stress. I’m beginning to wonder if we’ll see a quick drop.  I still don’t expect a big drop, but the S&P 500 has been treading water to moving slightly higher while internals have been deteriorating and a quick fall is not out of the question.
 
Indicators are suggesting that the decline may resume, but signals are not particularly strong and that call has not been proven correct so far.
 
The 50-dMA is about 2-1/2% lower than today’s close and that’s a strong level of support. I don’t expect to see a big drop when it does happen assuming we see a decline fairly soon.
 
Before I get too bearish I need to note there was a new bullish sign today.  Tuesday there was a Bullish Outside Reversal Day.
“Outside reversal is a price chart pattern in investing that occurs when an asset’s high and low prices for the day exceed the high and low prices of the previous day. It is also known as a bullish or bearish engulfing pattern. It can indicate a change in market trend and provide a trading signal to investors.” From...
https://due.com/terms/outside-reversal/
 
Who knows, with Consumer confidence rising, we might even see a pre-election bounce higher.
 
BOTTOM LINE
I’m neutral on the markets. If the pullback resumes, the drop should be small.
 
ETF - MOMENTUM ANALYSIS:
TODAY’S RANKING OF 15 ETFs (Ranked Daily) ETF ranking follows:
 

The top ranked ETF receives 100%. The rest are then ranked based on their momentum relative to the leading ETF.
*For additional background on the ETF ranking system see NTSM Page at…
http://navigatethestockmarket.blogspot.com/p/exchange-traded-funds-etf-ranking.html
 
DOW STOCKS - TODAY’S MOMENTUM RANKING OF THE DOW 30 STOCKS (Ranked Daily)
 

The top ranked Stock receives 100%. The rest are then ranked based on their momentum relative to the leading Stock.
For more details, see NTSM Page at…
https://navigatethestockmarket.blogspot.com/p/a-system-for-trading-dow-30-stocks-my_8.html
 
TUESDAY MARKET INTERNALS (NYSE DATA)
My basket of Market Internals has been bouncing back and forth, but today it declined to SELL.
(My basket of Market Internals is a decent trend-following analysis that is most useful when it diverges from the Index.) 


...My current invested position is about 65% stocks, including stock mutual funds and ETFs. I’m usually about 50% invested in stocks when markets are stretched. (75% is my max stock allocation when I am confident that markets will continue higher.)
 
I trade about 15-20% of the total portfolio using the momentum-based analysis I provide here. When I see bullish signs, I add a lot more stocks to the portfolio, usually by using an S&P 500 ETF as I did back in October 2022 and 2023.

Monday, October 28, 2024

Dallas FED Manufacturing ... Momentum Trading DOW Stocks & ETFs … Stock Market Analysis

 
“Trade what you see; not what you think.” – The Old Fool, Richard McCranie, trader extraordinaire.
 
“Far more money has been lost by investors in preparing for corrections, or anticipating corrections, than has been lost in the corrections themselves.” - Peter Lynch, former manager of Fidelity’s Magellan® fund.

BIDEN SNUBS THE COURTS AGAIN ON STUDENT LOAN FOREGIVENESS (WSJ)
“‘That didn’t stop me,’ President Biden declared after the Supreme Court blocked his $430 billion student loan write-off in 2023. It sure didn’t. After striking out in court with three debt forgiveness schemes, the Administration on Friday unveiled another. Take that, judges. The Education Department says its proposed rule would authorize forgiveness for some eight million borrowers experiencing ‘hardship.’ ... Courts are playing whack-a-mole with the Administration’s debt write-offs that end-run Congress, which never authorized such broad-based debt forgiveness. Such lawlessness is one reason so many Americans discount the left’s assertions that Donald Trump endangers democracy. Mr. Biden acts like he’s king, and Democrats and media voices cheering him on have no standing to object if Mr. Trump follows the Biden precedent.” - The Editorial Board, WSJ. Opinion at...
https://www.wsj.com/opinion/biden-student-loan-forgiveness-supreme-court-education-department-7af30892
 
RUSSIA MAKES FAKE ELECTION VIDEO (LA Times)
“Russian actors were behind a widely circulated video falsely depicting mail-in ballots for Donald Trump being destroyed in Pennsylvania, U.S. officials confirmed Friday. The video had taken off on social media Thursday but was debunked within three hours by local election officials and law enforcement after members of the public reported it...the video’s detailed mimicking of ballots in a key county in this year's presidential race was a wake-up call that demonstrated how committed foreign actors are to undermining faith in the U.S. voting process in the critical stretch before voting concludes.” Story at...
Russian actors made fake video depicting mail-in ballots for Trump being destroyed, FBI says
 
ELECTRICITY IS CHEAPER THAN GAS? (MSN)
“The Biden-Harris administration has made a crackdown on residential fossil fuel consumption a key aspect of its environmental strategy, justifying the push in part on the grounds electrification will lower energy costs. Now, Oct. 17 residential energy price data from the Department of Energy (DOE) shows electricity was roughly four times as expensive as natural gas in 2024, with experts telling the DCNF the White House’s electrification push is an example of extremist climate policy hurting everyday Americans.
“The Department of Energy has consistently shown that natural gas is a much cheaper energy source for households than electricity,” Daren Bakst, director of the Competitive Enterprise Institute’s Center for Energy and Environment, told the DCNF [Daily Caller news Foundation]. “Government policies trying to block the use of natural gas in favor of electricity will significantly drive up prices, making home heating and appliance use needlessly expensive. The poor will get hurt the most because, compared to higher income households, they spend a greater share of their household income on meeting basic needs such as staying warm in the winter.” Story at...
‘Climate Extremism’: Biden-Harris Admin’s Own Data Undermines Its Fav Selling Point In Push To ‘Electrify Everything’
 
DALLAS FED MANUFACTURING (Dallas Fed)
“Texas factory activity rose notably in October, according to business executives responding to the Texas Manufacturing Outlook Survey. The production index, a key measure of state manufacturing conditions, shot up 18 points to 14.6, its highest reading in more than two years.” Report at...
https://www.dallasfed.org/research/surveys/tmos/2024/2410
 
MARKET REPORT / ANALYSIS
-Monday the S&P 500 rose about 0.3% to 5824.
-VIX declined about 3% to 19.8.  
-The yield on the 10-year Treasury rose (compared to about this time, prior trading day) to 4.282%.
 
MY TRADING POSITIONS:
XLK – Holding since the October 2022 lows.  Added more 9/20.
QLD – added 7/24.
SSO – added 10/16.
SPY – added 9/19 & more 10/16
 
CURRENT SUMMARY OF APPROXIMATELY 50 INDICATORS:
Today, of the 50-Indicators I track, 12 gave Bear-signs and 8 were Bullish. The rest are neutral. (It is normal to have a lot of neutral indicators since many of the indicators are top or bottom indicators that will signal only at extremes.)

The daily Bull/Bear, 50-Indicator spread (Bull Indicators minus Bear Indicators, red curve in the chart above) declined to -4 (4 more Bear indicators and Bull indicators).
 
TODAY’S COMMENT:
Today’s Bull-Bear spread of -4 is slightly bearish to neutral. The 10-dMA of the 50-Indicator Spread (purple line in the chart above) remained bearish since it is still moving lower. (I follow the 10-dMA for trading buy-signals and as an indicator for sell signals.)
 
Indicators continue to slowly decline. I didn’t cut my stocks by much, but I did sell my leveraged position in UWM. I am sitting on that cash until the 10-dMA of the 50-Indicator, Bull-Bear spread turns higher.   
 
Indicators are suggesting that the decline may resume, but signals are not particularly strong. If the markets do turn down, I don’t expect much of a drop.
 
The 50-dMA is a little more than 2% lower than today’s close.
 
BOTTOM LINE
I’m neutral on the markets. If the pullback resumes, the drop should be small.
 
ETF - MOMENTUM ANALYSIS:
TODAY’S RANKING OF 15 ETFs (Ranked Daily) ETF ranking follows:
 

The top ranked ETF receives 100%. The rest are then ranked based on their momentum relative to the leading ETF.
*For additional background on the ETF ranking system see NTSM Page at…
http://navigatethestockmarket.blogspot.com/p/exchange-traded-funds-etf-ranking.html

DOW STOCKS - TODAY’S MOMENTUM RANKING OF THE DOW 30 STOCKS (Ranked Daily)
 

The top ranked Stock receives 100%. The rest are then ranked based on their momentum relative to the leading Stock.
For more details, see NTSM Page at…
https://navigatethestockmarket.blogspot.com/p/a-system-for-trading-dow-30-stocks-my_8.html

MONDAY MARKET INTERNALS (NYSE DATA)
My basket of Market Internals improved to HOLD.
(My basket of Market Internals is a decent trend-following analysis that is most useful when it diverges from the Index.) 


...My current invested position is about 65% stocks, including stock mutual funds and ETFs. I’m usually about 50% invested in stocks when markets are stretched. (75% is my max stock allocation when I am confident that markets will continue higher.)
 
I trade about 15-20% of the total portfolio using the momentum-based analysis I provide here. When I see bullish signs, I add a lot more stocks to the portfolio, usually by using an S&P 500 ETF as I did back in October 2022 and 2023.

Friday, October 25, 2024

Durable Goods ... Momentum Trading DOW Stocks & ETFs … Stock Market Analysis ...

 
“Trade what you see; not what you think.” – The Old Fool, Richard McCranie, trader extraordinaire.
 
“Far more money has been lost by investors in preparing for corrections, or anticipating corrections, than has been lost in the corrections themselves.” - Peter Lynch, former manager of Fidelity’s Magellan® fund.
 
HARRIS NOT TALKING ABOUT CLMATE CHANGE (WSJ)
“In an election characterized by bitter clashes, it’s notable that one typically divisive topic has gone almost unmentioned: climate change... As climate policy turns from distant, grandiose promises of future carbon cuts into the very real prospect of present-day energy price hikes, U.S. voters are asking whether it’s worth it. This is the first presidential election in which the economic consequences of green ideals have become real with less reliable power and higher total energy costs... The truth of the matter is that nothing Ms. Harris does to cut carbon can stop climate change. It’s developing nations that are driving emissions in this century. Even if the U.S. achieved net-zero carbon emissions overnight and stayed that way for the rest of the century—basically destroying its economy and much of American quality of life—the 2100 projected global temperature would only drop 0.3 degree Fahrenheit based on the United Nations’ climate model.” - Bjorn Lomborg, president of the Copenhagen Consensus and author of “False Alarm” and “Best Things First.” Opinion at...
https://www.wsj.com/opinion/harris-stops-talking-about-climate-change-green-policies-costs-7d4b31ed
 
PANIC POLITICS (Turley blog)
“The [Washington] Post has been doggedly portraying the election between former President Donald Trump and Vice President Kamala Harris as a choice between tyranny (Trump) and democracy (Harris). Yet when it commissioned a poll on threats to democracy shortly before the election, it did not quite work out. Voters in swing states believe that Trump is more likely to protect democracy than Kamala Harris, who is running on a “save democracy” platform...
...Despite years of alarmist predictions from Biden, Harris, the press, and pundits, the public is not buying it. It is not because they particularly like Trump. Many of his supporters seem poised to vote for him despite viewing him as polarizing and, at times, obnoxious. No, it is because the American voter has a certain innate resistance to being played as a chump.” - Jonathan Turley, Professor, George Washington University Law School 
https://jonathanturley.org/2024/10/24/selling-the-apocalypse-the-press-and-pundits-face-devastating-polls-on-the-threat-to-democracy/#more-224663
 
DURABLE GOODS (Morningstar)
“Orders for durable goods in the U.S. declined for the third month out of the last four in September, as transportation equipment orders dropped. New orders for products meant to last at three years, such as automobiles, planes and electronic equipment, fell 0.8% in September compared with August...” Story at...
https://www.morningstar.com/news/dow-jones/202410255441/us-durable-goods-orders-dip-as-transportation-equipment-demand-slides
 
MARKET REPORT / ANALYSIS
-Friday the S&P 500 declined about 2 pts to 5808.
-VIX rose about 7% to 20.33.  
-The yield on the 10-year Treasury rose (compared to about this time, prior trading day) to 4.242%.
 
MY TRADING POSITIONS:
XLK – Holding since the October 2022 lows.  Added more 9/20.
QLD – added 7/24.
SSO – added 10/16.
SPY – added 9/19 & more 10/16
 
CURRENT SUMMARY OF APPROXIMATELY 50 INDICATORS:
Today, of the 50-Indicators I track, 12 gave Bear-signs and 9 were Bullish. The rest are neutral. (It is normal to have a lot of neutral indicators since many of the indicators are top or bottom indicators that will signal only at extremes.)

The daily Bull/Bear, 50-Indicator spread (Bull Indicators minus Bear Indicators, red curve in the chart above) declined to -3 (3 more Bear indicators and Bull indicators).
 
TODAY’S COMMENT:
I mentioned previously that the statistical analysis of daily moves in the S&P 500 showed too much conformity and therefore was signaling a pullback in 20-days or less.  That signal only lasted 3 days. It is most accurate when it continues into a top; the current top was on the center of those 3 days. For now, the signal is neutral.  There were plenty of other bear signs: MACD of price; my Money Trend indicator; long-term and short-term New-high/New-low data; McClellan Oscillator; and we can’t like that the 10-dMA of issues advancing on the NYSE (breadth) is declining over the last 2 weeks and there were several other bear signs. Overall, current indicators are not too scary.
 
Today’s Bull-Bear spread of -3 is only slightly bearish to neutral. The 10-dMA of the 50-Indicator Spread (purple line in the chart above) remained bearish since it is still moving lower. (I follow the 10-dMA for trading buy-signals and as an indicator for sell signals.)
 
I’ve added a light Blue, dashed line in the chart above to show a lower, trend-line back to the lows of early August. So far that support line has been holding, but it wouldn’t be a surprise to see the Index drop to its lower trend line.
 
Repeating:
My guess is that the decline will continue, but not much farther. The 50-dMA is a little more than 2% lower than today’s close.
 
BOTTOM LINE
I’m neutral on the markets. If the pullback continues, the drop should be small.
 
ETF - MOMENTUM ANALYSIS:
TODAY’S RANKING OF 15 ETFs (Ranked Daily) ETF ranking follows:
 

The top ranked ETF receives 100%. The rest are then ranked based on their momentum relative to the leading ETF.
*For additional background on the ETF ranking system see NTSM Page at…
http://navigatethestockmarket.blogspot.com/p/exchange-traded-funds-etf-ranking.html
 
DOW STOCKS - TODAY’S MOMENTUM RANKING OF THE DOW 30 STOCKS (Ranked Daily)
 

The top ranked Stock receives 100%. The rest are then ranked based on their momentum relative to the leading Stock.
For more details, see NTSM Page at…
https://navigatethestockmarket.blogspot.com/p/a-system-for-trading-dow-30-stocks-my_8.html
 
FRIDAY MARKET INTERNALS (NYSE DATA)
My basket of Market Internals declined to SELL.
(My basket of Market Internals is a decent trend-following analysis that is most useful when it diverges from the Index.) 


...My current invested position is about 65% stocks, including stock mutual funds and ETFs. I’m usually about 50% invested in stocks when markets are stretched. (75% is my max stock allocation when I am confident that markets will continue higher.)
 
I trade about 15-20% of the total portfolio using the momentum-based analysis I provide here. When I see bullish signs, I add a lot more stocks to the portfolio, usually by using an S&P 500 ETF as I did back in October 2022 and 2023.
 

Thursday, October 24, 2024

New Home Sales ... Jobless Claims ... Nat’l Activity Index ... Momentum Trading DOW Stocks & ETFs … Stock Market Analysis ...

 
“Trade what you see; not what you think.” – The Old Fool, Richard McCranie, trader extraordinaire.
 
“Far more money has been lost by investors in preparing for corrections, or anticipating corrections, than has been lost in the corrections themselves.” - Peter Lynch, former manager of Fidelity’s Magellan® fund.
 
“What is a level of U.S. debt that financial markets think is too large? The answer is “we have no idea” because it will depend on what is going on around the world and where else investors could park their money, said Maya MacGuineas, the president of the Committee for a Responsible Federal Budget, a nonpartisan budget watchdog. “When you look at the fiscal situation structurally, clearly it is unsound. The definition of unsustainable is if your debt is growing faster than your economy...
... “So, if you’re in the markets, you’re going to be unwise to bet on a fiscal crisis until it starts,” MacGuineas said. “And then my assumption is it would happen incredibly quickly, a Treasury auction that goes bad, depending on what the responses are, things could go incredibly quickly.”  Story at...
A U.S. fiscal crisis would happen incredibly quickly — and there’s no way to predict when, says head of budget watchdog
 
NEW HOME SALES (Reuters)
“Sales of new U.S. single-family homes increased to the highest level in nearly 1-1/2 years in September as buyers rushed in to take advantage of a decline in mortgage rates. New home sales jumped 4.1%...” Story at...
https://www.reuters.com/markets/us/us-new-home-sales-highest-nearly-1-12-years-september-2024-10-24/
 
JOBLESS CLAIMS (AP News)
“The number of Americans filing for unemployment benefits fell last week, but the total number of those collecting benefits rose to its highest level in almost three years. The Labor Department reported Thursday that applications for jobless claims fell by 15,000 to 227,000 for the week of Oct. 19... Continuing claims, the total number of Americans collecting jobless benefits, rose by 28,000 to 1.9 million for the week of Oct. 12. That’s the most since November 13, 2021.” Story at...
https://apnews.com/article/unemployment-benefits-jobless-claims-layoffs-labor-529340624cf272ba6030b8070264d920
 
NATIONAL ACTIVITY INDEX (Advisor Perspectives)

“The headline for the latest release of the Chicago Fed's National Activity Index (CFNAI) reads "Index suggests economic growth decreased in July". The Chicago Fed National Activity Index (CFNAI) fell to -0.34 in July from -0.09 in June. Two of the four broad categories of indicators used to construct the index decreased from June and three categories made negative contributions in July.” Commentary and chart at...
https://www.advisorperspectives.com/dshort/updates/2024/08/22/chicago-fed-national-activity-index-cfnai-economic-growth-decreased-july-2024
 
MARKET REPORT / ANALYSIS
-Thursday the S&P 500 rose about 0.2% to 5810.
-VIX declined about 1% to 19.08.  
-The yield on the 10-year Treasury declined (compared to about this time, prior trading day) to 4.214%.
 
MY TRADING POSITIONS:
XLK – Holding since the October 2022 lows.  Added more 9/20.
QLD – added 7/24.
SSO – added 10/16.
SPY – added 9/19 & more 10/16
 
CURRENT SUMMARY OF APPROXIMATELY 50 INDICATORS:
Today, of the 50-Indicators I track, 10 gave Bear-signs and 10 were Bullish. The rest are neutral. (It is normal to have a lot of neutral indicators since many of the indicators are top or bottom indicators that will signal only at extremes.)

The daily Bull/Bear, 50-Indicator spread (Bull Indicators minus Bear Indicators, red curve in the chart above) improved to zero (equal Bear indicators and Bull indicators).
 
TODAY’S COMMENT:
Today’s Bull-Bear spread of zero is neutral. The 10-dMA of the 50-Indicator Spread (purple line in the chart above) remained bearish since it is still moving lower. (I follow the 10-dMA for trading buy-signals and as an indicator for sell signals.)
 
I’ve added a light Blue, dashed line in the chart above to show a lower, trend-line back to the lows of early August. This shows a possibility that the pullback could be over.
 
My guess is that the decline will continue, but not much farther. The 50-dMA is a little more than 2% lower than today’s close.
 
BOTTOM LINE
I’m neutral on the markets. I don’t know if the decline will continue, but if it does, the drop should be small.
 
ETF - MOMENTUM ANALYSIS:
TODAY’S RANKING OF 15 ETFs (Ranked Daily) ETF ranking follows:
 

The top ranked ETF receives 100%. The rest are then ranked based on their momentum relative to the leading ETF.
*For additional background on the ETF ranking system see NTSM Page at…
http://navigatethestockmarket.blogspot.com/p/exchange-traded-funds-etf-ranking.html
 
DOW STOCKS - TODAY’S MOMENTUM RANKING OF THE DOW 30 STOCKS (Ranked Daily)
 

The top ranked Stock receives 100%. The rest are then ranked based on their momentum relative to the leading Stock.
For more details, see NTSM Page at…
https://navigatethestockmarket.blogspot.com/p/a-system-for-trading-dow-30-stocks-my_8.html
 
THURSDAY MARKET INTERNALS (NYSE DATA)
My basket of Market Internals improved to HOLD.
(My basket of Market Internals is a decent trend-following analysis that is most useful when it diverges from the Index.) 
 
 
...My current invested position is about 65% stocks, including stock mutual funds and ETFs. I’m usually about 50% invested in stocks when markets are stretched. (75% is my max stock allocation when I am confident that markets will continue higher.)
 
I trade about 15-20% of the total portfolio using the momentum-based analysis I provide here. When I see bullish signs, I add a lot more stocks to the portfolio, usually by using an S&P 500 ETF as I did back in October 2022 and 2023.

Wednesday, October 23, 2024

Home Sales ... Crude Inventory ... Momentum Trading DOW Stocks & ETFs … Stock Market Analysis ...

 
“Trade what you see; not what you think.” – The Old Fool, Richard McCranie, trader extraordinaire.
 
“Far more money has been lost by investors in preparing for corrections, or anticipating corrections, than has been lost in the corrections themselves.” - Peter Lynch, former manager of Fidelity’s Magellan® fund.
 
NATE SILVER (NY Times)
“My gut says Donald Trump. And my guess is that it is true for many anxious Democrats. But I don’t think you should put any value whatsoever on anyone’s gut — including mine. Instead, you should resign yourself to the fact that a 50-50 forecast really does mean 50-50. And you should be open to the possibility that those forecasts are wrong, and that could be the case equally in the direction of Mr. Trump or Ms. Harris.” – Nate Silver, Silver Bulletin Election Forecast.
Nate Silver: Here’s What My Gut Says About the Election. But Don’t Trust Anyone’s Gut, Even Mine.
 
EXISTING HOME SALES (Yahoo Finance)
“U.S. existing home sales dropped to a 14-year low in September, weighed down by higher mortgage rates and house prices.
The second straight monthly decline in home resales reinforced economists' views that the slump in residential investment, which includes homebuilding, deepened in the third quarter... Home sales fell 1.0% last month...”
https://finance.yahoo.com/news/us-existing-home-sales-fall-140141499.html
 
CRUDE INVENTORY (EIA)
“U.S. commercial crude oil inventories (excluding those in the Strategic Petroleum Reserve) increased by 5.5 million barrels from the previous week. At 426.0 million barrels, U.S. crude oil inventories are about 4% below the five year average for this time of year.” Report at...
https://ir.eia.gov/wpsr/wpsrsummary.pdf
 
MARKET REPORT / ANALYSIS
-Wednesday the S&P 500 slipped about 0.9% to 5797.
-VIX rose about 6% to 19.24.  
-The yield on the 10-year Treasury rose (compared to about this time, prior trading day) to 4.246%.
 
MY TRADING POSITIONS:
XLK – Holding since the October 2022 lows.  Added more 9/20.
UWM – Sold half this position 10/21.
QLD – added 7/24.
SSO – added 10/16.
SPY – added 9/19 & more 10/16
 
CURRENT SUMMARY OF APPROXIMATELY 50 INDICATORS:
Today, of the 50-Indicators I track, 12 gave Bear-signs and 9 were Bullish. The rest are neutral. (It is normal to have a lot of neutral indicators since many of the indicators are top or bottom indicators that will signal only at extremes.)

The daily Bull/Bear, 50-Indicator spread (Bull Indicators minus Bear Indicators, red curve in the chart above) declined to -3 (3 more Bear indicators than Bull indicators).
 
TODAY’S COMMENT:
Today’s Bull-Bear spread of -3 is mildly bearish, but probably should be considered neutral. The 10-dMA of the 50-Indicator Spread (purple line in the chart above) has turned bearish since it is moving lower. (I follow the 10-dMA for trading buy-signals and as an indicator for sell signals.)
 
First warning on breadth? The 10-dMA of issues advancing on the NYSE shows that over the last 2-weeks, less than half of issues on the NYSE have advanced. That’s a bear sign and there are now more bear signs than I care to list.
 
Wednesday was a statistically significant down-day. That just means that the price-volume move exceeded my statistical parameters. Statistics show that a statistically-significant, down-day is followed by an up-day about 60% of the time. 
 
Statistical analysis of the daily moves on the S&P 500 improved again today. In advance of prior pullbacks, statistical moves have continued to signal weakness until the pullback occurred. This may be telling us again that a pullback (if it continues) will not be very big. The S&P 500 is 2.2% above its 50-dMA and that is a likely support level, i.e., the drop from today’s close is not likely to be much more than another 2%.
 
I’ve added a Blue, dashed line in the chart above to show a lower, trend-line back to the lows of early August. This shows a possibility that the pullback could be over.
 
BOTTOM LINE
I don’t know if the decline will continue, but even if it does, the drop should be small from today’s close.
 
ETF - MOMENTUM ANALYSIS:
TODAY’S RANKING OF 15 ETFs (Ranked Daily) ETF ranking follows:
 

The top ranked ETF receives 100%. The rest are then ranked based on their momentum relative to the leading ETF.
*For additional background on the ETF ranking system see NTSM Page at…
http://navigatethestockmarket.blogspot.com/p/exchange-traded-funds-etf-ranking.html

DOW STOCKS - TODAY’S MOMENTUM RANKING OF THE DOW 30 STOCKS (Ranked Daily)
 

The top ranked Stock receives 100%. The rest are then ranked based on their momentum relative to the leading Stock.
For more details, see NTSM Page at…
https://navigatethestockmarket.blogspot.com/p/a-system-for-trading-dow-30-stocks-my_8.html

WEDNESDAY MARKET INTERNALS (NYSE DATA)
My basket of Market Internals declined to SELL.
(My basket of Market Internals is a decent trend-following analysis that is most useful when it diverges from the Index.) 


...My current invested position is about 70% stocks, including stock mutual funds and ETFs. I’m usually about 50% invested in stocks when markets are stretched. (75% is my max stock allocation when I am confident that markets will continue higher.)
 
I trade about 15-20% of the total portfolio using the momentum-based analysis I provide here. When I see bullish signs, I add a lot more stocks to the portfolio, usually by using an S&P 500 ETF as I did back in October 2022 and 2023.