Richmond FED Manufacturing ... Momentum Trading DOW Stocks & ETFs … Stock Market Analysis ...
“Trade what you see; not what you think.” – The Old Fool,
Richard McCranie, trader extraordinaire.
“Far more money has been lost by investors in preparing for
corrections, or anticipating corrections, than has been lost in the corrections
themselves.” - Peter Lynch, former manager of Fidelity’s Magellan®
fund.
"The one thing that doesn't abide by majority rule
is a person's conscience." – Atticus Finch.
"Why is it a penny for your thoughts, but you have
to put your two cents in? Somebody’s making a penny." – Steven Wright
RICHMOND FED MANUFACTURING (Advisor Perspectives)
“Fifth district manufacturing activity slowed in August,
according to the most recent survey from the Federal Reserve Bank of Richmond.
The composite manufacturing index fell to -19 this month from -17 in July. This
month's reading was worse than the forecast of -14 and is the lowest reading
since May 2020.” Commentary and analysis at...
https://www.advisorperspectives.com/dshort/updates/2024/08/27/richmond-fed-manufacturing-activity-slowed-august-2024
MARKET REPORT / ANALYSIS
-Tuesday the S&P 500 slipped about 0.1% to 5851.
-VIX declined about 1% to 18.20.
-The yield on the 10-year Treasury rose (compared to
about this time, prior trading day) to 4.210%.
MY TRADING POSITIONS:
XLK – Holding since the October 2022 lows. Added more 9/20.
UWM – Sold half this position 10/21.
QLD – added 7/24.
SSO – added 10/16.
SPY – added 9/19 & more 10/16
CURRENT SUMMARY OF APPROXIMATELY 50 INDICATORS:
Today, of the 50-Indicators I track, 9 gave Bear-signs
and 13 were Bullish. The rest are neutral. (It is normal to have a lot of
neutral indicators since many of the indicators are top or bottom indicators
that will signal only at extremes.)
The daily Bull/Bear, 50-Indicator spread (Bull Indicators
minus Bear Indicators, red curve in the chart above) declined to +4 (4 more
Bull indicators than Bear indicators).
TODAY’S COMMENT:
After opening lower, today’s chart was up nearly all day
and finished toward the highs, but not at the highs. We’ll take it. It was
certainly a more bullish sign than yesterday.
Today’s Bull-Bear spread of +4 is mildly bullish but
probably should be considered neutral. The 10-dMA of the 50-Indicator Spread
(purple line in the chart above) remains bullish, since it is moving higher, so
indicators are giving mixed signals. (I follow the 10-dMA for trading buy-signals
and as an indicator for sell signals.)
Both short-term and long-term, new-high/new-low data is
bearish. Some Breadth indicators are
warning too. The 10, 50, & 100-dMA of issues advancing on the NYSE are all
OK (above 50% over their respective analysis periods) so I won’t worry yet.
Statistical analysis of the daily moves on the S&P
500 improved slightly, but remains close to the zone that shows markets are too
calm. This indicator suggests a top in
less than 20-days. This does not mean that a major top is coming. It might
simply portend a normal 3-5% retreat. The last time this signal occurred was
10-days before the top of 16 July; the market declined 8.5% after that top.
Indicators bounced higher, but have declined more recently.
If that continues a normal retreat of 3-5% would be likely.
BOTTOM LINE
I’m cautiously bullish.
Markets may be setting up for a small retreat. I don’t
try to trade short-term, small moves except that I will tactically take profits
in leveraged positions if a retreat seems likely.
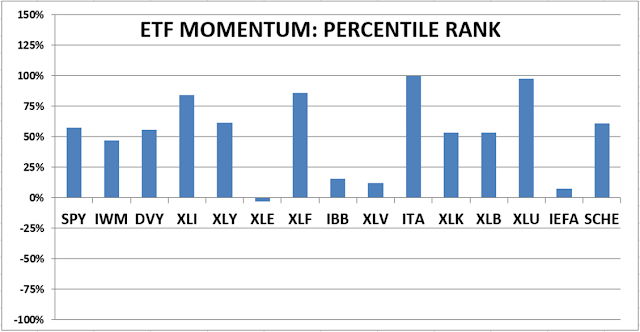
ETF - MOMENTUM ANALYSIS:
TODAY’S RANKING OF 15 ETFs (Ranked Daily) ETF ranking
follows:
The top ranked ETF receives
100%. The rest are then ranked based on their momentum relative to the leading
ETF.
*For additional background on
the ETF ranking system see NTSM Page at…
http://navigatethestockmarket.blogspot.com/p/exchange-traded-funds-etf-ranking.html
DOW STOCKS - TODAY’S MOMENTUM RANKING
OF THE DOW 30 STOCKS (Ranked Daily)
The top ranked Stock receives
100%. The rest are then ranked based on their momentum relative to the leading Stock.
For more details, see NTSM
Page at…
https://navigatethestockmarket.blogspot.com/p/a-system-for-trading-dow-30-stocks-my_8.html
TUESDAY MARKET INTERNALS (NYSE
DATA)
My basket of Market Internals remained to HOLD. (My basket of Market
Internals is a decent trend-following analysis that is most useful when it
diverges from the Index.)
...My current invested
position is about 70% stocks, including stock mutual funds and ETFs. I’m
usually about 50% invested in stocks when markets are stretched. (75% is my max
stock allocation when I am confident that markets will continue higher.)
I trade about 15-20% of the total portfolio using the
momentum-based analysis I provide here. When I see bullish signs, I add a lot more
stocks to the portfolio, usually by using an S&P 500 ETF as I did back in
October 2022 and 2023.


