“Trade what you see; not what you think.” – The Old Fool, Richard McCranie, trader extraordinaire.
... “So, if you’re in the markets, you’re going to be unwise to bet on a fiscal crisis until it starts,” MacGuineas said. “And then my assumption is it would happen incredibly quickly, a Treasury auction that goes bad, depending on what the responses are, things could go incredibly quickly.” Story at...
A U.S. fiscal crisis would happen incredibly quickly — and there’s no way to predict when, says head of budget watchdog
“Sales of new U.S. single-family homes increased to the highest level in nearly 1-1/2 years in September as buyers rushed in to take advantage of a decline in mortgage rates. New home sales jumped 4.1%...” Story at...
https://www.reuters.com/markets/us/us-new-home-sales-highest-nearly-1-12-years-september-2024-10-24/
“The number of Americans filing for unemployment benefits fell last week, but the total number of those collecting benefits rose to its highest level in almost three years. The Labor Department reported Thursday that applications for jobless claims fell by 15,000 to 227,000 for the week of Oct. 19... Continuing claims, the total number of Americans collecting jobless benefits, rose by 28,000 to 1.9 million for the week of Oct. 12. That’s the most since November 13, 2021.” Story at...
https://apnews.com/article/unemployment-benefits-jobless-claims-layoffs-labor-529340624cf272ba6030b8070264d920
“The headline for the latest release of the Chicago Fed's National Activity Index (CFNAI) reads "Index suggests economic growth decreased in July". The Chicago Fed National Activity Index (CFNAI) fell to -0.34 in July from -0.09 in June. Two of the four broad categories of indicators used to construct the index decreased from June and three categories made negative contributions in July.” Commentary and chart at...
https://www.advisorperspectives.com/dshort/updates/2024/08/22/chicago-fed-national-activity-index-cfnai-economic-growth-decreased-july-2024
-Thursday the S&P 500 rose about 0.2% to 5810.
-VIX declined about 1% to 19.08.
-The yield on the 10-year Treasury declined (compared to about this time, prior trading day) to 4.214%.
XLK – Holding since the October 2022 lows. Added more 9/20.
QLD – added 7/24.
SSO – added 10/16.
SPY – added 9/19 & more 10/16
Today, of the 50-Indicators I track, 10 gave Bear-signs and 10 were Bullish. The rest are neutral. (It is normal to have a lot of neutral indicators since many of the indicators are top or bottom indicators that will signal only at extremes.)
The daily Bull/Bear, 50-Indicator spread (Bull Indicators minus Bear Indicators, red curve in the chart above) improved to zero (equal Bear indicators and Bull indicators).
Today’s Bull-Bear spread of zero is neutral. The 10-dMA of the 50-Indicator Spread (purple line in the chart above) remained bearish since it is still moving lower. (I follow the 10-dMA for trading buy-signals and as an indicator for sell signals.)
I’m neutral on the markets. I don’t know if the decline will continue, but if it does, the drop should be small.
TODAY’S RANKING OF 15 ETFs (Ranked Daily) ETF ranking follows:
*For additional background on the ETF ranking system see NTSM Page at…
http://navigatethestockmarket.blogspot.com/p/exchange-traded-funds-etf-ranking.html
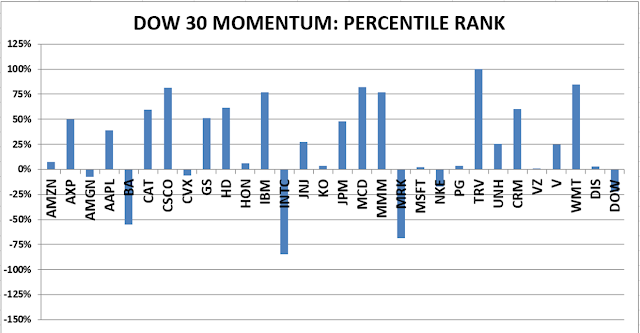
For more details, see NTSM Page at…
https://navigatethestockmarket.blogspot.com/p/a-system-for-trading-dow-30-stocks-my_8.html
My basket of Market Internals improved to HOLD. (My basket of Market Internals is a decent trend-following analysis that is most useful when it diverges from the Index.)


