
Get rich quick? No.
“Make haste slowly.” – Andres SegoviaADP EMPLOYMENT (Reuters)
“U.S. private employers added 177,000 jobs in August, above economists' expectations, a report by a payrolls processor showed on Wednesday.” Story at…
http://www.reuters.com/article/us-usa-economy-adp-idUSKCN1161KV
CHICAGO PMI (MarketWatch)
"A measure of business conditions in the Chicago area posted the weakest performance in August in three months, reflecting a divide in the U.S. economy in which consumer spending is strong but businesses are holding back. The Chicago PMI fell 4.3 point to 51.5…readings above 50 indicate expansion...” Story at…
http://www.marketwatch.com/story/chicago-business-conditions-soften-pmi-shows-2016-08-31
CRUDE INVENTORY (Business Insiider)
“Crude oil is getting clobbered after the latest inventory data from the Department of Energy showed a larger than expected build. West Texas Intermediate crude oil is lower by 2.8% near $45 per barrel…The build of 2.3 million barrels…was far greater than the 1.1 million barrels that economists had forecast.” Story at…
http://www.businessinsider.com/crude-oil-inventory-data-august-31-2016-2016-8
SEPTEMBER SELLOFF (Real Investment Advice)
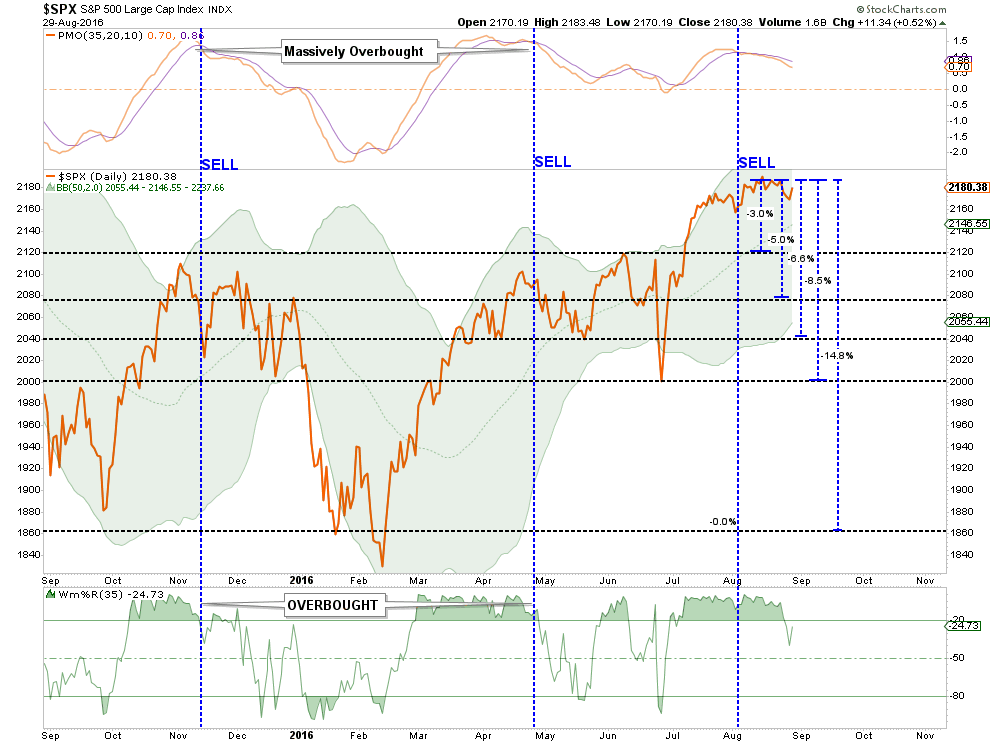
 Support levels indicated in the chart are the likely
stopping points for a September correction in the range of 3-15%. My guess is a
5% drop to the 200-dMA. Chart and
commentary at…
Support levels indicated in the chart are the likely
stopping points for a September correction in the range of 3-15%. My guess is a
5% drop to the 200-dMA. Chart and
commentary at…https://realinvestmentadvice.com/technically-speaking-why-interest-rates-are-going-to-zero/
MARKET REPORT / ANALYSIS
- Wednesday the S&P 500 was down about 0.2% to 2171.
-VIX rose about 3% to 13.43 near the close.
-The yield on the 10-year Treasury remained 1.57%.
Bollinger Bands are again as close as they have been in the last 6-months. This officially qualifies as a “Bollinger Band Squeeze” and is again a bearish signal in the short-run. I’ve looked back as far as June of 2008 and couldn’t find a narrower squeeze than the one currently underway. This just shows that the markets are not very volatile and the daily moves are uniform. That is typically followed by a move down, but John Bollinger suggests that it means a breakout is coming and that could be up or down. My work suggests a move down, but it doesn’t have to be huge. I am guessing a roughly 5% pullback, but we’ll see.
VXX TRADE:
Wednesday, the calm-before-the-storm indicator (low standard of deviation in recent market moves) still remains down and that suggests that VXX remained a buy as of Monday’s close. While this has been going on for several weeks, it is not unusual. There is a lot of scatter in how long it takes for the Index to follow the indicator, and of course, the indicator is not perfect.
SHORT TRADE
I am still holding short positions, but I did exit some of the short positions and transitioned into VXX. (This books a loss for the trade for tax purposes and maintains a bearish stance.) I caution again to take it easy on this high risk stuff.
MONEY TREND INDICATOR
My short-term Money Trend indicator can be volatile; Wednesday it remains trending flat to slightly down; a neutral to slightly bearish indication.
MARKET INTERNALS (NYSE DATA)
The 10-day moving average of the percentage of stocks advancing (NYSE) dipped to 51.4% Wednesday. It was 52.8% Tuesday. A number above 50% is usually GOOD news for the markets.
On a longer term, the 150-day moving average of advancing stocks dipped to 54.9%. A value above 50% generally indicates an up-trend. The McClellan Oscillator dipped from -16 to -30 (percentage calculation method).
New-highs outpaced New-lows. The spread (new-highs minus new-lows) slipped to +116 Wednesday. (It was +163 Tuesday.) The 10-day moving average of the change in spread was +3. In other words, over the last 10-days, on average, the spread has increased by 3 each day. Market Internals remained neutral on the market.

Market Internals are a decent trend-following analysis of
current market action, but should not be used alone for short term trading.
They are usually right, but they are often late. They are most useful when they diverge from
the Index. In 2014, using these
internals alone would have made a 9% return vs. 13% for the S&P 500 (in on
Positive, out on Negative – no shorting).
LONG TERM INDICATOR
Wednesday the Price indicator was positive; Sentiment, VIX and & Volume indicators were neutral. The long-term indicator is HOLD.

MY INVESTED STOCK POSITION:
TSP (RETIREMENT ACCOUNT – GOV EMPLOYEES) ALLOCATIONOn 12 July I increased my invested position in my retirement account to 25% invested in stocks thru an S&P 500 Index fund (“C”-fund in the TSP). I added to that position Thursday 21 July bringing my invested total up to 40% in stocks. I expect to add more stocks should we get the anticipated pullback.
The NTSM system indicated Buy at the 11 Feb bottom; and again 2-days after the bottom on high up-volume; and from 22 Feb thru 25 April. I ignored the early signals convinced that it was a bear market bounce; I ignored more recent signals due to overbought conditions. I’m following my system now, especially since the Index has climbed above my initial sell-point of 2100 on the S&P 500 back in November 2015.