“Trade what you see; not what you think.” – The Old Fool,
Richard McCranie, trader extraordinaire.
“Faced with a combination of record speculative extremes
and deteriorating speculative conditions, investors may want to remember that
the best time to panic is before everyone else does.” – John Hussman, Phd.
PERSONAL SPENDING / PCE PRICES (Reuters)
“U.S. consumer spending rose more than expected in March
amid strong demand for services, while monthly inflation surged by the most in
16-1/2 years...Consumer spending, which accounts for more than two-thirds of
U.S. economic activity, surged 1.1% last month...In the 12 months through
March, the PCE price index jumped 6.6%.” Story at...
CHICAGO PMI (ShareCast)
“Factory activity in the Chicago area fell more quickly
than expected in April as new order growth nearly stalled, the results of a
survey showed. Market News
International's Chicago Business Barometer fell from a reading of
62.9 for March to 56.4 in April (consensus: 60.1).” Story at...
UNIV OF MICHIGAN SENTIMENT (Univ of Michigan)
“Consumers voiced much more positive views in April,
rising 9.8% above March, according to the University of Michigan Surveys of
Consumers. Most of the surge was concentrated in expectations, with gains of
21.6% in the year-ahead outlook for the economy and an 18.3% jump in personal
financial expectations...” Press release at...
https://news.umich.edu/rising-wages-drives-both-optimism-pessimism-on-inflation/
MARKET REPORT / ANALYSIS
-Friday the S&P 500 fell about 3.6% to 4132.
-VIX rose about 11% to 33.4.
-The yield on the 10-year Treasury rose to 2.862%.
PULLBACK DATA:
-Drop from Top: 13.9% as of today. 13.9% max. (Avg.= 13%
for non-crash pullbacks)
-Days from Top to Bottom: 81-days. (Avg= 30 days top to
bottom for corrections <10%; 60 days top to bottom for larger, non-crash
pullbacks)
The S&P 500 is 8% BELOW its 200-dMA & 5.7% BELOW
its 50-dMA.
*We can’t be sure about the end of the correction until the
S&P 500 makes a new high, but hopefully we can call the bottom when it happens.
TODAY’S COMMENT:
On Fridays, I summarize a number of indicators to get a
weekly feel for trend. Overall, the end-of-week summary remained well to the
Bear side (17-bear and 4-bull). These indicators (totaling 38 today) tend to be
both long-term and short-term, so they are different than the 20 that I report
on daily. Details follow:
BULL SIGNS
-The smoothed advancing volume on the NYSE is rising.
-Bollinger Bands.
-Overbought/Oversold Index (Advance/Decline Ratio)
-RSI.
NEUTRAL
-There has been 2 Distribution Day since the last
Follow-Thru Day on 19 April.
-Non-crash Sentiment indicator is neutral.
-The S&P 500 is 8% below its 200-dMA (Bear indicator
is 12% above the 200-day.). This value was 15.9% above the 200-dMA when the 10%
correction occurred in Sep 2020. (Bigger bottoms are formed when the Index is
at, or below, the 200-dMA.)
-Issues advancing on the NYSE (Breadth) compared to the
S&P 500 is neutral.
-The 10-dEMA of the Fosback Hi-Low Logic Index is now in
neutral territory.
-There was a Hindenburg Omen signal 8 April – it was
canceled when the McClellan Oscillator turned bullish.
-Slope of the 40-dMA of New-highs is flat. This is one of
my favorite trend indicators.
-There have been 8 up-days over the last 20 sessions –
neutral.
-There have been 5 up-days over the last 10 sessions – neutral.
-The size of up-moves has been smaller than the size of
down-moves over the last month, but not enough to send a signal.
-The Calm-before-the-Storm/Panic Indicator did not
indicate a bottom Friday.
-VIX has been rising, but not enough to give a signal
Friday.
-No 90% up or down days. I’ve seen a comment from a Pro
that the correction won’t end until the S&P 500 has a 90% down-volume day
-2.8% of all issues traded on the NYSE made new, 52-week
highs when the S&P 500 made a new all-time-high, 3 January. (There is no
bullish signal for this indicator.) This indicated that the advance was too
narrow and a correction was likely to be >10%. – It proved correct, but is
now Expired
-29 April, the 52-week, New-high/new-low ratio improved
by 0.4 standard deviations; too low to send a signal.
-The graph of the Count (the 100-day sum of up-days)
dropped to 45, but the trend looks flat now.
-Cyclical Industrials (XLI-ETF) are out-performing the
S&P 500, but the trend is down – I’ll put this the neutral category.
BEAR SIGNS
-There have been 7 Statistically-Significant days (big
moves in price-volume) in the last 15-days. This tends to be bearish.
-The 10-dMA % of issues advancing on the NYSE
(Breadth) is below 50%.
-The 50-dMA % of issues advancing on the NYSE (Breadth)
is below 50%.
-The 100-dMA % of issues advancing on the NYSE
(Breadth) is below 50%
-The 50-dMA % of issues advancing on the NYSE (Breadth)
has been below 50% for 91 consecutive days. (3 days in a row is my “correction-now”
signal)
-MACD of the percentage of issues advancing on the NYSE
(breadth) made a bearish crossover 21 April.
-Smoothed Buying Pressure minus Selling Pressure is falling.
-MACD of S&P 500 price made a bearish crossover 7
April.
-My Money Trend indicator is headed down.
-Short-term new-high/new-low data is falling.
-Long-term new-high/new-low data is falling.
-The 1-day Fosback High-Low Logic Index was very bearish
on 21 April. That signal remains in place for 30-days.
-McClellan Oscillator is negative.
-The Smart Money (late-day action) is falling. (This
indicator is based on the Smart Money Indicator developed by Don Hayes).
-The 5-10-20 Timer System is SELL; the 5-dEMA and 10-dEMA
are both BELOW the 20-dEMA.
-The S&P 500 is under-performing the Utilities
ETF (XLU) over the last 40 sessions (by a lot). This is headed up, but it is
still bearish.
-Only 41% of the 15-ETFs that I track have been up over
the last 10-days.
On Friday, 21 February, 2 days after the top before the
Coronavirus pullback, there were 10 bear-signs and 1 bull-sign. Now there
are 17 bear-signs and 4-Bull. Last week, there were 18 bear-signs and 3
bull-signs.
Today was a statistically significant down-day. That just
means that the price-volume move exceeded my statistical parameters. Statistics
show that a statistically-significant, down-day is followed by an up-day about
60% of the time.
Sometimes these big down-days are at bottoms. Both RSI and Bollinger Bands were overbought
and that often signals a short-term bottom. I’d like to think today was a
bottom, but volume picked up today as selling increased. That’s not a bullish sign, even though the
internals are improved compared to the prior low on 8 March.
Today, the daily sum of 20 Indicators improved from -3 to
zero (a positive number is bullish; negatives are bearish); the 10-day smoothed
sum that smooths the daily fluctuations improved from -13 to -8. (The trend
direction is more important than the actual number for the 10-day value.) These
numbers sometimes change after I post the blog based on data that comes in
late. Most of these 20 indicators are short-term so they tend to bounce
around a lot.
The improvement in the short-term indicators is due to
the extreme oversold conditions today.
The Long Term NTSM indicator improved
to HOLD: VOLUME is bearish; PRICE, VIX & SENTIMENT are hold.
The length of this correction could mean that it will go
much lower to match up with previous long corrections – say 20%? This isn’t a
prediction – just a worry. Only time
will tell...
I remain a Bear.
BEST ETFs - MOMENTUM ANALYSIS:
TODAY’S RANKING OF 15 ETFs
(Ranked Daily)
The top ranked ETF receives
100%. The rest are then ranked based on their momentum relative to the leading ETF.

http://navigatethestockmarket.blogspot.com/p/exchange-traded-funds-etf-ranking.html
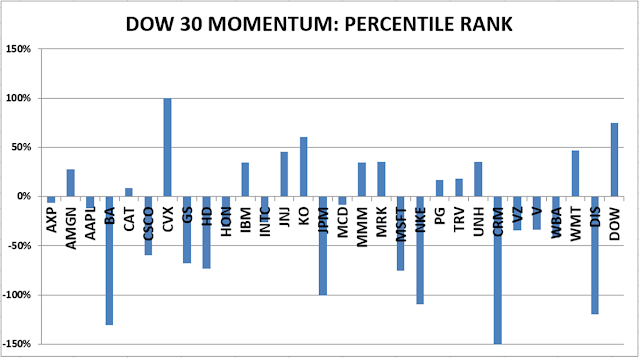
BEST DOW STOCKS - TODAY’S MOMENTUM
RANKING OF THE DOW 30 STOCKS (Ranked Daily)
Here’s the revised DOW 30 and
its momentum analysis. The top ranked stock receives 100%. The rest are then
ranked based on their momentum relative to the leading stock.
https://navigatethestockmarket.blogspot.com/p/a-system-for-trading-dow-30-stocks-my_8.html
FRIDAY MARKET INTERNALS (NYSE
DATA)

Market Internals are a decent
trend-following analysis of current market action, but should not be used alone
for short term trading. They are usually right, but they are often late. They are most useful when they diverge from
the Index.
My stock-allocation in the
portfolio is now about 35% invested in stocks. This is below my “normal” fully
invested stock-allocation of 50%.
I trade about 15-20% of the
total portfolio using the momentum-based analysis I provide here. If I can see
a definitive bottom, I’ll add a lot more stocks to the portfolio using an
S&P 500 ETF.
You may wish to have a higher
or lower % invested in stocks depending on your risk tolerance. 50% is a
conservative position that I consider fully invested for most retirees.
As a general rule, some
suggest that the % of portfolio invested in the stock market should be one’s
age subtracted from 100. So, a
30-year-old person would have 70% of the portfolio in stocks, stock mutual
funds and/or stock ETFs. That’s ok, but
for older investors, I usually don’t recommend keeping less than 50% invested
in stocks (as a fully invested position) since most people need some growth in
the portfolio to keep up with inflation.


