“Trade what you see; not what you think.” – The Old Fool, Richard McCranie, trader extraordinaire.
“After four consecutive “jumbo” rate hikes of 0.75 percentage point, Federal Reserve chair Jerome Powell suggested that the next rate hike in December will only be 0.50 percentage point, in a speech at The Brookings Institute on Wednesday... “It makes sense to moderate the pace of our rate increases,” Powell said, citing a recent drop in year-over-year inflation, as well as the lag effects to prices from “rapid” rate hikes in 2022.” Story at...
https://www.cnbc.com/2022/11/30/jerome-powell-federal-reserve-may-ease-off-jumbo-rate-hikes.html
-“Private employers added 127,000 jobs in November. Job creation slowed by the most since January 2021, led by construction and other interest rate-sensitive sectors. Consumer-facing segments - including health care and hospitality - were bright spots...Turning points can be hard to capture in the labor market, but our data suggest that Federal Reserve tightening is having an impact on job creation and pay gains.” Press release at...
https://adpemploymentreport.com/
“Market News International's Chicago factory sector Purchasing Managers' index cratered to a reading of 37.2. That was down from an October print of 45.2 and well below economists' forecasts for a reading of 47.0.” Story at...
https://www.sharecast.com/news/international-economic/chicago-pmi-craters-in-november--11559718.html
“The Job Openings and Labor Turnover Survey showed there were 10.33 million vacancies for the month, decline of 353,000 from September and down 760,000 compared with a year ago. That left 1.7 job openings per available worker for the month, down from a 2 to 1 ratio just a few months ago.” Story at...
https://www.cnbc.com/2022/11/30/jolts-report-october-2022-job-openings-fall-amid-fed-efforts-to-cool-labor-market.html
“U.S. commercial crude oil inventories (excluding those in the Strategic Petroleum Reserve) decreased by 12.6 million barrels from the previous week. At 419.1 million barrels, U.S. crude oil inventories are about 8% below the five year average for this time of year.” Report at...
https://ir.eia.gov/wpsr/wpsrsummary.pdf
“U.S. economic growth eased this fall with business activity in some parts of the country stalling or declining, the Federal Reserve said in a Wednesday report. Businesses also expressed greater uncertainty and increased pessimism for the U.S. economy as prices and interest rates continue to rise, according to the central bank’s latest compilation of economic anecdotes from around the country, known as the Beige Book. U.S. economic activity was “about flat or up slightly,” compared with a moderate average pace of growth cited in the prior report.” Story at...
https://www.wsj.com/articles/u-s-economic-growth-slowed-this-fall-feds-beige-book-says-11669836396
“...while I have been super bullish since the bottom, I also recognize that the S&P 500 is up roughly 13% since October 12th and it is stretching the envelope to mix my metaphors. Some retrenchment is likely and needed for the final push into year-end. The rally should not be over if my preferred scenario remains correct.” – Paul Schatz. Commentary at..
https://investfortomorrow.com/blog/seasonal-headwind-today-as-black-friday-cyber-monday-get-weighed/
-Wednesday the S&P 500 rose about 3.1% to 4080.
-VIX dipped about 6% to 20.58.
-The yield on the 10-year Treasury dipped to 3.606%.
-Drop from Top: 14.9% as of today. 25.4% max (on a closing basis).
-Trading Days since Top: 229-days.
The S&P 500 is 0.7% ABOVE its 200-dMA & 7.4% above its 50-dMA. (The last rally failed at the 200-dMA. Let’s see if the Index can close above it on consecutive days.)
*I won’t call the correction over until the S&P 500 makes a new-high; however, evidence suggests the bottom was in the 3600 area and I am fully invested with a higher percentage of stocks than normal.
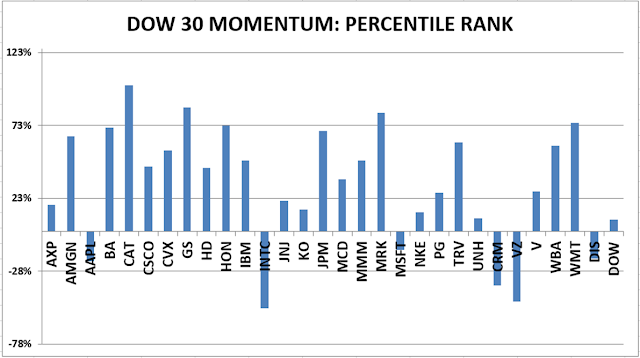
XLI – Industrial ETF (XLI still looks good to me. Nearly 10% of XLI is in Boeing and Caterpillar and they are both strong performers in the DOW momentum analysis.)
QLD – 2x Nas 100
DDM – 2x Dow 30. I may sell DDM and replace it with SSO (2x S&P 500), but for now, the DOW 30 is still doing better than the S&P 500.
XLK – Technology ETF
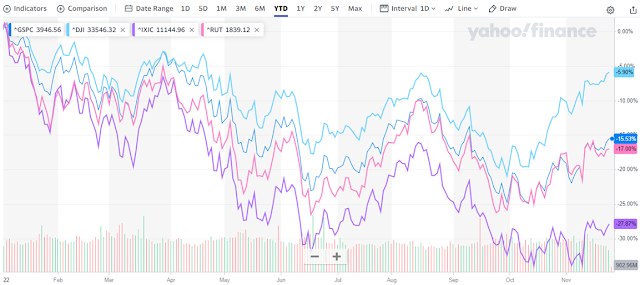
Fed Chair Powell’s speech was today, not yesterday, as I reported incorrectly. What did he say? Here’s all we need to know in graph form:

BEST ETFs - MOMENTUM ANALYSIS:
TODAY’S RANKING OF 15 ETFs (Ranked Daily)
ETF ranking follows:
 The top ranked ETF receives
100%. The rest are then ranked based on their momentum relative to the leading
ETF.
The top ranked ETF receives
100%. The rest are then ranked based on their momentum relative to the leading
ETF.*For additional background on the ETF ranking system see NTSM Page at…
http://navigatethestockmarket.blogspot.com/p/exchange-traded-funds-etf-ranking.html
XLE has taken the top position in the ETF momentum index. I own CVX so I already have good exposure to energy.
DOW 30 momentum ranking follows:

For more details, see NTSM Page at…
https://navigatethestockmarket.blogspot.com/p/a-system-for-trading-dow-30-stocks-my_8.html

(Market Internals are a decent trend-following analysis of current market action, but should not be used alone for short term trading. They are most useful when they diverge from the Index.)