From Matt Davies Twitter (X) Post
Biden’s mental capacity seems severely compromised. His
age is showing and it scares me. Trump
could get elected. The way to put an end to Trump is for Democrats to cross
party lines and vote in the Republican Primaries. It is allowed in 16 states
with no restrictions including here in Virginia. It is also allowed in a number of other
states, but the rules vary so check your locality.
“Trade what you see; not what you think.” – The Old Fool,
Richard McCranie, trader extraordinaire.
PCE PRICES / PERSONAL INCOME & SPENDING (CNBC)
“Inflation as measured by personal spending increased in
line with expectations... The personal consumption expenditures price index,
excluding food and energy prices, rose 0.2% for the month and 3.5% on a
year-over-year basis... Personal income and spending both rose 0.2% on the
month, also meeting estimates and indicating that consumers are keeping pace
with inflation.” Story at...
https://www.cnbc.com/2023/11/30/pce-inflation-report-october-2023-.html
JOBLESS CLAIMS (ABC News)
“Slightly more Americans filed for jobless claims last
week, but the overall number of people in the U.S. collecting unemployment
benefits rose to its highest level in two years. Applications for unemployment
benefits rose by 7,000 to 218,000 for the week ending Nov. 25...” Story at...
https://abcnews.go.com/Business/wireStory/applications-us-jobless-benefits-rise-modestly-continuing-claims-105270445
CHICAGO PMI (Advisor Perspectives)
“The latest Chicago Purchasing Manager's Index (Chicago Business
Barometer) jumped to 55.8 in November from 44.0 in October, marking the highest
level in the past 17 months. The latest reading is better than the 45.4
forecast and pushes the index into expansion territory for the first time in 15
months.” Story at...
https://www.advisorperspectives.com/dshort/updates/2023/11/30/chicago-pmi-jumps-to-17-month-high-in-november?topic=covid-19-coronavirus-coverage
MARKET REPORT / ANALYSIS
-Thursday the S&P 500 rose about 0.4% to 4568.
-VIX dipped about 0.5% to 12.92.
-The yield on the 10-year Treasury rose to 4.340%.
PULLBACK DATA:
-Drop from Top: 4.8%. 25.4% max (on a closing basis).
-Trading Days since All-Time Top: 480-days. (The top was
3 January 2022.)
The S&P 500 is 6.6% ABOVE its 200-dMA and 4.9% ABOVE
its 50-dMA.
*I won’t call the correction over until the S&P 500
makes a new-high; however, evidence suggests the major bear-market bottom (25%
decline) was in the 3600 area and we called a buy on 4 October 2022.
MY TRADING POSITIONS:
XLK – Technology ETF (holding since the October 2022
lows).
XLY - Consumer Discretionary ETF. (Holding since the
October 2022 lows - I bought more XLY Monday, 8/21.)
I took profits and then reestablished positions as
follows:
SPY – I bought a large position in the S&P 500
Friday, 8/14, in my 401k (it has limited choices).
XLE – Added Tuesday, 8/22.
SSO – 2x S&P 500 ETF. Added 8/24.
MSFT – added 11/16/2023.
TODAY’S COMMENT:
The Rally had been stalled around the 4550 level on the
S&P 500 and has been nerly flat for the last 7 days. Perhaps it broke out
today? Maybe. Maybe not.
The overbought signal from the Overbought/Oversold Index
(Advance/decline Ratio) has been cleared, but other oversold signals remain: RSI
remains overbought - it has been overbought for 10 out of the last 11 trading
sessions; and Last hour action is overbought.
On the bullish side, Breadth is improving and 50-dMA of
issues advancing on the NYSE is now above 50%. That clears 2 bear signals.
Higher prices ahead? I think so. As I’ve suggested previously, I think the
S&P 500 can go up another 5% or so in December and that would push the
Index to new All-Time-Highs and end the Bear Market that has lasted 480 trading-sessions
and counting. At that point, the question will be, “What’s next?” We’ll just
have to check the indicators when the markets get there, if they get there.
A check of the Preliminary Friday Indicator Summary numbers
show that there are now (about) 18 Bull and 6 Bear signals. That’s a good
bullish sign.
Volume was high today, about 10% above this month’s
average. It’s most likely due to money-managers making month-end moves. Unchanged
volume was high, too. As I’ve often
said, many believe that this indicator suggests investor confusion at market
turning points. Since the signal is often wrong, it’s not in my system as an
indicator, so for now, I’ll pay attention, but not worry. As noted above, there
are plenty of reliable bull signs.
The daily spread of 20 Indicators (Bulls minus Bears) declined
from zero to -1 (a positive number is bullish; negatives are bearish); the
10-day smoothed sum that smooths the daily fluctuations declined from +47
to +37. (The trend direction is more important than the actual number for the
10-day value.) These numbers sometimes change after I post the blog based on
data that comes in late. Most of these 20 indicators are short-term so they
tend to bounce around a lot.
LONG-TERM INDICATOR: The Long Term NTSM indicator remained
BUY: PRICE & VIX are bullish; VOLUME & SENTIMENT are neutral.
(The important major BUY in this indicator was on 21
October 2022, 7-days after the bear-market bottom. For my NTSM overall signal,
I suggested that a short-term buying opportunity occurred on 27 September
(based on improved market internals on the retest), although without market
follow-thru, I was unwilling to call a buy; however, I did close shorts and
increased stock holdings. I issued a Buy-Signal on 4 October, 6-days before the
final bottom, based on stronger market action that confirmed the market internals
signal. The NTSM sell-signal was issued 21 December, 9 sessions before the high
of this recent bear market, based on the bearish “Friday Rundown” of
indicators.)
BOTTOM LINE
I remain bullish.
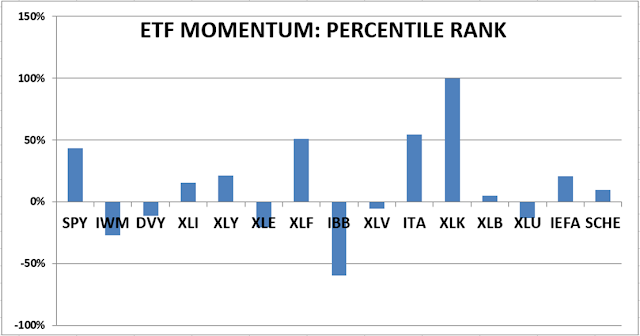
ETF - MOMENTUM ANALYSIS:
TODAY’S RANKING OF 15 ETFs (Ranked Daily)
ETF ranking follows:
The top ranked ETF receives
100%. The rest are then ranked based on their momentum relative to the leading
ETF.
*For additional background on
the ETF ranking system see NTSM Page at…
http://navigatethestockmarket.blogspot.com/p/exchange-traded-funds-etf-ranking.html
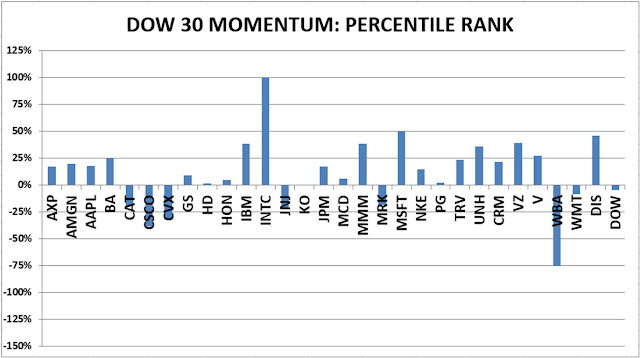
DOW STOCKS - TODAY’S MOMENTUM RANKING
OF THE DOW 30 STOCKS (Ranked Daily)
DOW 30 momentum ranking
follows:
The top ranked Stock receives
100%. The rest are then ranked based on their momentum relative to the leading Stock.
For more details, see NTSM
Page at…
https://navigatethestockmarket.blogspot.com/p/a-system-for-trading-dow-30-stocks-my_8.html
THURSDAY MARKET INTERNALS
(NYSE DATA)
My basket of Market Internals remained HOLD. (My basket of Market
Internals is a decent trend-following analysis of current market action, but
should not be used alone for short term trading. They are most useful when they
diverge from the Index.)
...My current invested
position is about 75% stocks, including stock mutual funds and ETFs. I’m
usually about 50% invested in stocks. I’m “over invested” now expecting new,
all-time highs this year. That burns all the cash. I have about 25% of the portfolio in bonds.
I trade about 15-20% of the
total portfolio using the momentum-based analysis I provide here. When I see a
definitive bottom, I add a lot more stocks to the portfolio using an S&P
500 ETF as I did back in October.
“Trade what you see; not what you think.” – The Old Fool,
Richard McCranie, trader extraordinaire.
“One of the inane things that’s taught in modern
university education is that a vast diversification is absolutely mandatory in
investing in common stocks ...That is an insane idea. It’s not that easy to
have a vast plethora of good opportunities that are easily identified. And if
you’ve only got three, I’d rather be in my best ideas instead of my worst.”
Charlie Munger, vice chairman of Berkshire Hathaway. Charles Munger passed
away, Tuesday at the age of 99.
“Gross Domestic Product (GDP). GDP is
simply the total amount of spending in an economy. GDP, as currently measured,
does not distinguish between “good” spending and “bad” spending. GDP does not
distinguish between consumption spending and investment spending. GDP also does
not distinguish whether spending is generated by existing wealth, by going into
debt temporarily, or by going into debt permanently. In this world, every dollar
spent on education or new means of production, is counted the same as every
dollar spent on epic bachelor parties and video games.” – Michael Lebowitz,
Real Investment Advice
GDP - 2ND ESTIMATE
/ FED BEIGE BOOK (Kiplinger)
“...the U.S. economy grew at a faster pace than
previously thought in the third quarter [ending in September]. Specifically, Q3
gross domestic product (GDP) came in at
5.2% vs the initial 4.9% estimate... The Fed's Beige Book was also released today, and it showed declines in
economic conditions in half of the central bank's 12 districts between October
6 and November 17. ‘Obviously a more somber report than the GDP numbers we saw
this morning," says Alex McGrath,
chief investment officer for NorthEnd Private Wealth. ‘Based on these readings,
it would appear that we have already entered a mild recession that
many have been predicting for a year," even as it runs counter to other
data we've seen.’” Story at...
https://www.kiplinger.com/investing/stocks/stock-market-today-stocks-give-back-gdp-gains-after-beige-book
EIA CRUDE INVENTORIES
U.S. commercial crude oil inventories (excluding those in
the Strategic Petroleum Reserve) increased by 1.6 million barrels from the
previous week. At 449.7 million barrels, U.S. crude oil inventories are
slightly above the five year average for this time of year.
https://ir.eia.gov/wpsr/wpsrsummary.pdf
MARKET REPORT / ANALYSIS
-Wednesday the S&P 500 slipped about 0.1% to 4551.
-VIX rose about 2% to 12.98.
-The yield on the 10-year Treasury slipped to 4.259%.
PULLBACK DATA:
-Drop from Top: 5.1%. 25.4% max (on a closing basis).
-Trading Days since All-Time Top: 479-days. (The top was
3 January 2022.)
The S&P 500 is 6.3% ABOVE its 200-dMA and 4.6% ABOVE
its 50-dMA.
*I won’t call the correction over until the S&P 500
makes a new-high; however, evidence suggests the major bear-market bottom (25%
decline) was in the 3600 area and we called a buy on 4 October 2022.
MY TRADING POSITIONS:
XLK – Technology ETF (holding since the October 2022
lows).
XLY - Consumer Discretionary ETF. (Holding since the
October 2022 lows - I bought more XLY Monday, 8/21.)
I took profits and then reestablished positions as
follows:
SPY – I bought a large position in the S&P 500
Friday, 8/14, in my 401k (it has limited choices).
XLE – Added Tuesday, 8/22.
SSO – 2x S&P 500 ETF. Added 8/24.
MSFT – added 11/16/2023.
TODAY’S COMMENT:
The daily spread of 20 Indicators (Bulls minus Bears) declined
from +5 to zero (a positive number is bullish; negatives are bearish); the
10-day smoothed sum that smooths the daily fluctuations declined from +57
to +47. (The trend direction is more important than the actual number for the
10-day value.) These numbers sometimes change after I post the blog based on
data that comes in late. Most of these 20 indicators are short-term so they
tend to bounce around a lot.
LONG-TERM INDICATOR: The Long Term NTSM indicator improved
to BUY: PRICE & VIX are bullish; VOLUME & SENTIMENT are neutral.
(The important major BUY in this indicator was on 21
October 2022, 7-days after the bear-market bottom. For my NTSM overall signal,
I suggested that a short-term buying opportunity occurred on 27 September
(based on improved market internals on the retest), although without market
follow-thru, I was unwilling to call a buy; however, I did close shorts and
increased stock holdings. I issued a Buy-Signal on 4 October, 6-days before the
final bottom, based on stronger market action that confirmed the market internals
signal. The NTSM sell-signal was issued 21 December, 9 sessions before the high
of this recent bear market, based on the bearish “Friday Rundown” of
indicators.)
BOTTOM LINE
I remain bullish.
ETF - MOMENTUM ANALYSIS:
TODAY’S RANKING OF 15 ETFs (Ranked Daily)
ETF ranking follows:
The top ranked ETF receives
100%. The rest are then ranked based on their momentum relative to the leading
ETF.
*For additional background on
the ETF ranking system see NTSM Page at…
http://navigatethestockmarket.blogspot.com/p/exchange-traded-funds-etf-ranking.html
DOW STOCKS - TODAY’S MOMENTUM RANKING
OF THE DOW 30 STOCKS (Ranked Daily)
DOW 30 momentum ranking follows:
The top ranked Stock receives
100%. The rest are then ranked based on their momentum relative to the leading Stock.
For more details, see NTSM
Page at…
https://navigatethestockmarket.blogspot.com/p/a-system-for-trading-dow-30-stocks-my_8.html
WEDNESDAY MARKET INTERNALS
(NYSE DATA)
My basket of Market Internals remained HOLD. (My basket of Market
Internals is a decent trend-following analysis of current market action, but
should not be used alone for short term trading. They are most useful when they
diverge from the Index.)
...My current invested
position is about 75% stocks, including stock mutual funds and ETFs. I’m
usually about 50% invested in stocks. I’m “over invested” now expecting new,
all-time highs this year. That burns all the cash. I have about 25% of the portfolio in bonds.
I trade about 15-20% of the
total portfolio using the momentum-based analysis I provide here. When I see a
definitive bottom, I add a lot more stocks to the portfolio using an S&P
500 ETF as I did back in October.
“Trade what you see; not what you think.” – The Old Fool,
Richard McCranie, trader extraordinaire.
“In their appeal against the Colorado lawsuit [to remove
Trump from the ballot for insurrection] Trump's lawyers [stated] that Trump
technically did not swear an oath to "support" the Constitution.
Instead, during his January 2017 inauguration, Trump swore to "preserve,
protect and defend" the Constitution during his role as president.”
My cmt: No wait, I didn’t say this...
"Wow in a legal proceeding Trump is now arguing he
didn't violate the 14th Amendment by inciting the Jan 6 insurrection because he
'never took an oath to support the Constitution of the United States.' This
treacherous criminal is head of the Republican Party." - Democratic New
Jersey Congressman Bill Pascrell
From...
Donald
Trump Says He Never Swore Oath 'to Support the Constitution' (msn.com)
If you are a Democrat and your state allows you to vote
in the Republican primary (as does Virginia), please crossover and vote for
Nikki Haley in the primary. We need to keep this nut case (Trump) off the
Presidential Ballot. Since Trump would then run as an independent, a Democratic
candidate would then be a shoe-in. Trump would split the Republican vote, thus getting
his revenge on the Rino Republicans (as he calls anyone who doesn’t support him).
I support any move that will get rid of Trump.
FYI: As a Civil Servant working for the Department of
Defense my oath was (in part) ...
“I will support and defend the Constitution of the United
States against all enemies, foreign and domestic; that I will bear true faith
and allegiance to the same; that I take this obligation freely, without any
mental reservation or purpose of evasion; and that I will well and faithfully
discharge the duties of the ...”
Thus, from my perspective, Trump is a domestic enemy of
the Constitution for attempting to overturn an election that he clearly lost -
I can never support him.
CONSUMER CONFIDENCE (Conference Board)
"’Consumer confidence increased in November,
following three consecutive months of decline,’ said Dana Peterson, Chief Economist at The Conference
Board. ‘This improvement reflected a recovery in the Expectations
Index, while the Present Situation Index was largely unchanged.
November's increase in consumer confidence was concentrated primarily among
householders aged 55 and up; by contrast, confidence among householders aged
35-54 declined slightly. General improvements were seen across the spectrum of
income groups surveyed in November. Nonetheless, write-in responses revealed
consumers remain preoccupied with rising prices in general, followed by
war/conflicts and higher interest rates.’" Press release at...
https://www.prnewswire.com/news-releases/us-consumer-confidence-increased-in-november-301999321.html
MARKET REPORT / ANALYSIS
-Tuesday the S&P 500 rose about 0.1% to 4555.
-VIX was unchanged at 12.69.
-The yield on the 10-year Treasury slipped to 4.323%.
PULLBACK DATA:
-Drop from Top: 5%. 25.4% max (on a closing basis).
-Trading Days since All-Time Top: 478-days. (The top was
3 January 2022.)
The S&P 500 is 6.4% ABOVE its 200-dMA and 4.7% ABOVE
its 50-dMA.
*I won’t call the correction over until the S&P 500
makes a new-high; however, evidence suggests the major bear-market bottom (25%
decline) was in the 3600 area and we called a buy on 4 October 2022.
MY TRADING POSITIONS:
XLK – Technology ETF (holding since the October 2022
lows).
XLY - Consumer Discretionary ETF. (Holding since the
October 2022 lows - I bought more XLY Monday, 8/21.)
I took profits and then reestablished positions as
follows:
SPY – I bought a large position in the S&P 500
Friday, 8/14, in my 401k (it has limited choices).
XLE – Added Tuesday, 8/22.
SSO – 2x S&P 500 ETF. Added 8/24.
MSFT – added 11/16/2023.
TODAY’S COMMENT:
Not much different today: The Smart Money overbought
indicator, RSI, and the # up-days over the last month all remain
overbought. (As of today, the
Overbought/Oversold index is not overbought.) These are still suggesting
weakness could last a bit longer. There are still plenty of bullish indicators,
so I am not concerned. It looks like a normal pause or a flattening of the
uptrend.
Today, (Tuesday) unchanged volume was very high. As I’ve
often said, many believe that this indicator suggests investor confusion at
market turning points. It is suggesting some downside ahead, but the signal is
often wrong. It’s not in my system as an indicator, so for now, I’ll pay
attention, but not worry. As noted above, there are still reliable bull signs
in the indicators.
The daily spread of 20 Indicators (Bulls minus Bears) remained
+5 (a positive number is bullish; negatives are bearish); the 10-day smoothed
sum that smooths the daily fluctuations declined from +58 to +57. (The
trend direction is more important than the actual number for the 10-day value.)
These numbers sometimes change after I post the blog based on data that comes
in late. Most of these 20 indicators are short-term so they tend to bounce
around a lot.
LONG-TERM INDICATOR: The Long Term NTSM indicator remained
HOLD: VOLUME & VIX are bullish; PRICE & SENTIMENT are neutral.
(The important major BUY in this indicator was on 21
October 2022, 7-days after the bear-market bottom. For my NTSM overall signal,
I suggested that a short-term buying opportunity occurred on 27 September
(based on improved market internals on the retest), although without market
follow-thru, I was unwilling to call a buy; however, I did close shorts and
increased stock holdings. I issued a Buy-Signal on 4 October, 6-days before the
final bottom, based on stronger market action that confirmed the market internals
signal. The NTSM sell-signal was issued 21 December, 9 sessions before the high
of this recent bear market, based on the bearish “Friday Rundown” of
indicators.)
BOTTOM LINE
I remain bullish.
ETF - MOMENTUM ANALYSIS:
TODAY’S RANKING OF 15 ETFs (Ranked Daily)
ETF ranking follows:
The top ranked ETF receives
100%. The rest are then ranked based on their momentum relative to the leading
ETF.
*For additional background on
the ETF ranking system see NTSM Page at…
http://navigatethestockmarket.blogspot.com/p/exchange-traded-funds-etf-ranking.html
DOW STOCKS - TODAY’S MOMENTUM RANKING
OF THE DOW 30 STOCKS (Ranked Daily)
DOW 30 momentum ranking
follows:
The top ranked Stock receives
100%. The rest are then ranked based on their momentum relative to the leading Stock.
For more details, see NTSM
Page at…
https://navigatethestockmarket.blogspot.com/p/a-system-for-trading-dow-30-stocks-my_8.html
TUESDAY MARKET INTERNALS (NYSE
DATA)
My basket of Market Internals remained HOLD. (My basket of Market
Internals is a decent trend-following analysis of current market action, but
should not be used alone for short term trading. They are most useful when they
diverge from the Index.)
...My current invested
position is about 75% stocks, including stock mutual funds and ETFs. I’m
usually about 50% invested in stocks. I’m “over invested” now expecting new,
all-time highs this year. That burns all the cash. I have about 25% of the portfolio in bonds.
I trade about 15-20% of the
total portfolio using the momentum-based analysis I provide here. When I see a
definitive bottom, I add a lot more stocks to the portfolio using an S&P
500 ETF as I did back in October.
“Trade what you see; not what you think.” – The Old Fool,
Richard McCranie, trader extraordinaire.
MORE FAKE ELECTOR CHARGES FOR TRUMP? (The Independent)
“Four swing-states are reportedly still investigating the
slates of so-called ‘fake electors’ which Donald Trump allegedly
hoped to use to falsely certify that he had won the 2020 election...
It hinged on then-Vice President Mike Pence choosing to certify the slates of
Trump-loyalist ‘fake’ electors in swing-states... On the day of the
certification, 6 January 2021, Mr. Pence penned a letter refusing to go along
with the plot, saying his ‘oath to support and defend the Constitution
constrains me from claiming unilateral authority to determine which electoral
votes should be counted and which should not.’” Story at...
Trump
could face more criminal charges over ‘fake electors’ scam, report says
(msn.com)
My cmt: This was the real insurrection - a seditious
conspiracy to steal the election. Can you imagine if the Democrats had tried a
scheme like this? Hannity, Clay Travis and Buck Sexton and the rest of the
right-wing, media wackos would be apoplectic. I find this all depressing since
I lean to the right and voted for Trump in 2020 – never again! Trump is a
criminal. Given that some of Trump’s co-conspirators have already pled guilty
in Georgia, Trump may be inaugurated in jail.
"You lost. You're guilty. Welcome to Columbia,
Donald. - Sponsored by the league of radical leftist vermin - Jay Bender
Instigator.” Billboards in Columbia, SC greeting “The Donald” on his visit.
NEW HOME SALES (CNN)
“New home sales in the United States fell in October as
typical mortgage rates reached their highest levels this year. Sales of newly
constructed homes fell 5.6% in October... Sales were up 17.7% from a year ago.”
Story at...
https://www.cnn.com/2023/11/27/business/new-home-sales-drop-in-october-amid-higher-mortgage-rates/index.html
MARKET REPORT / ANALYSIS
-Monday the S&P 500 dipped about 0.2% to 4550.
-VIX rose about 2% to 12.69.
-The yield on the 10-year Treasury rose to 4.398%.
PULLBACK DATA:
-Drop from Top: 5.1%. 25.4% max (on a closing basis).
-Trading Days since All-Time Top: 477-days. (The top was
3 January 2022.)
The S&P 500 is 6.4% ABOVE its 200-dMA and 4.7%
ABOVE its 50-dMA.
*I won’t call the correction over until the S&P 500
makes a new-high; however, evidence suggests the major bear-market bottom (25%
decline) was in the 3600 area and we called a buy on 4 October 2022.
MY TRADING POSITIONS:
XLK – Technology ETF (holding since the October 2022
lows).
XLY - Consumer Discretionary ETF. (Holding since the
October 2022 lows - I bought more XLY Monday, 8/21.)
I took profits and then reestablished positions as
follows:
SPY – I bought a large position in the S&P 500
Friday, 8/14, in my 401k (it has limited choices).
XLE – Added Tuesday, 8/22.
SSO – 2x S&P 500 ETF. Added 8/24.
MSFT – added 11/16/2023.
TODAY’S COMMENT:
Breadth continues to slowly improve. The 100-dMA of issues advancing on the NYSE
popped above zero today, canceling another one of our bear indicators.
Today, there was a Bearish Outside Reversal signal on the
S&P 500. Today’s high and low both exceeded Friday’s high and low. This can
sometime signal a reversal down since today’s close was lower. Friday was a very low-volume, trading-day
without much range. I think this signal is skewed by the low range on Friday
and is probably not signaling a significant trend change now; I’ll ignore it.
The Smart Money overbought indicator, RSI, and the #
up-days over the last month all remain overbought. (As of today, the Overbought/Oversold index
is not overbought.) These are still suggesting weakness could last a bit
longer. There are still plenty of bullish indicators, so I am not concerned
about a normal flattening of the uptrend.
The daily spread of 20 Indicators (Bulls minus Bears) declined
from +8 to +5 (a positive number is bullish; negatives are bearish); the 10-day
smoothed sum that smooths the daily fluctuations declined from +59 to +58.
(The trend direction is more important than the actual number for the 10-day
value.) These numbers sometimes change after I post the blog based on data that
comes in late. Most of these 20 indicators are short-term so they tend to
bounce around a lot.
LONG-TERM INDICATOR: The Long Term NTSM indicator slipped
to HOLD: VOLUME & VIX are bullish; PRICE & SENTIMENT are neutral.
(The important major BUY in this indicator was on 21
October 2022, 7-days after the bear-market bottom. For my NTSM overall signal,
I suggested that a short-term buying opportunity occurred on 27 September
(based on improved market internals on the retest), although without market
follow-thru, I was unwilling to call a buy; however, I did close shorts and
increased stock holdings. I issued a Buy-Signal on 4 October, 6-days before the
final bottom, based on stronger market action that confirmed the market internals
signal. The NTSM sell-signal was issued 21 December, 9 sessions before the high
of this recent bear market, based on the bearish “Friday Rundown” of
indicators.)
BOTTOM LINE
I remain bullish.
ETF - MOMENTUM ANALYSIS:
TODAY’S RANKING OF 15 ETFs (Ranked Daily)
ETF ranking follows:
The top ranked ETF receives
100%. The rest are then ranked based on their momentum relative to the leading
ETF.
*For additional background on
the ETF ranking system see NTSM Page at…
http://navigatethestockmarket.blogspot.com/p/exchange-traded-funds-etf-ranking.html
DOW STOCKS - TODAY’S MOMENTUM RANKING
OF THE DOW 30 STOCKS (Ranked Daily)
DOW 30 momentum ranking
follows:
The top ranked Stock receives
100%. The rest are then ranked based on their momentum relative to the leading Stock.
For more details, see NTSM
Page at…
https://navigatethestockmarket.blogspot.com/p/a-system-for-trading-dow-30-stocks-my_8.html
MONDAY MARKET INTERNALS (NYSE
DATA)
My basket of Market Internals declined to HOLD. (My basket of Market
Internals is a decent trend-following analysis of current market action, but
should not be used alone for short term trading. They are most useful when they
diverge from the Index.)
...My current invested
position is about 75% stocks, including stock mutual funds and ETFs. I’m
usually about 50% invested in stocks. I’m “over invested” now expecting new,
all-time highs this year. That burns all the cash. I have about 25% of the portfolio in bonds.
I trade about 15-20% of the
total portfolio using the momentum-based analysis I provide here. When I see a
definitive bottom, I add a lot more stocks to the portfolio using an S&P
500 ETF as I did back in October.
S&P GLOBAL COMPOSITE PMI (S&P Global)
“US businesses signalled a further marginal expansion in
output during November, with the rate of growth in business activity in line
with that seen in October. Although manufacturers and service providers
registered another monthly rise in activity, paces of expansion were only
slight overall. Total new orders returned to growth, thereby ending a
three-month sequence of contraction. That said, demand conditions at
manufacturers were unchanged on the month.
Relatively subdued demand conditions and dwindling
backlogs led firms to cut their workforce numbers for the first time since June
2020, as service providers joined goods producers in reducing headcounts... The
headline S&P Global Flash US PMI Composite Output Index posted at 50.7 in
November, matching the figure seen in October. This indicated a marginal rise
in business activity that was the joint-fastest since July.” Press release
at...
https://www.pmi.spglobal.com/Public/Home/PressRelease/b72b9c19b3bd48e78027009aad143044
MARKET REPORT / ANALYSIS
-Friday the S&P 500 rose about 0.1% to 4559.
-VIX dipped about 2% to 12.66.
-The yield on the 10-year Treasury rose to 4.476%.
PULLBACK DATA:
-Drop from Top: 4.9%. 25.4% max (on a closing basis).
-Trading Days since All-Time Top: 476-days. (The top was
3 January 2022.)
The S&P 500 is 6.7% ABOVE its 200-dMA and 4.9%
ABOVE its 50-dMA.
*I won’t call the correction over until the S&P 500
makes a new-high; however, evidence suggests the major bear-market bottom (25%
decline) was in the 3600 area and we called a buy on 4 October 2022.
MY TRADING POSITIONS:
XLK – Technology ETF (holding since the October 2022
lows).
XLY - Consumer Discretionary ETF. (Holding since the
October 2022 lows - I bought more XLY Monday, 8/21.)
I took profits and then reestablished positions as
follows:
SPY – I bought a large position in the S&P 500
Friday, 8/14, in my 401k (it has limited choices).
XLE – Added Tuesday, 8/22.
SSO – 2x S&P 500 ETF. Added 8/24.
MSFT – added 11/16/2023.
TODAY’S COMMENT:
The NYSE closed at 1PM today. Trading was light.
The Overbought/Oversold index, Smart Money overbought
indicator, RSI, and the # of up-days over the last month are all overbought. These
are suggesting at least a down-day Monday and some weakness could last a bit
longer. It’s not a big deal though; the
Friday Summary remains very bullish.
We look at a summary of indicators on Friday. (These
indicators tend to be both long-term and short-term, so they are different than
the 20 that I report on daily.) The weekly rundown of indicators remained
bullish this week: now 8-bear and 20-bull.
BULL SIGNS
-There was a Follow-thru Day 14 November. This cancels all
Distribution Days.
-The smoothed advancing volume on the NYSE is rising.
-The 10-dMA percentage of issues advancing on
the NYSE (Breadth) is above 50%.
-MACD of the percentage of issues advancing on the NYSE
(breadth) made a bullish crossover 12 October.
-Smoothed Buying Pressure minus Selling Pressure.
-MACD of S&P 500 price made a bullish crossover 2
Nov.
-Long-term new-high/new-low data.
-Short-term new-high/new-low data.
-My Money Trend indicator is rising.
-Slope of the 40-dMA of New-highs is rising.
-McClellan Oscillator.
-The graph of the 100-day Count (the 100-day sum of
up-days).
-The Smart Money (late-day action).
-On average, the size of up-moves has been larger than
the size of down-moves over the last month.
-VIX indicator.
-There was a high up-volume day on 14 November. In addition,
there were back-to-back, high up-volume days (80%+) on the NYSE 2 & 3 Nov.
-The 5-day EMA is above the 10-day EMA, so short-term
momentum is bullish.
-The 5-10-20 Timer System is BUY.
-There was a Zweig Breadth Thrust 3 November. That’s a
rare, very-bullish sign, that will remain bullish until the McClellan
Oscillator turns negative.
-75% of the 15-ETFs that I track have been up over the
last 10-days. (45-55% is neutral.)
NEUTRAL
-There have been 2 Statistically-Significant days (big
moves in price-volume) in the last 15-days.
-Sentiment.
-Bollinger Band Squeeze 28 April - expired.
-Bollinger Bands.
-The 50-dMA percentage of issues advancing on the NYSE
(Breadth) has not been below 50%, for more than 3 days in a row.
-Issues advancing on the NYSE (Breadth) compared to the
S&P 500.
-9 November there was a Bearish Outside Reversal Day, but
since the McClellan Oscillator is bullish, I’ll call this one neutral.
-There was a New-high/New-low spread reversal on 4 October
(based on std deviation of spread). - Expired
-The S&P 500 is 6.7% above its 200-dMA. (Bear
indicator is 12% above the 200-day.)
-The short-term, 10-day EMA, Fosback Hi-Low Logic Index.
-The long-term, 50-dEMA, Fosback Hi-Low Logic Index.
-There were Hindenburg Omen signals 11 & 12 Sept 2023
– expired. The McClellan Oscillator turned positive.
-There have been 8 up-days over the last 10 sessions.
-The Calm-before-the-Storm/Panic Indicator flashed a top
warning signal 15 Sept., but it may well have been a bottom signal. - Expired
-2.8% of all issues traded on the NYSE made new, 52-week
highs when the S&P 500 made a new all-time-high, 3 January 2022. (There is
no bullish signal for this indicator.) This indicated that the advance was too
narrow and a correction was likely to be >10%. It proved correct, but is now
Expired.
BEAR SIGNS
-Overbought/Oversold Index (Advance/Decline Ratio).
-The 50-dMA percentage of issues advancing on the NYSE
(Breadth) is below 50%
-The 100-dMA percentage of issues advancing on
the NYSE (Breadth) is below 50%
-RSI.
-There have been 16 up-days over the last 20 sessions –
overbought.
-Smart Money is bullish, but overbought
-S&P 500 spread vs. Utilities (XLU-ETF).
-XLI-ETF (Cyclical Industrials) vs the S&P 500.
On Monday’s update of the Friday summary of indicators (20
December 2021), 9 days before the top of the current 25% correction, there were
21 bear-signs and zero bull-signs. Now there are 8 bear-signs and 20-Bull.
Last week, there were 7 bear-sign and 17 bull-signs.
I have worked on automating the Friday Summary of
Indicators, but some of them are difficult to code and I haven’t finished yet.
Here’s a preliminary chart of the Friday Summary plotted on a daily basis. The
red curve is the spread of indicators (bulls minus bears) and the green curve
is a 10-dMA. We can see that the indicators “called the bottom” as they
diverged and made higher lows (green circles) while the S&P 500 made a
lower low (black circles).
The daily spread of 20 Indicators (Bulls minus Bears) improved
from +6 to +8 (a positive number is bullish; negatives are bearish); the 10-day
smoothed sum that smooths the daily fluctuations improved from +55 to +59.
(The trend direction is more important than the actual number for the 10-day
value.) These numbers sometimes change after I post the blog based on data that
comes in late. Most of these 20 indicators are short-term so they tend to
bounce around a lot.
LONG-TERM INDICATOR: The Long Term NTSM indicator slipped
to HOLD: VOLUME & VIX are bullish; PRICE & SENTIMENT are neutral.
(The important major BUY in this indicator was on 21
October 2022, 7-days after the bear-market bottom. For my NTSM overall signal,
I suggested that a short-term buying opportunity occurred on 27 September
(based on improved market internals on the retest), although without market
follow-thru, I was unwilling to call a buy; however, I did close shorts and
increased stock holdings. I issued a Buy-Signal on 4 October, 6-days before the
final bottom, based on stronger market action that confirmed the market internals
signal. The NTSM sell-signal was issued 21 December, 9 sessions before the high
of this recent bear market, based on the bearish “Friday Rundown” of
indicators.)
BOTTOM LINE
I remain bullish.
ETF - MOMENTUM ANALYSIS:
TODAY’S RANKING OF 15 ETFs (Ranked Daily)
ETF ranking follows:
The top ranked ETF receives
100%. The rest are then ranked based on their momentum relative to the leading
ETF.
*For additional background on
the ETF ranking system see NTSM Page at…
http://navigatethestockmarket.blogspot.com/p/exchange-traded-funds-etf-ranking.html
DOW STOCKS - TODAY’S MOMENTUM RANKING
OF THE DOW 30 STOCKS (Ranked Daily)
DOW 30 momentum ranking
follows:
The top ranked Stock receives
100%. The rest are then ranked based on their momentum relative to the leading Stock.
For more details, see NTSM
Page at…
https://navigatethestockmarket.blogspot.com/p/a-system-for-trading-dow-30-stocks-my_8.html
FRIDAY MARKET INTERNALS (NYSE
DATA)
My basket of Market Internals remained BUY. (My basket of Market
Internals is a decent trend-following analysis of current market action, but
should not be used alone for short term trading. They are most useful when they
diverge from the Index.)
...My current invested
position is about 75% stocks, including stock mutual funds and ETFs. I’m
usually about 50% invested in stocks. I’m “over invested” now expecting new,
all-time highs this year. That burns all the cash. I have about 25% of the portfolio in bonds.
I trade about 15-20% of the
total portfolio using the momentum-based analysis I provide here. When I see a
definitive bottom, I add a lot more stocks to the portfolio using an S&P
500 ETF as I did back in October.
“The Biden administration releases $10 billion to Iran
while talks to release 50 of the 240 hostages that Hamas is holding continue.”
Michael Ramirez. Commenary at...
https://michaelpramirez.com/index.html
HAVE A GREAT THANKSGIVING HOLIDAY!
“Trade what you see; not what you think.” – The Old Fool,
Richard McCranie, trader extraordinaire.
JOBLESS CLAIMS (Reuters)
“The number of Americans filing new claims for
unemployment benefits fell more than expected last week, but that likely does
not change the view that the labor market is gradually slowing as higher
interest rates cool demand in the economy... Initial claims for state
unemployment benefits dropped 24,000 to a seasonally adjusted 209,000 for the
week ended Nov. 18.” Story at...
https://www.reuters.com/markets/us/us-weekly-jobless-claims-fall-labor-market-still-slowing-2023-11-22/
DURABLE ORDERS (RTT News)
“After reporting a spike in new orders for U.S.
manufactured durable goods in the previous month, the Commerce Department
released a report on Wednesday showing durable goods orders pulled back by much
more than expected in the month of October. The Commerce Department said
durable goods orders plunged by 5.4 percent in October...” Story at...
https://www.rttnews.com/3407142/u-s-durable-goods-orders-tumble-amid-sharp-pullback-in-aircraft-demand.aspx
CRUDE INVENTORIES (EIA)
“U.S. commercial crude oil inventories (excluding those
in the Strategic Petroleum Reserve) increased by 8.7 million barrels from the
previous week. At 448.1 million barrels, U.S. crude oil inventories are about
1% below the five year average for this time of year.” Report at...
https://ir.eia.gov/wpsr/wpsrsummary.pdf
MARKET REPORT / ANALYSIS
-Wednesday the S&P 500 rose about 0.4% to 4557.
-VIX dipped about 4% to 12.85.
-The yield on the 10-year Treasury rose slightly to 4.408%.
PULLBACK DATA:
-Drop from Top: 5%. 25.4% max (on a closing basis).
-Trading Days since All-Time Top: 475-days. (The top was
3 January 2022.)
The S&P 500 is 6.6% ABOVE its 200-dMA and 4.9%
ABOVE its 50-dMA.
*I won’t call the correction over until the S&P 500
makes a new-high; however, evidence suggests the major bear-market bottom (25%
decline) was in the 3600 area and we called a buy on 4 October 2022.
MY TRADING POSITIONS:
XLK – Technology ETF (holding since the October 2022
lows).
XLY - Consumer Discretionary ETF. (Holding since the
October 2022 lows - I bought more XLY Monday, 8/21.)
I took profits and then reestablished positions as
follows:
SPY – I bought a large position in the S&P 500
Friday, 8/14, in my 401k (it has limited choices).
XLE – Added Tuesday, 8/22.
SSO – 2x S&P 500 ETF. Added 8/24.
MSFT – added 11/16/2023.
TODAY’S COMMENT:
Pundits keep cautioning about the narrow advance in the
stock markets and that the markets are being carried by the magnificent seven.
I suspect those investors are looking at the number of issues making new-highs.
Over the last 10 trading sessions, on average, only 2.4% of issues on the NYSE
are making new all-time, 52-week highs.
That’s a low number and it certainly would be concerning if the S&P 500 was
also making a new-all-time high. Since the S&P 500 isn’t, and we know there
has been significant weakness not too long ago, I prefer to look at other
measures of breadth.
The 150-dMA of issues advancing on the NYSE has been
headed higher and is now 50%, meaning that half of the issues on the NYSE have
been going up over the last 7-1/2 months.
That tends to approximate the advance-decline line and it is suggesting
that conditions aren’t as bad as the new-high numbers would have us believe.
Other shorter-term measures (50-dMA and the 100-dMA) are improving. If that
continues, markets will make new, all-time highs. A Santa Clause rally, starting
now, should get us there. The S&P 500 is only 5% below its all-time high.
If new-52-week high numbers remain low while markets are
making new, all-time-highs, then we have an issue to worry about.
The daily spread of 20 Indicators (Bulls minus Bears) remained
+6 (a positive number is bullish; negatives are bearish); the 10-day smoothed
sum that smooths the daily fluctuations declined from +57 to +55. (The
trend direction is more important than the actual number for the 10-day value.)
These numbers sometimes change after I post the blog based on data that comes
in late. Most of these 20 indicators are short-term so they tend to bounce
around a lot.
LONG-TERM INDICATOR: The Long Term NTSM indicator
remained BUY: PRICE, VOLUME & VIX are bullish; SENTIMENT is neutral.
(The important major BUY in this indicator was on 21
October 2022, 7-days after the bear-market bottom. For my NTSM overall signal,
I suggested that a short-term buying opportunity occurred on 27 September
(based on improved market internals on the retest), although without market
follow-thru, I was unwilling to call a buy; however, I did close shorts and
increased stock holdings. I issued a Buy-Signal on 4 October, 6-days before the
final bottom, based on stronger market action that confirmed the market internals
signal. The NTSM sell-signal was issued 21 December, 9 sessions before the high
of this recent bear market, based on the bearish “Friday Rundown” of
indicators.)
BOTTOM LINE
I remain bullish.
ETF - MOMENTUM ANALYSIS:
TODAY’S RANKING OF 15 ETFs (Ranked Daily)
ETF ranking follows:
The top ranked ETF receives
100%. The rest are then ranked based on their momentum relative to the leading
ETF.
*For additional background on
the ETF ranking system see NTSM Page at…
http://navigatethestockmarket.blogspot.com/p/exchange-traded-funds-etf-ranking.html
DOW STOCKS - TODAY’S MOMENTUM RANKING
OF THE DOW 30 STOCKS (Ranked Daily)
DOW 30 momentum ranking
follows:
The top ranked Stock receives
100%. The rest are then ranked based on their momentum relative to the leading Stock.
For more details, see NTSM
Page at…
https://navigatethestockmarket.blogspot.com/p/a-system-for-trading-dow-30-stocks-my_8.html
WEDNESDAY MARKET INTERNALS
(NYSE DATA)
My basket of Market Internals remained BUY. (My basket of Market
Internals is a decent trend-following analysis of current market action, but
should not be used alone for short term trading. They are most useful when they
diverge from the Index.)
...My current invested
position is about 75% stocks, including stock mutual funds and ETFs. I’m
usually about 50% invested in stocks. I’m “over invested” now expecting new,
all-time highs this year. That burns all the cash. I have about 25% of the portfolio in bonds.
I trade about 15-20% of the
total portfolio using the momentum-based analysis I provide here. When I see a
definitive bottom, I add a lot more stocks to the portfolio using an S&P
500 ETF as I did back in October.