https://michaelpramirez.com/index.html
“Companies sharply slowed the pace of hiring in August amid growing fears of an economic slowdown, according to payroll processing company ADP. Private payrolls grew by just 132,000 for the month, a deceleration from the 268,000 gain in July...” Story at...
https://www.cnbc.com/2022/08/31/adp-jobs-report-private-payrolls-grew-by-just-132000-in-august.html
“The latest Chicago Purchasing Manager's Index, or the Chicago Business Barometer, inched up to 52.2 in August from 52.1 in July, which is still in expansion territory. Values above 50.0 indicate expanding manufacturing activity.” Commentary at...
https://www.advisorperspectives.com/dshort/updates/2022/08/31/chicago-pmi-mostly-unchanged-in-august
“U.S. commercial crude oil inventories (excluding those in the Strategic Petroleum Reserve) decreased by 3.3 million barrels from the previous week. At 418.3 million barrels, U.S. crude oil inventories are about 6% below the five year average for this time of year.” Report at...
https://ir.eia.gov/wpsr/wpsrsummary.pdf
“The path for stocks from here will be determined by earnings, where we still see material downside,’ Morgan Stanley strategists wrote in a commentary cited by Bloomberg. ‘As a result, equity investors should be laser focused on this risk, not the Fed.’ Meanwhile, the S&P 500’s forward price-earnings multiple trailed its five-year average, but exceeded its 10-year average as of Aug. 5: 17.5 versus 18.6 and 17, according to FactSet. A high price-earnings multiple can point to lower stock prices ahead.” Story at...
https://www.thestreet.com/investing/stocks-may-be-headed-for-a-major-skid?puc=yahoo&cm_ven=YAHOO
“Mark Hulbert on MarketWatch pointed out that money can be made by betting on the timing of the Fed’s so-called pivot, or when central bank policymakers end interest rate hikes. Based on the previous six distinct rate-hike cycles since the Fed began focusing on the Fed funds rate, the S&P 500 reached its low an average of 57 days before the end of the central bank’s rate-hike cycle, according to Hulbert...Given the uncertainty over the timing, investors could take a dollar-cost average approach to raise equity exposure before achieving their target exposure. While you won’t get the maximum return, one shouldn’t rely on accurately predicting a low.” Commentary at...
https://www.etftrends.com/keep-an-eye-on-stock-etfs-as-the-fed-eventually-ends-the-rate-hike-cycle/
Ok, but I’ll try and call the bottom. I can’t guess when the Fed will pivot. We try to follow investors. Curiously, I had previously heard a commentator on CNBC who said bottoms are made when the FED stops hiking.
-Wednesday the S&P 500 fell about 0.8% to 3955.
-VIX dropped (??!!) about 1% to 25.87. (Maybe the Options Folks think a bounce is due?)
-The yield on the 10-year Treasury rose to 3.194%.
-Drop from Top: 17.5% as of today. 23.6% max.
-Trading Days since Top: 166-days.
The S&P 500 is 8% Below its 200-dMA & 1.5% Below its 50-dMA.
- Support points for the rally are around 3900, the early July highs, and the prior correction low of 3667. We will test the prior correctio low.
SH, short the S&P 500 ETF.
SDS, 2x short S&P 500 ETF.
I have built these positions to significantly large values, although I am still not net short.
There have only been 3 up days in the last 10 and 7 in the last 20. The S&P 500 has dropped precipitously over the last 11 days with only 3 up-days. Wednesday was the 4th down day in a row. That’s usually a bullish indication. Markets don’t go down forever. But, as Jeffrey Saut wrote during another correction several years ago, “we could be in one of these ‘selling stampedes’ that tend to last 17 – 25 sessions, with only 1.5- to three-day pauses/throwback rallies, before they exhaust themselves on the downside.” Saut noted, “...that once the markets get into one of these weekly downside skeins, they rarely bottom on a Friday. Nope, they typically give participants over the weekend to brood about their losses and then they show up the next Monday in sell mode leading to Turning Tuesday.”
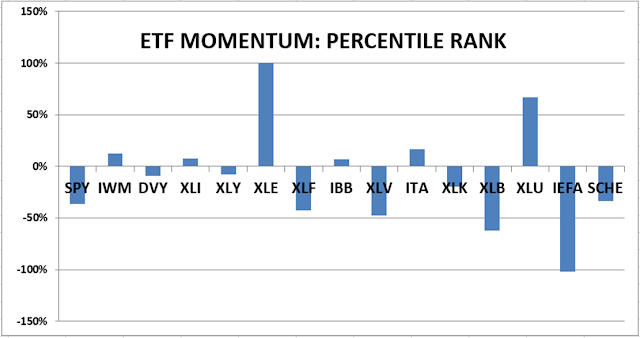
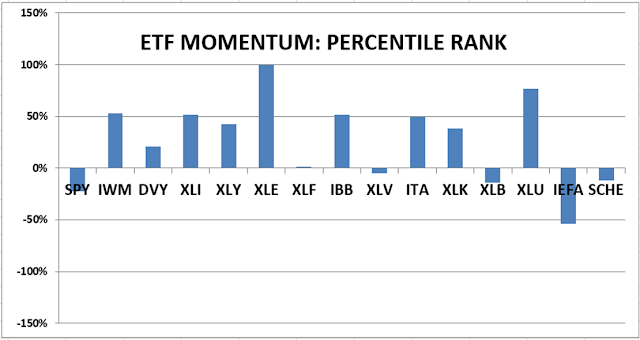
TODAY’S RANKING OF 15 ETFs (Ranked Daily)

*For additional background on the ETF ranking system see NTSM Page at…
http://navigatethestockmarket.blogspot.com/p/exchange-traded-funds-etf-ranking.html
Here’s the revised DOW 30 and its momentum analysis. The top ranked stock receives 100%. The rest are then ranked based on their momentum relative to the leading stock.

For more details, see NTSM Page at…
https://navigatethestockmarket.blogspot.com/p/a-system-for-trading-dow-30-stocks-my_8.html