“Trade what you see; not what you think.” – The Old Fool,
Richard McCranie, trader extraordinaire.
“Faced with a combination of record speculative extremes
and deteriorating speculative conditions, investors may want to remember that
the best time to panic is before everyone else does.” – John Hussman, Phd.
“I wouldn’t want to keep money in a bank that can’t
access the SWIFT system. Once a bank can’t transfer or receive funds from other
banks, its solvency can be at risk. If I were Russian, I would take my money
out now.” – Bill Ackman, Hedge Fund Manager.
"I’ve stood in lines for an hour [at an ATM machine],
but foreign currency is gone everywhere, just rubles...I got a
late start [Sunday] because I didn’t think this was possible. I’m in shock.” Vladimir,
a 28-year-old Russian programmer who declined to give his last name.
CHICAGO PMI (Advisor perspectives)
“The latest Chicago Purchasing Manager's Index, or the
Chicago Business Barometer, fell to 56.3 in February from 65.2 in December...Values
above 50.0 indicate expanding manufacturing activity.” Commentary at...
CASS FREIGHT INDEX (Cass Information Systems)
“U.S. freight volumes reeled in January from the surge in
Omicron cases, with the shipments component of the Cass Freight Index® down
10.8% from December and down 2.9% y/y. The 7.4% m/m (SA) drop in January in the
shipments component of the Cass Freight Index is about as good an answer as we
have to the question of how big an impact Omicron-related absenteeism and
quarantines had on the freight economy. While these effects are lingering in
February, they are beginning to fade and we expect a rebound in the coming
months as case counts fall sharply.” Report at...
https://www.cassinfo.com/freight-audit-payment/cass-transportation-indexes/january-2022
STEEP AND DEEP – PERHAPS “A” BOTTOM BUT NOT “THE” BOTTOM
(Heritage Capital)
“January 24th was “A” bottom. Now, all of the conditions
have been for a second bottom which may or may not be the ultimate low. Stocks
should rally. The quality of that rally will determine where the market is in
the cycle. We really want to see enormous and relentless buying interest. In
other words, a thrust.” Commentary at...
https://investfortomorrow.com/blog/steep-deep/
RUSSIA INVASION SENDS STOCKS RALLYING? (Real Investment
Advice)
“While everyone remains focused on the Russia invasion of
Ukraine, it is the Fed that remains the most significant risk to stocks. While
we do expect a continued rally over the next few days, primarily from
short-covering and too many “put options,” these strong counter-trend
reflex rallies only exist during more meaningful correction processes. As
Michael Lebowitz shows, since 2000, there are only 5-previous instances of the
Nasdaq opening down 3% but closing up 3%. All of those instances occurred
during the bear markets of 2000 and 2008. Such is one reason why we are
remaining cautious near term.” Commentary at...
https://realinvestmentadvice.com/russia-invasion-sends-stocks-rallying/
MARKET REPORT / ANALYSIS
-Monday the S&P 500 slipped about 0.2% to 4374.
-VIX rose about 9% to 30.02. (No, it’s not a typo – the
Options Folks are worried.)
-The yield on the 10-year Treasury slipped to 1.828%.
Pullback Data:
Days since top: 38 (Avg= 30 days top to bottom for
corrections <10%; 60 days top to bottom for larger, non-crash pullbacks)
Drop from Top: Now 8.8% at close. Max at close: 11.9%
(Avg.= 13% for non-crash pullbacks)
The S&P 500 is 2% BELOW its 200-dMA & 3.9% BELOW
its 50-dMA.
Max Retracement from bottom: 56% 2 Feb.
The slope of the 200-dMA is up.
Markets were down Sunday night with S&P 500 futures
down 2.5%. They improved to around 1.5% down at the open Monday morning; the
S&P 500 finished only 0.2% down. The
markets are working hard to get past a lot of negative data. The number one
issue now might be how are the sanctions going to impact the economy? It could
get quite nasty, but we don’t know. The
markets hate uncertainty.
VIX is still rising sharply and it was up again today. That’s a good indicator that should worry the
bulls.
On 25 February, the 52-week, New-high/new-low ratio
improved by 4.2 standard deviations. That’s a very Bullish sign, but during the
Coronavirus correction there were 3 new-high/new-low improvements that were
higher and none signaled a bottom. We need to see this indicator supported by
additional bullish signs. The spread (new-highs minus new-lows) got worse today
and the bulls want to see a positive number there. We did see some more positive
numbers in short-term indicators.
The daily sum of 20 Indicators improved from +4 to +7 (a
positive number is bullish; negatives are bearish); the 10-day smoothed sum
that smooths the daily fluctuations improved from -48 to -38 (The trend direction
is more important than the actual number for the 10-day value.) These numbers
sometimes change after I post the blog based on data that comes in late. Most
of these indicators are short-term so they tend to bounce around a lot. Long-term
indicators improved too.
The Long Term NTSM indicator
ensemble improved to HOLD. VIX is bearish; Volume, Price & Sentiment are
Neutral; New-High/New-Low data is bullish based on the 25 Feb swing in
new-high/new-low data.
I like to see a bottom tested at a lower price with lower
volume and improvements in market internals and divergences. The data didn’t meet the criteria at the 23
Feb bottom, so I am left looking for a strong confirmation of the move higher,
especially in volume and breadth. So far, I haven’t seen it. Whether we retest
the low remains to be seen.
I am still hoping to be able to call a bottom.
Until we see more bullish signs, I remain bearish.
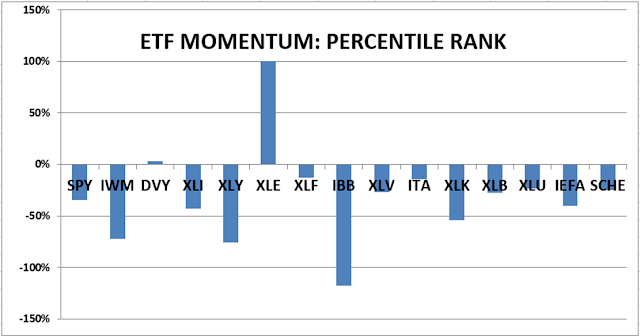
BEST ETFs - MOMENTUM ANALYSIS:
TODAY’S RANKING OF 15 ETFs
(Ranked Daily)
The top ranked ETF receives
100%. The rest are then ranked based on their momentum relative to the leading
ETF.

*For additional background on the ETF ranking system see NTSM Page at…
http://navigatethestockmarket.blogspot.com/p/exchange-traded-funds-etf-ranking.html

BEST DOW STOCKS - TODAY’S MOMENTUM RANKING OF THE DOW 30 STOCKS (Ranked Daily)
Here’s the revised DOW 30 and
its momentum analysis. The top ranked stock receives 100%. The rest are then
ranked based on their momentum relative to the leading stock.

For more details, see NTSM Page at…
https://navigatethestockmarket.blogspot.com/p/a-system-for-trading-dow-30-stocks-my_8.html

MONDAY MARKET INTERNALS (NYSE DATA)

Market Internals are a decent
trend-following analysis of current market action, but should not be used alone
for short term trading. They are usually right, but they are often late. They are most useful when they diverge from
the Index.
I trade about 15-20% of the
total portfolio using the momentum-based analysis I provide here. If I can see
a definitive bottom, I’ll add a lot more stocks to the portfolio using an
S&P 500 ETF.
You may wish to have a higher
or lower % invested in stocks depending on your risk tolerance. 50% is a
conservative position that I consider fully invested for most retirees.
As a general rule, some
suggest that the % of portfolio invested in the stock market should be one’s
age subtracted from 100. So, a
30-year-old person would have 70% of the portfolio in stocks, stock mutual
funds and/or stock ETFs. That’s ok, but
for older investors, I usually don’t recommend keeping less than 50% invested
in stocks (as a fully invested position) since most people need some growth in
the portfolio to keep up with inflation.