“Trade what you see; not what you think.” – The Old Fool,
Richard McCranie, trader extraordinaire.
“Faced with a combination of record speculative extremes
and deteriorating speculative conditions, investors may want to remember that
the best time to panic is before everyone else does.” – John Hussman, Phd.
Kandiss Taylor received just 3.4% of the vote in the GOP
primary for Georgia governor...Taylor is refusing to concede and claims the
election was rigged. What planet is this woman from? Needless to say, she is a
Trumpette.
CHICAGO PMI (MarketWatch)
“The Chicago Business Barometer, also known as the
Chicago PMI, rose to 60.3 in May from 56.4 in the prior month. Economists
polled by the Wall Street Journal forecast a 55.9 reading.” Story at...
https://www.marketwatch.com/story/chicago-pmi-jumps-in-may-beating-expectations-11654005362
CONSUMER CONFIDENCE (Conference Board via prnewswire.com)
“The Conference Board Consumer Confidence Index® decreased slightly in May,
following a small increase in April... "Consumer confidence dipped
slightly in May, after rising modestly in April," said Lynn Franco, Senior Director of Economic Indicators at
The Conference Board. "The decline in the Present Situation Index was
driven solely by a perceived softening in labor market conditions. By contrast,
views of current business conditions—which tend to move ahead of trends in
jobs—improved.” Press release at...
https://www.prnewswire.com/news-releases/consumer-confidence-declined-slightly-in-may-301557849.html
DEPARTMENT OF JUSTICE STUDY ON THE EFFECTIVNESS OF THE ASSAULT
WEAPONS (AW) BAN IN 1994 (factcheck.org)
The 2004 study led by Christopher S. Koper was titled, “An Updated
Assessment of the Federal Assault Weapons Ban: Impacts on Gun Markets and Gun
Violence, 1994-2003.” That report was the final of three studies of
the ban, which was enacted in 1994 as part of the Violent Crime
Control and Law Enforcement Act of 1994. It concluded:
“Although the ban has been successful in reducing crimes
with AWs [Assault Weapons], any benefits from this reduction are likely to have
been outweighed by steady or rising use of non-banned semiautomatics with LCMs
[large-capacity magazines], which are used in crime much more frequently than
AWs. Therefore, we cannot clearly credit the ban with any of the nation’s
recent drop in gun violence. And, indeed, there has been no discernible
reduction in the lethality and injuriousness of gun violence, based on
indicators like the percentage of gun crimes resulting in death or the share of
gunfire incidents resulting in injury, as we might have expected had the ban
reduced crimes with both AWs and LCMs.” Fact check at...
My cmt: (I don’t own an AW nor do have a desire to; I just
thought this piece was interesting. As a numbers guy, I would rather have
decisions made on the basis of measurable results rather than emotional
reactions. Keeping guns out of the hands of crazy people would be far more
effective than banning a specific type of gun. In Virginia, a judge can issue
an Extreme Risk Protective Order, enabling the
police to temporarily confiscate the firearms of a person deemed to be at high
risk of harming themselves or others. It would be interesting to see how often
this has occurred. For more, including case studies where mass shootings were
prevented around the country, see here...
https://efsgv.org/learn/policies/extreme-risk-laws/
MARKET REPORT / ANALYSIS
-Tuesday the S&P 500 rose about 0.6% to 4132 stopping
at the upper trend-line.
-VIX rose about 2% to 26.19. (The Options Crowd didn’t
get too excited over today’s decline.)
-The yield on the 10-year Treasury rose to 2.853%.
PULLBACK DATA:
-Drop from Top: 13.9% as of today. 18.7% max. (Avg.= 13%
for non-crash pullbacks)
-Days from Top to Bottom: 102-days. (Avg= 30 days top to
bottom for corrections <10%; 60 days top to bottom for larger, non-crash
pullbacks)
The S&P 500 is 7.2% BELOW its 200-dMA & 3.2%
BELOW its 50-dMA.
*I won’t call the correction over until the S&P 500
makes a new-high; however, we hope to be able to call the bottom when we see
it...and...we did call the market a trading “Buy” one day after the recent
trading-bottom on 12 May...
MY TRADING POSITIONS:
QQQ*
UWM*
XLE
DOW
*Sell when the markets make it to the 50-dMA. I may break
this rule too...we’ll see. I still suspect this is just a Bear Market Rally.
TODAY’S COMMENT:
Since 2002 there have been only 4 corrections that
exceeded 15% on the S&P 500. A 19% correction in 2011; a 34% Coronavirus correction
in 2020; a 57% Financial correction in 2009; and the current “Everything”
Correction (19% max so far).
From top to bottom, the previous 3 corrections lasted
108-days; 23-days and more than 200-days respectively. The current correction
is already past the very short Coronavirus bear market. Currently, the 2011,
19% correction compares well to the ongoing downturn. If the S&P 500 can make a new high, then
the current correction will have lasted 95 days and dropped 19%.
Unfortunately, we can’t foretell the future; the 57% drop
that we saw in the Financial Crisis is still on the table as is the 37% drop
during the 2000-2002 DotCom Crash.
Pop Quiz: What ended the stock market drop during the Financial
Crisis? Ans. A simple accounting rule. Specifically, it was the suspension of
Mark-to-Market accounting rules that required assets to be valued at fair-market-value.
A new accounting rule allowed more lenient valuation of illiquid securities,
swaps, housing, etc. By allowing more liberal asset valuations, the banks essentially
got a massive increase in reserves and it eliminated the risk of Bank failures. The stock market bottomed.
I point this out to suggest that markets are likely to
fall until the Fed become more accommodative either by ending rate hikes or Balance
Sheet reductions. For now, I suspect the counter-trend rally will continue. Today
just proved that markets don’t go up forever.
Tuesday, there was high unchanged-volume. Many believe
that this indicator suggests investor confusion at market turning points.
Recent history shows this indicator has indicated a reversal of some kind,
either now, or near future. My problem is that it is frequently a false signal.
At this point if the indicator is sending a decent signal, the direction of reversal
would be down. As I write this, futures are up, so perhaps this time the
unchanged-indicator signal will be wrong.
Market internals were in line with what would be expected
for a down day like today, except that there were 105 new-highs and only 33
new-lows. That continues a steady improvement in the new-high/new-low data and
suggests we’re still in rally mode.
Today, the daily sum of 20 Indicators declined from +15
to +13 (a positive number is bullish; negatives are bearish); the 10-day
smoothed sum that smooths the daily fluctuations improved from +76 to +80. (The
trend direction is more important than the actual number for the 10-day value.)
These numbers sometimes change after I post the blog based on data that comes
in late. Most of these 20 indicators are short-term so they tend to bounce
around a lot.
LONG-TERM INDICATOR: The Long
Term NTSM indicator was HOLD: SENTIMENT & VOLUME are bullish; VIX is
bearish; and PRICE is hold. Only 46 days
out of the last 100 have been up-days; that leans bullish.
I am Bullish in the short-term and Bearish longer-term. I
expect a rally in the 7-9% range. Around 4300 is as good a target as any. We’ll
see when we get there.
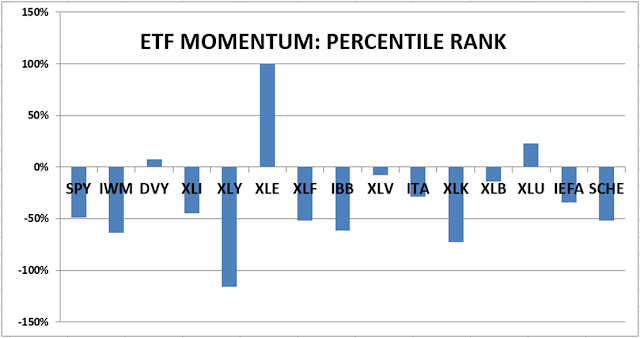
BEST ETFs - MOMENTUM ANALYSIS:
TODAY’S RANKING OF 15 ETFs
(Ranked Daily)
The top ranked ETF receives
100%. The rest are then ranked based on their momentum relative to the leading ETF.

http://navigatethestockmarket.blogspot.com/p/exchange-traded-funds-etf-ranking.html
BEST DOW STOCKS - TODAY’S MOMENTUM
RANKING OF THE DOW 30 STOCKS (Ranked Daily)
Here’s the revised DOW 30 and
its momentum analysis. The top ranked stock receives 100%. The rest are then
ranked based on their momentum relative to the leading stock.

https://navigatethestockmarket.blogspot.com/p/a-system-for-trading-dow-30-stocks-my_8.html
TUESDAY MARKET INTERNALS (NYSE
DATA)

Market Internals are a decent
trend-following analysis of current market action, but should not be used alone
for short term trading. They are usually right, but they are often late. They are most useful when they diverge from
the Index.
My stock-allocation in the
portfolio is now roughly 45% invested in stocks, but some percentage includes
trading-positions that I will exit if a rally fails to materialize. This is
slightly below my “normal” fully invested stock-allocation of 50%.
I trade about 15-20% of the
total portfolio using the momentum-based analysis I provide here. If I can see
a definitive bottom, I’ll add a lot more stocks to the portfolio using an
S&P 500 ETF.
You may wish to have a higher
or lower % invested in stocks depending on your risk tolerance. 50% is a
conservative position that I consider fully invested for most retirees.
As a general rule, some
suggest that the % of portfolio invested in the stock market should be one’s
age subtracted from 100. So, a
30-year-old person would have 70% of the portfolio in stocks, stock mutual
funds and/or stock ETFs. That’s ok, but
for older investors, I usually don’t recommend keeping less than 50% invested
in stocks (as a fully invested position) since most people need some growth in
the portfolio to keep up with inflation.